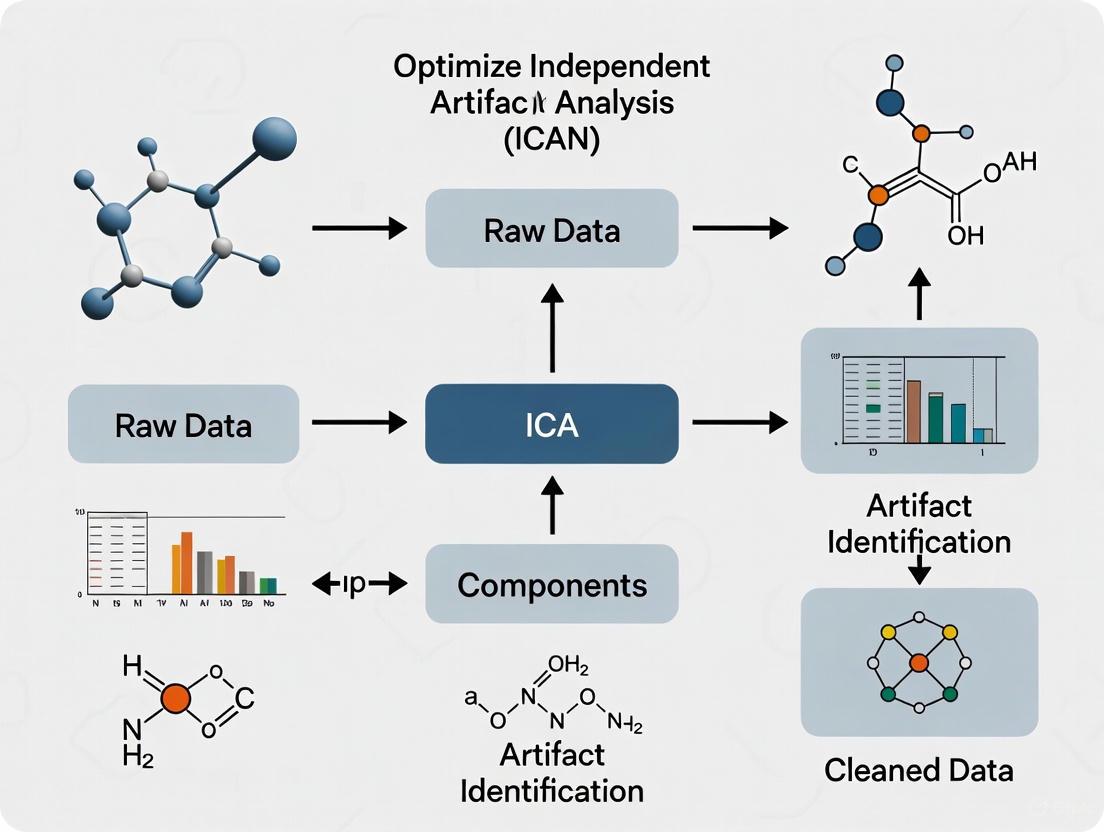
Optimizing ICA for EEG Artifact Removal: A Strategic Guide for Biomedical Research
Independent Component Analysis (ICA) is a cornerstone technique for isolating and removing artifacts from electroencephalography (EEG) data, a critical step in neuroimaging for drug development and clinical research.
Optimizing ICA for EEG Artifact Removal: A Strategic Guide for Biomedical Research
Abstract
Independent Component Analysis (ICA) is a cornerstone technique for isolating and removing artifacts from electroencephalography (EEG) data, a critical step in neuroimaging for drug development and clinical research. This article provides a comprehensive framework for optimizing ICA component selection, moving from foundational principles to advanced validation. We explore the core assumptions of ICA and the challenges posed by motion and physiological artifacts. The guide details current automated and semi-automated classification methods, including ICLabel and novel deep-learning approaches, and offers troubleshooting strategies for common pitfalls like overcleaning and motion artifact handling. Finally, we present rigorous validation methodologies and comparative analyses with emerging techniques like iCanClean and ASR, empowering researchers to enhance data integrity and accelerate biomarker discovery.
Understanding ICA: Core Principles and the Challenge of Artifacts
Independent Component Analysis (ICA) is a fundamental blind source separation technique widely used across various scientific fields, including biomedical signal processing and drug development. For researchers focused on artifact removal, a deep understanding of the basic ICA model is the first critical step toward optimizing its performance. This technical resource center addresses the core concepts and common experimental challenges associated with implementing ICA, providing targeted troubleshooting and proven methodologies to enhance the reliability of your results.
Frequently Asked Questions (FAQs)
1. What is the core mathematical principle behind ICA? ICA operates on the principle that observed signals are linear mixtures of statistically independent sources. The model is formulated as X = AS, where X is the observed data matrix, A is the mixing matrix, and S contains the independent source signals [1]. The goal is to find a demixing matrix W (where W = A⁻¹) to recover the source estimates via S = WX. The solution relies on maximizing the non-Gaussianity or statistical independence of the components, often using algorithms like Infomax or FastICA [2].
2. Why is determining the correct number of Independent Components (ICs) crucial? Selecting the optimal number of ICs is vital to avoid under-decomposition (where artifacts and neural signals remain mixed) or over-decomposition (where neurogenic activity is split into multiple, less meaningful components, potentially distorting the signal) [3] [4]. An incorrect number can severely hamper effective source separation and subsequent artifact removal, leading to unreliable data [2].
3. What is "whitening" and why is it an essential pre-processing step? Whitening (or sphering) is a preprocessing step that removes any correlations between the data channels. It transforms the data so that its covariance matrix becomes the identity matrix [1]. Geometrically, this process restores the initial "shape" of the data cloud, after which ICA only needs to perform a rotation to find the independent components. This simplifies the computation and is a standard first step in most ICA algorithms [1].
4. My ICA-corrected data still shows residual artifacts. What is the most likely cause? Residual artifacts are often a sign of undercorrection. With commonly used settings, Infomax ICA can leave artifacts in the data and even distort neurogenic activity [5]. This can be mitigated by optimizing key pipeline parameters, such as:
- The high-pass and low-pass filters applied to the training data.
- Massively overweighting the proportion of training data containing prominent artifacts like saccadic spike potentials (SP) [5].
5. How can I objectively evaluate the quality of my ICA decomposition for artifact removal? Correction quality should be quantified in terms of both undercorrection (residual artifacts) and overcorrection (removal of neurogenic activity) [5]. Using objective measures like an eye-tracker can help quantify residual artifacts. Furthermore, decomposition quality can be evaluated using metrics like:
- The mutual information between components.
- The proportion of brain, muscle, and 'other' components identified.
- The residual variance of brain components [4].
Troubleshooting Guides
Problem 1: Poor ICA Decomposition Quality
Symptoms: High mutual information between components, a low proportion of identified brain components, or a high residual variance in brain components after decomposition [4].
| Investigation Step | Action & Diagnostic |
|---|---|
| Check Data Cleaning | Evaluate the impact of automatic sample rejection. Tools like the AMICA algorithm's built-in rejection function can iteratively remove bad samples based on model fit (log-likelihood) [4]. |
| Assess Data Quality | Determine if excessive movement artifacts are present. Note that increased movement intensity in mobile experiments can significantly decrease decomposition quality [4]. |
| Optimize Parameters | Systematically vary and optimize key parameters: (1) high-pass/low-pass filter cutoffs for training data, (2) overweighting data sections with strong artifacts, and (3) the threshold for component rejection [5]. |
Problem 2: Determining the Optimal Number of ICs
Challenge: It is difficult to know how many Independent Components (ICs) to extract, and an incorrect number leads to either under- or over-decomposition.
Solution A: Employ a Block-Similarity Method (e.g., TSS-ICA or CW_ICA) This method is suitable for datasets of various sizes and does not require prior knowledge of the source signals [3] [2].
- Step 1: Use a flexible blocking strategy (like two-stage sampling) to divide the observed signals into two representative sub-blocks.
- Step 2: Run ICA separately on each sub-block, extracting different numbers of ICs.
- Step 3: Calculate the similarity between the ICs extracted from the two blocks. A novel similarity measurement can be used, and hypothesis testing (with Bonferroni correction) can identify "remarkably similar" components [3].
- Step 4: The optimal number of ICs is the maximum number at which corresponding components between blocks remain highly similar. A sudden drop in similarity indicates that the extraction of pure components has been exceeded [3] [2].
Solution B: Leverage the Durbin-Watson (DW) Criterion This method uses the residual signal after reconstructing the data with a set number of ICs [2].
- Procedure: Calculate the DW statistic for the residual matrix. A DW value tending towards 0 suggests the signal is noise-free and requires further decomposition (under-decomposition). A value close to 2 indicates the signal is noisy and has been over-decomposed [2].
Experimental Protocols for Key Cited Studies
Protocol 1: Optimizing ICA for Ocular Artifact Removal in Free-Viewing Experiments [5]
- Data Collection: Combine EEG with eye-tracking during tasks with unconstrained eye movements (e.g., visual search or sentence reading).
- Parameter Optimization: Orthogonally vary four key parameters in your ICA pipeline:
- High-pass filter cutoff for training data.
- Low-pass filter cutoff for training data.
- Proportion of training data containing saccadic spike potentials (SP).
- Threshold for eye tracker-based component rejection.
- Quality Assessment: Use the eye-tracker to objectively quantify correction quality, measuring both residual artifacts (undercorrection) and the removal of neurogenic activity (overcorrection).
- Benchmarking: Compare the performance of your optimized Infomax ICA against an alternative spatial filter like Multiple Source Eye Correction (MSEC).
Protocol 2: Evaluating the Impact of Data Cleaning on ICA Decomposition [4]
- Dataset Selection: Acquire EEG datasets with varying degrees of participant mobility (from stationary to mobile setups).
- Apply Cleaning: Process the data using the AMICA algorithm, systematically varying the cleaning strength (number of cleaning iterations and rejection thresholds).
- Quality Metrics: For each decomposition, calculate:
- Mutual information between components.
- The proportion of components classified as brain, muscle, or 'other'.
- Residual variance of brain components.
- Signal-to-noise ratio in specific conditions.
- Analysis: Statistically analyze how movement intensity and cleaning strength affect the decomposition quality metrics.
Table 1. Effects of Data Cleaning on ICA Decomposition Quality (AMICA Algorithm) [4]
| Movement Intensity | Cleaning Strength | Effect on Decomposition Quality |
|---|---|---|
| High (within a study) | Not Applied | Significant decrease in quality |
| Variable (across studies) | Not Applied | Effect not consistently significant |
| Any | Low (e.g., 1-2 iterations) | Minor improvement |
| Any | Moderate (e.g., 5-10 iterations) | Likely significant improvement |
| Any | High | Improvement smaller than expected; AMICA is robust with limited cleaning |
Table 2. Methods for Determining the Optimal Number of ICs
| Method | Principle | Key Metric | Pros | Cons |
|---|---|---|---|---|
| TSS-ICA/CW_ICA [3] [2] | Block Similarity | Maximum rank-based correlation between ICs from two data sub-blocks | No prior knowledge needed; suitable for small samples; statistically rigorous | Requires data segmentation |
| Durbin-Watson (DW) [2] | Residual Analysis | DW statistic of residual signals (0=under, 2=over) | Conceptually simple | Can be unstable with real-world, non-linear signals |
| KMO-ICA [3] | Partial Correlation | Kaiser-Meyer-Olkin index of the residual matrix | Does not require source prior knowledge | Struggles with unstructured data; matrix inversion issues with high correlation |
Workflow Visualization
ICA Artifact Removal Workflow
Optimal IC Number Determination
The Scientist's Toolkit
Table 3. Essential Research Reagents & Computational Tools
| Item Name | Function & Application | Key Notes |
|---|---|---|
| Infomax ICA [1] | A common algorithm for performing ICA decomposition. | Minimizes mutual information between output components. Available in toolboxes like EEGLAB. |
| AMICA Algorithm [4] | A powerful ICA algorithm with integrated automatic sample rejection. | Can iteratively reject bad samples during decomposition based on model log-likelihood, improving results. |
| FastICA Algorithm [2] | A widely-used algorithm for ICA that maximizes non-Gaussianity. | Known for its computational efficiency. |
| Eye Tracker [5] | Objective validation tool for quantifying ocular artifacts pre- and post-ICA correction. | Critical for benchmarking artifact removal efficacy and optimizing pipeline parameters. |
| CW_ICA / TSS-ICA [3] [2] | Methods to determine the optimal number of ICs via data blocking and similarity testing. | TSS-ICA is designed to work well with small-scale datasets, a common challenge. |
| Durbin-Watson Criterion [2] | A statistical metric used as a method to determine IC optimal number via residual analysis. | Values near 0 suggest under-decomposition; values near 2 suggest over-decomposition. |
FAQ: A Researcher's Guide to EEG Artifacts
Q1: What is an EEG artifact and why is its removal critical for research? An EEG artifact is any recorded signal that does not originate from neural activity. These unwanted signals contaminate the recording and can obscure the underlying brain signals, which are typically in the microvolt range (a few to tens of microvolts) and therefore have a very low amplitude [6]. Ensuring clean signals is a fundamental preliminary step in EEG analysis because artifacts can compromise data quality, lead to misinterpretation of results, and in clinical contexts, even cause misdiagnosis (e.g., by mimicking epileptiform activity) [6] [7].
Q2: What are the main categories of EEG artifacts? EEG artifacts are broadly categorized into two groups based on their origin [6] [7]:
- Physiological Artifacts: These originate from the subject's own body. Key examples include ocular artifacts (EOG from eye blinks and movements), muscle artifacts (EMG from jaw clenching, swallowing), cardiac artifacts (ECG from heartbeats), and artifacts from perspiration or respiration [6].
- Non-Physiological Artifacts: These are technical artifacts stemming from external sources. Common types are electrode "pop" from sudden impedance changes, cable movement, AC power line interference (50/60 Hz), and incorrect reference electrode placement [6].
Q3: How do different artifacts impact the ICA component selection process? Independent Component Analysis (ICA) works by separating mixed signals into statistically independent components [8]. Successful identification and rejection of artifact-related components are crucial. Each artifact type has a distinct "signature" that can be recognized in the ICA component's properties [9]:
- Ocular (EOG) Components: Exhibit a characteristic scalp topography with strong frontal projections. Their activity time course shows high-amplitude, low-frequency deflections corresponding to blinks or saccades, and the power spectrum shows a smoothly decreasing pattern [9].
- Muscle (EMG) Components: Often show a focal, irregular topography. Their activity is high-frequency and non-rhythmic, and the power spectrum is broad and dominates the beta and gamma frequency ranges [6].
- Cardiac (ECG) Components: Typically show a rhythmic waveform in the component time course that correlates with the heart rate. The topography may be prominent in channels close to the neck [6].
Q4: What are the specific challenges of artifact removal in modern wearable EEG studies? Wearable EEG systems, often using dry electrodes and fewer channels (typically below 16), face unique challenges [10] [11]. The uncontrolled, "in-motion" recording conditions introduce more and stronger motion artifacts. Furthermore, the low number of channels limits the effectiveness of standard source separation methods like ICA, making artifact removal more difficult and driving the need for novel, tailored algorithms [10].
The following table summarizes the key characteristics of the most common physiological artifacts, providing a reference for their identification.
Table 1: Characteristics of Common Physiological EEG Artifacts
| Artifact Type | Origin | Time-Domain Signature | Frequency-Domain Signature | Impact on ICA |
|---|---|---|---|---|
| Ocular (EOG) | Corneo-retinal potential dipole; eye blinks and movements [6]. | Sharp, high-amplitude deflections (100-200 µV), especially over frontal electrodes (Fp1, Fp2) [6]. | Dominant in low frequencies (Delta: 0.5-4 Hz, Theta: 4-8 Hz), potentially mimicking cognitive processes [6]. | Components with strong frontal topography and low-frequency, high-amplitude activity are likely ocular and should be flagged for rejection [9]. |
| Muscle (EMG) | Electrical activity from muscle contractions (e.g., jaw, neck, face) [6]. | High-frequency, sharp activity superimposed on the EEG; amplitude proportional to contraction strength [6]. | Broadband noise, dominating Beta (13-30 Hz) and Gamma (>30 Hz) ranges, masking cognitive signals [6]. | Components with a focal topography and high-frequency, non-stationary activity are characteristic of muscle artifacts. |
| Cardiac (ECG) | Electrical signal from heartbeats [6]. | Rhythmic, periodic waveforms recurring at the heart rate, often visible in central or neck-adjacent channels [6] [12]. | Overlaps several EEG bands; may show a peak at the heart rate frequency (typically ~1-1.7 Hz) [6]. | Components showing a consistent, periodic pattern that correlates with a simultaneously recorded ECG channel are likely cardiac. |
| Motion | Gross motor activity disrupting the electrode-skin interface (head/body movements) [6]. | Large, slow baseline drifts or sudden, non-linear noise bursts [6] [13]. | Can introduce power at the frequency of movement (e.g., gait frequency and its harmonics during walking/running) [13]. | Motion artifacts can severely compromise the quality of the ICA decomposition itself, making it harder to isolate clean brain or other artifact components [13]. |
Experimental Protocols for Artifact Management
Protocol 1: Standard ICA for Ocular Artifact Removal
This protocol outlines the standard methodology for using ICA to identify and remove ocular artifacts, such as blinks, from multi-channel EEG data [8] [9].
Methodology:
- Data Preprocessing: Load the EEG dataset. It is recommended to reject bad channels and bad data portions before running ICA, though the algorithm can run on basically clean data [9].
- Channel Selection: Select the EEG channels to be used for the decomposition. Typically, all scalp EEG channels are included, while non-EEG channels (like dedicated EOG/EMG) are excluded [9].
- ICA Execution: Run the ICA decomposition using an algorithm such as Infomax ICA (
runica). The algorithm assumes the data is a linear mix of statistically independent, non-Gaussian sources and calculates an "unmixing matrix" (W) to separate them such thatS = WX, where X is the measured data and S is the matrix of independent components [8]. - Component Inspection: Inspect the resulting independent components using tools that visualize the component's scalp topography, activity time course, and power spectrum [9].
- Artifact Identification & Rejection: Identify components corresponding to ocular artifacts based on their typical frontal topography, high-amplitude deflections in the time course that match blinks, and a smoothly decreasing power spectrum [9].
- Data Reconstruction: Reconstruct the artifact-corrected EEG signal by projecting the components back to the sensor space, excluding (zeroing out) the artifact components identified in the previous step [8].
Protocol 2: Targeted QRS-Complex Based ECG Artifact Removal
This protocol describes a method to specifically remove ECG artifacts by detecting the QRS complex in a synchronized ECG recording and applying a filter only to the contaminated segments, thus minimizing the loss of neural information [12].
Methodology:
- Acquire Reference Signal: Simultaneously record a reference ECG signal alongside the EEG.
- Detect R-Peaks: Apply an R-peak detection algorithm (e.g., the open-source
R_peak_detect.mfunction in MATLAB) to the ECG signal to identify the location of each heartbeat [12]. - Define QRS Complexes: Use the detected R-peaks as reference points to define the time windows of the QRS complexes [12].
- Apply Targeted Filtering: Instead of filtering the entire EEG signal, apply a zero-phase filter (or another suitable filter) only to the EEG segments that correspond to the identified QRS complex windows. This preserves the integrity of the EEG signal outside of these specific periods [12].
- Analyze Cleaned EEG: Proceed with the analysis of the noise-free EEG signal.
The workflow for this targeted approach is outlined below.
Protocol 3: Advanced Processing for Motion Artifacts in Mobile EEG
For movement-intensive studies (e.g., locomotion), specialized preprocessing before ICA is often necessary. This protocol compares two modern approaches: Artifact Subspace Reconstruction (ASR) and iCanClean [13].
Methodology:
- Data Acquisition: Record EEG data during dynamic tasks (e.g., running) using a mobile EEG system. The use of "dual-layer" sensors, which include a noise-reference electrode, is ideal for iCanClean [13].
- Approach Selection:
- Artifact Subspace Reconstruction (ASR): This method uses a sliding-window Principal Component Analysis (PCA) to identify and remove high-variance signal components that exceed a user-defined threshold (standard deviation 'k') compared to a clean baseline calibration period. A higher k value (e.g., 20-30) is less aggressive, while a lower value cleans more aggressively [13].
- iCanClean: This method uses Canonical Correlation Analysis (CCA) to identify subspaces in the scalp EEG that are highly correlated with subspaces in a noise reference. The correlated noise components are then subtracted. The noise reference can come from dual-layer electrodes or be created as a "pseudo-reference" from the raw EEG itself (e.g., by notch-filtering below 3 Hz to isolate motion artifact). The aggressiveness is controlled by an R² threshold [13].
- Evaluation of Cleaning: The success of these methods can be evaluated by assessing the dipolarity of the resulting ICA components, the reduction of spectral power at the gait frequency and its harmonics, and the ability to recover expected event-related potentials (ERPs) like the P300 [13].
The Scientist's Toolkit: Research Reagent Solutions
Table 2: Essential Tools and Datasets for EEG Artifact Removal Research
| Tool/Resource | Function/Benefit | Example Use-Case |
|---|---|---|
| EEGLAB | An interactive MATLAB toolbox for processing EEG data. It provides a comprehensive framework for ICA, including running algorithms and component inspection tools [9]. | The primary platform for implementing Protocol 1 (Standard ICA), allowing researchers to visualize component topographies, spectra, and time courses to make informed rejection decisions [9]. |
| ICLabel | An EEGLAB plugin that automatically classifies ICA components into categories (e.g., "Brain", "Eye", "Muscle", "Heart", "Line Noise", "Channel Noise", "Other") using a trained dataset [13]. | Provides an initial, automated labeling of components to assist researchers, particularly those new to ICA, in the component selection process. Note: it may be less effective on data with strong motion artifacts [13]. |
| EEGdenoiseNet | A benchmark dataset provided as a semi-synthetic library of clean EEG, EOG, and EMG signals. Researchers can mix these to create datasets with known ground truth [14]. | Invaluable for training and evaluating new deep learning models (like CLEnet) for artifact removal, as it allows for quantitative performance measurement via SNR and Correlation Coefficient [14]. |
| Deep Learning Models (e.g., CLEnet) | Emerging models that combine architectures like CNN and LSTM in an end-to-end network to separate artifacts from EEG signals without requiring manual component selection [14]. | Used for automated, robust artifact removal from multi-channel EEG data, showing superior performance in removing mixed and unknown artifacts compared to traditional models [14]. |
| Fixed Frequency EWT + GMETV | A novel method designed for single-channel EEG that automates the removal of EOG artifacts by decomposing the signal and filtering out contaminated components [15]. | A specialized solution for the growing field of portable, single-channel EEG devices where multi-channel techniques like ICA are not applicable [15]. |
FAQs: Understanding the Core Challenge
Q1: Why is it so difficult to automatically distinguish brain signal components from artifact components in ICA? The core challenge lies in the significant overlap in the statistical and physiological characteristics of brain and artifact components. ICA separates data into maximally independent sources, but it is a purely statistical technique and cannot distinguish between neural and non-neural sources based on the intended research goal. Therefore, components representing, for example, brain activity and muscle activity can appear similarly non-Gaussian and statistically independent, making them hard to separate using simple, automated thresholds [16] [17] [18].
Q2: What are the specific characteristics where this overlap occurs? The overlap primarily manifests in four key domains, which are typically used to classify components:
- Spatial Topography: While eye blink artifacts often have a characteristic frontal distribution, other artifacts like muscle tension can have topographies that overlap with brain regions of interest [9] [17].
- Temporal Activity: The time courses of some high-frequency brain oscillations (e.g., gamma) can be mistaken for the high-frequency, burst-like activity of muscle artifacts (EMG) [17].
- Spectral Profile: The power spectrum of an artifact can sometimes mimic that of brain signals. For instance, the smoothly decreasing spectrum of an eye artifact can overlap with the spectral profile of certain brain rhythms [9].
- Statistical Properties: Measures of non-Gaussianity, like kurtosis, which are used to find independent components, can be high for both brain-derived and artifactual sources. A component with a peaky distribution could be an eye blink or an epileptic spike [18] [19].
Q3: In what specific experimental paradigms is ICA-based artifact removal most likely to be unreliable? ICA performance can be compromised when the artifact has low trial-to-trial variability. Research on Transcranial Magnetic Stimulation (TMS)-evoked potentials has shown that if an artifact repeats very similarly after each TMS pulse, it can break the statistical independence assumption of ICA. This can cause the algorithm to inaccurately separate components, potentially removing brain signals along with the artifact and biasing the results [16].
Q4: How can researchers estimate the reliability of their ICA decomposition for a given dataset? Even without a ground truth, one can assess reliability. A study on TMS-EEG suggested that the trial-to-trial variability of the identified artifact components can be measured after ICA is run. Low variability in a component may indicate a higher risk of an unreliable decomposition and spurious cleaning [16]. Furthermore, using tools like the RELICA plugin in EEGLAB allows researchers to assess the stability of their ICA results through bootstrapping, revealing which components are robustly identified across multiple runs [9].
The following tables consolidate quantitative findings from research on artifact detection and removal.
Table 1: Performance Comparison of Automatic Artifact Detection Methods
| Detection Method | Key Features Used | Average Performance (Mean Squared Error) | Notes |
|---|---|---|---|
| ICA + Renyi's Entropy [19] | Renyi's entropy (order 2) | 7.4% Error | Outperformed the kurtosis/Shannon entropy method, and was able to detect muscle artifacts. |
| ICA + Kurtosis & Shannon's Entropy [19] | Kurtosis and Shannon's Entropy | 31.3% Error | Failed to detect muscle activity in many cases. |
| Linear Classifier (LPM) [17] | 6 optimized features (spectral, spatial, temporal) | <10% MSE (on Reaction Time data) | Performance was on par with inter-expert disagreement. |
| Linear Classifier (LPM) [17] | Same pre-calculated classifier as above | 15% MSE (on Auditory ERP data) | Demonstrated good generalization to a different paradigm. |
Table 2: Impact of Artifact Variability on ICA Cleaning Accuracy [16]
| Artifact Trial-to-Trial Variability | Impact on ICA Independence Assumption | Expected Cleaning Accuracy |
|---|---|---|
| Low (Deterministic) | Breaks the assumption of statistical independence between components. | Low; high risk of also removing non-artifactual brain data. |
| High (Stochastic) | Better fulfills the assumption of statistical independence. | High; more reliable isolation and removal of the artifact. |
Experimental Protocols
Protocol 1: Systematic Component Inspection and Labeling
This methodology outlines the manual procedure for identifying and classifying ICA components, which is considered a gold standard against which automated methods are measured [9].
1. ICA Decomposition:
- Data Preparation: Load the continuous or epoched EEG dataset. Ensure data is high-pass filtered (e.g., 1 Hz cutoff) to remove slow drifts that can impair ICA performance [20].
- Algorithm Selection: Run ICA decomposition using an algorithm such as Infomax, FastICA, or Picard. The default in many toolboxes is often Infomax, which is suitable for super-Gaussian sources [9] [20].
2. Multi-Domain Component Visualization: For each independent component, generate and inspect the following plots [9]:
- Spatial Topography: Plot the 2-D scalp map of the component's back-projection (a column of the inverse weight matrix, W⁻¹). Look for characteristic patterns (e.g., frontal dipoles for eye blinks, temporal/neck patterns for muscle noise).
- Time Course: Scroll through the component's activation (a row of the source matrix, S). Look for stereotypical temporal patterns (e.g., infrequent, large-amplitude spikes for blinks; high-frequency, burst-like activity for muscle noise).
- Power Spectrum: Plot the frequency spectrum of the component's activation. Look for distinctive spectral signatures (e.g., low-frequency dominance for eye movements; broad, high-frequency power for muscle artifacts).
- ERPimage: (For epoched data) Create an ERPimage plot to see if the component's activity is time-locked to events. This can help identify cognitive components or stimulus-related artifacts.
3. Expert Labeling: Based on the confluence of evidence from all three domains (spatial, temporal, spectral), an expert labels each component as "Brain," "Artifact" (and specifies type, e.g., "EOG," "EMG," "ECG"), or "Mixed/Uncertain."
Protocol 2: Assessing ICA Reliability Using the RELICA Method
This protocol describes a procedure to evaluate the stability of an ICA decomposition, which is crucial for understanding the confidence in component selection [9].
1. Data Resampling:
- Perform multiple ICA decompositions (e.g., 100 runs) on bootstrapped versions of the original data. Bootstrapping involves creating new datasets by randomly sampling segments from the original data with replacement.
2. Cluster Analysis:
- For each run of ICA, the components are computed. Subsequently, components from all runs are clustered based on similarity of their scalp topographies and/or time courses.
3. Reliability Measurement:
- The stability and reliability of each component from the original decomposition are measured by how consistently it is re-identified across the bootstrapped runs and how tightly its replicas cluster together. Components that do not form a tight, consistent cluster are considered unreliable and should be interpreted with caution.
Signaling Pathways & Workflows
ICA Component Inspection Workflow
Artifact Variability Impact on ICA
The Scientist's Toolkit
Table 3: Essential Software Tools and Algorithms for ICA Research
| Tool/Algorithm | Function | Key Application in ICA Research |
|---|---|---|
| EEGLAB [9] | An interactive MATLAB toolbox for processing EEG data. | Provides a complete ecosystem for running ICA (multiple algorithms), visualizing components (topography, time-course, spectrum), and manually labeling them. Plugins like RELICA assess reliability. |
| MNE-Python [20] | An open-source Python package for exploring, visualizing, and analyzing neurophysiological data. | Offers implementations of ICA (FastICA, Picard, Infomax) with tight integration for creating and applying ICA solutions to Raw and Epochs objects. Includes functions for automatically detecting EOG/ECG artifacts. |
| FastICA Algorithm [21] [20] | A computationally efficient ICA algorithm based on a fixed-point iteration scheme to maximize non-Gaussianity. | A standard algorithm for performing the decomposition. Its efficiency is beneficial for high-density EEG systems or for running multiple decompositions (e.g., in RELICA). |
| Infomax Algorithm [9] [20] | An ICA algorithm that maximizes the mutual information between the inputs and outputs of a neural network. | Another standard algorithm, particularly effective for super-Gaussian sources. The extended-Infomax version can also find sub-Gaussian sources, making it robust for various data types. |
| RELICA Plugin [9] | An EEGLAB plugin for assessing the reliability of ICA components. | Used to measure the stability and reliability of components identified by ICA through bootstrapping, helping researchers identify which components are robust and which are uncertain. |
Troubleshooting Guide: ICA Component Selection
Q: What are the key metrics for selecting biologically relevant vs. artifactual ICA components? A: The selection relies on multiple metrics assessing the component's topography, time-course statistics, and spectral properties. No single metric is sufficient; components should be evaluated through a convergent validation approach.
Metric 1: Topographic Dipolarity
- Purpose: Assesses the biological plausibility of a component. Brain-originating components should have a scalp map compatible with a single equivalent dipole.
- Interpretation: A low residual variance (RV) indicates a good fit. Components with high dipolarity are likely cortical in origin.
- Quantitative Threshold: Components with an RV of less than 10% are typically considered near-dipolar and thus likely of cerebral origin [22].
Metric 2: Time-Course Kurtosis
- Purpose: Measures the "peakedness" of the component time-course distribution. Artifacts like eye blinks or muscle activity often have highly peaked, non-Gaussian distributions.
- Interpretation: High kurtosis can indicate the presence of stereotypical artifacts. Maximizing non-Gaussianity is a core principle of ICA [23].
Metric 3: Spectral Features
- Purpose: Identifies components based on their frequency content.
- Interpretation:
- Ocular Artifacts: Dominated by low-frequency power.
- Muscle Artifacts: Exhibit high-frequency "broadband" power.
- Neural Components: Often show activity in canonical bands like alpha, beta, or theta.
Metric 4: Temporal Entropy (Mutual Information Reduction)
- Purpose: Measures the statistical independence of a component from all others. A successful ICA decomposition maximizes the independence between components.
- Interpretation: Algorithms that achieve a higher Mutual Information Reduction (MIR) are more effective at separating the data into true underlying sources. The remaining Pairwise Mutual Information (PMI) between component time courses should be low [22].
Q: My ICA decomposition fails to capture clear ocular artifacts. What could be wrong? A: This issue can stem from data quality or algorithmic settings.
- Data Preprocessing: Ensure your data is properly high-pass filtered (e.g., at 0.5-1 Hz) to remove slow drifts that can hinder ICA performance [24].
- Algorithm Choice: Different ICA algorithms (e.g., Infomax, FastICA, AMICA) can yield varying results. AMICA and other likelihood/mutual information-based methods have been shown to produce a higher number of dipolar components, which may improve separation [22].
- Number of Components: Specifying an incorrect number of components can lead to poor unmixing. If you suspect the default is too low, try increasing it, as this can sometimes better capture artifacts [24].
Q: After ICA cleaning, my TMS-evoked potentials (TEPs) seem altered. Is this expected? A: Yes, this is a known risk. Research shows that if the TMS-induced artifact has low trial-to-trial variability, ICA may incorrectly identify it as a stable, independent source. This can cause the algorithm to remove not just the artifact but also parts of the brain-generated TEP, leading to biased results [25]. Always measure the variability of the removed artifact components to estimate cleaning reliability.
Quantitative Metrics for ICA Component Evaluation
The table below summarizes the key metrics, their targets, and interpretation guidelines.
| Metric | What It Measures | Target for Brain Components | Indication of Artifact |
|---|---|---|---|
| Dipolarity [22] | Fit of component scalp topography to a single equivalent dipole. | Residual Variance < 10% | High residual variance; irregular scalp map. |
| Kurtosis [23] | "Heavy-tailedness" or peakedness of the amplitude distribution. | Varies; generally moderate. | Extreme positive or negative values. |
| Spectral Features | Power distribution across frequency bands. | Peak in a canonical band (e.g., Alpha: 8-12 Hz). | Dominant low-freq. (ocular) or high-freq. (muscle). |
| Temporal Entropy / MIR [22] | Statistical independence from other component time-courses. | High independence (low mutual information with others). | High dependency on other components (high PMI). |
Experimental Protocol: Validating an ICA Decomposition
This protocol provides a step-by-step method to evaluate the quality of an ICA decomposition for artifact removal, based on best practices from recent literature.
1. Data Preprocessing & Decomposition:
- Apply a high-pass filter (e.g., 1 Hz cutoff) to the continuous EEG data [24].
- Perform ICA decomposition using a chosen algorithm (e.g., Infomax, AMICA) on the filtered data.
- Do not perform aggressive artifact rejection prior to ICA, as this can disrupt the statistical assumptions of the algorithm [26].
2. Component Evaluation & Metric Calculation:
- For each component, calculate the four key metrics:
- Dipolarity: Compute the residual variance (RV) between the component's scalp map and the projection of the best-fitting single equivalent dipole [22].
- Kurtosis: Calculate the kurtosis of the component's time-course.
- Spectral Features: Generate the power spectral density for the component.
- Temporal Entropy: Use the decomposition's overall Mutual Information Reduction (MIR) and the pairwise mutual information (PMI) between components as quality measures [22].
3. Decision & Validation:
- Classify components as "Brain" or "Artifact" based on convergent evidence from all metrics.
- Critical Check for TEPs: If working with TMS-EEG data, calculate the trial-to-trial variability of the artifact components. Low variability suggests a higher risk that brain activity was also removed [25].
- Subtract the selected artifact components from the data and visually inspect the cleaned EEG to confirm artifact removal and preservation of neural signals.
Logical Workflow for ICA Component Selection
The following diagram illustrates the decision-making process for classifying ICA components.
The table below lists essential computational tools and metrics used in ICA-based EEG analysis.
| Tool / Resource | Function / Description |
|---|---|
| Mutual Information Reduction (MIR) | A core metric to evaluate the overall success of an ICA decomposition in producing statistically independent components [22]. |
| Residual Variance (RV) | The key quantitative measure for dipolarity, indicating how well a component's scalp map fits a single equivalent dipole source [22]. |
| AMICA Algorithm | An ICA algorithm shown in comparisons to achieve high mutual information reduction and yield a high number of dipolar components [22]. |
| Trial-to-Trial Variability Measure | A crucial check for TMS-EEG studies to assess the reliability of ICA cleaning and avoid unintended removal of brain signals [25]. |
From Manual to Automated: Modern ICA Component Classification Techniques
Troubleshooting Guides & FAQs
Installation and Setup
Q1: How do I install the ICLabel classifier in EEGLAB?
The ICLabel plugin can be installed directly through the EEGLAB plugin manager, which is the easiest method. Alternatively, you can install it manually from its GitHub repository. If choosing manual installation, note that the project includes matconvnet as a submodule. When cloning the repository, use the command git clone --recursive https://github.com/lucapton/ICLabel.git to ensure all dependencies are included. If downloading as a ZIP file, you must separately download the required version of matconvnet and place it in the ICLabel folder [27].
Q2: I have installed ICLabel, but nothing happens when I run it. Is this a bug?
This is likely not a bug. The ICLabel plugin itself does not include built-in plotting functions. After it finishes processing, it will display "Done" in the MATLAB command window. To visualize the components and their classifications, it is highly recommended to install the complementary Viewprops plug-in. If Viewprops is installed, it will automatically open and display the components after ICLabel finishes its classification [27].
Interpretation of Results
Q3: How do I access and interpret the output probabilities from ICLabel?
ICLabel stores its results in the EEG structure under EEG.etc.ic_classification.ICLabel.classifications. This is a matrix where each row corresponds to an Independent Component (IC) and each column represents the probability of that component belonging to a specific category. The order of the categories is defined in EEG.etc.ic_classification.ICLabel.classes. For example, to get the label vector for the fifth IC, you would use EEG.etc.ic_classification.ICLabel.classifications(5, :). The seven output categories are: Brain, Muscle, Eye, Heart, Line Noise, Channel Noise, and Other [27] [28].
Q4: What probability threshold should I use to automatically reject components?
While the optimal threshold can depend on your specific research goals, ICLabel is designed to provide probabilistic outputs to guide your decision. A common approach for artifact removal research is to use the pop_icflag function to automatically flag components based on predefined probability thresholds. For instance, you could set a rule to flag any component with a probability of being in "Muscle," "Line Noise," or "Channel Noise" categories greater than a certain value (e.g., 0.8) for rejection. You can then review the flagged components before finalizing the rejection to ensure validity [27].
Performance and Integration in Mobile EEG Research
Q5: Does ICLabel perform well with mobile EEG data containing strong motion artifacts?
It is important to know that the standard ICLabel classifier was not explicitly trained on mobile EEG data. The presence of large motion artifacts can contaminate the ICA decomposition itself, potentially reducing ICLabel's classification accuracy [13]. For Mobile Brain/Body Imaging (MoBI) studies, it is often necessary to employ advanced preprocessing techniques before ICA to mitigate motion artifacts. Research indicates that using tools like iCanClean (which leverages canonical correlation analysis with noise references) or Artifact Subspace Reconstruction (ASR) can lead to a higher-quality ICA decomposition with more dipolar brain components, which in turn should improve ICLabel's performance on such data [13].
The quality of the ICA decomposition is paramount for accurate component labeling. A recent study systematically evaluated the impact of data cleaning on the AMICA algorithm, one of the most powerful ICA algorithms. The findings suggest that:
- Increased participant movement can negatively impact decomposition quality within a study.
- Automatic sample rejection, a feature built into the AMICA algorithm, can significantly improve the decomposition.
- The study recommends using a moderate cleaning strength, such as 5 to 10 iterations of the AMICA sample rejection function, for most datasets to improve decomposition, regardless of motion intensity [4]. Ensuring a high-quality decomposition is a critical step before applying ICLabel.
Experimental Protocols for Decomposition Quality
Evaluating the Impact of Preprocessing on ICA Decomposition
Objective: To systematically assess how different preprocessing pipelines affect ICA decomposition quality and subsequent ICLabel classification accuracy, particularly in datasets with high artifact load.
Methodology:
- Data Selection: Use open-access EEG datasets that encompass a range of motion intensities, from stationary to full-body movement (MoBI). Ensure datasets have high channel counts (e.g., >58 channels) and known electrode locations [4].
- Preprocessing Variations: Apply different preprocessing techniques to the same raw datasets:
- Pipeline A: Minimal high-pass filtering (e.g., 1-2 Hz).
- Pipeline B: Moderate automatic sample rejection (e.g., 5-10 iterations of AMICA's built-in rejection) [4].
- Pipeline C: Advanced artifact removal using iCanClean or Artifact Subspace Reconstruction (ASR) with an appropriate threshold (e.g., k=20-30 for ASR) [13].
- ICA Decomposition: Perform ICA decomposition using a consistent algorithm (e.g., AMICA) on all preprocessed versions of the data.
- Quality Metrics: Evaluate decomposition quality using:
- ICLabel Analysis: Run ICLabel on each decomposition and compare the proportion of components classified as Brain, Muscle, and Noise across the different pipelines.
Workflow for Optimized ICA Component Selection
The following diagram illustrates a recommended workflow for leveraging ICLabel within an optimized ICA component selection pipeline, integrating the troubleshooting advice and experimental protocols outlined above.
Key Research Reagent Solutions
The following table details essential software tools and their functions for research involving ICLabel and optimized ICA decomposition.
| Research Reagent | Function in Experiment | Key Parameter Considerations |
|---|---|---|
| ICLabel Classifier [27] [28] | Automated classification of ICA components into physiological and non-physiological source categories. | Provides probability outputs (Brain, Muscle, Eye, etc.). Use pop_icflag to set automated rejection thresholds. |
| AMICA Algorithm [4] | High-performance ICA decomposition, includes built-in sample rejection to improve decomposition quality. | Enable sample rejection with 5-10 iterations for moderate cleaning. Robust to artifacts but sensitive to data length/quality. |
| iCanClean [13] | Motion artifact removal using Canonical Correlation Analysis (CCA) with noise references; ideal for MoBI. | Can use dual-layer electrode noise or create pseudo-references from EEG. An R² threshold of ~0.65 is recommended for walking data. |
| Artifact Subspace Reconstruction (ASR) [13] | Statistical method to identify and remove high-variance, high-amplitude artifacts from continuous EEG. | Performance is highly sensitive to the threshold parameter k. A k of 20-30 is often recommended to avoid over-cleaning. |
| Viewprops Plugin [27] | Visualization of IC properties (topography, spectrum, etc.) for manual verification of ICLabel output. | Essential for troubleshooting and validating automated classifications. Displays multiple IC properties in a single figure. |
Troubleshooting Guides and FAQs
Frequently Asked Questions
Q1: My ICA cleaning appears to be removing brain signals along with artifacts. What could be causing this?
A: This is a known issue, particularly when artifact waveforms have low trial-to-trial variability [25]. When artifacts repeat with very similar morphology across trials, it can create dependencies between underlying components, causing ICA to perform unreliably. To diagnose this, measure the variability of your artifact components post-ICA; low variability often predicts this type of cleaning error [25].
Q2: For mobile EEG experiments with significant motion, how much data cleaning should I do before running ICA?
A: A 2024 study suggests that while data cleaning improves ICA decomposition, its effect is smaller than expected [4]. The AMICA algorithm is robust even with limited data cleaning. For most datasets, moderate cleaning (5-10 iterations of AMICA's sample rejection function) is sufficient, regardless of motion intensity [4].
Q3: Can ICA effectively remove all types of EEG artifacts?
A: ICA has proven effective for various artifacts including eye blinks, eye movements, ECG, muscle activity, and line noise [29] [8]. However, its performance depends on factors like statistical independence of sources and artifact variability [25]. It is particularly advantageous as it requires no reference signal and avoids removing brain activity, unlike regression techniques [8].
Q4: How can I objectively measure the success of my ICA-based artifact removal?
A: Multiple quantitative measures exist: (1) Calculate the normalized correlation coefficient between pre- and post-cleaning signals to ensure minimal distortion of interictal activity [29]; (2) Evaluate mutual information between components; (3) Analyze residual variance of brain components; and (4) Calculate signal-to-noise ratios in cleaned versus uncleaned data [4].
Q5: What are the limitations of using ICA for TMS-evoked potentials?
A: For TMS-evoked potentials, ICA becomes unreliable when TMS-induced artifacts repeat similarly after each pulse [25]. This low trial-to-trial variability can cause ICA to incorrectly eliminate brain-derived EEG data along with artifacts, particularly affecting the early (0-30 ms) TEP components [25].
Common Experimental Issues and Solutions
Problem: Poor ICA decomposition quality in mobile EEG experiments
- Solution: Implement moderate automatic sample rejection (5-10 iterations in AMICA) before decomposition. Increased movement significantly decreases decomposition quality, but moderate cleaning improves it without requiring excessive data removal [4].
Problem: Uncertainty in identifying artifactual components after ICA
- Solution: Combine multiple evaluation metrics rather than relying on a single measure. Examine component mutual information, topographies, power spectra, and time-course characteristics to distinguish brain from non-brain components more reliably [4].
Problem: ICA fails to separate artifacts from brain signals in TEP data
- Solution: Measure artifact component variability post-ICA. If variability is low, consider alternative cleaning methods or use the variability measure to estimate cleaning reliability even without ground-truth data [25].
Table 1: ICA Performance Across Different Artifact Types
| Artifact Type | Removal Efficacy | Key Considerations | Quantitative Measures |
|---|---|---|---|
| Eye Movements/ Blinks | High [8] | Can increase cognitive load if subjects are instructed to suppress blinks [8] | Normalized correlation coefficient shows minimal signal change [29] |
| Muscle Activity (EMG) | Effective [29] [4] | More prevalent in mobile EEG; excessive cleaning may remove important data [4] | Proportion of muscle components in decomposition [4] |
| Cardiac (ECG) | Effective [29] | Can be identified and removed without reference signal [8] | Component topography and time-course analysis [29] |
| Line Noise | Effective [29] | Electrical artifacts from equipment or power lines [4] | Spectral analysis of components [4] |
| TMS-Induced | Variable Reliability [25] | Becomes unreliable with low trial-to-trial artifact variability [25] | Artifact variability measurement predicts cleaning accuracy [25] |
| Electrode Movement | Challenging [4] | Large transient spikes easier to detect than cable sway [4] | Sample rejection based on log-likelihood in AMICA [4] |
Table 2: Impact of Data Cleaning on ICA Decomposition Quality
| Experimental Condition | Decomposition Quality | Recommended Cleaning | Effect of Cleaning Strength |
|---|---|---|---|
| Stationary EEG | High [4] | Minimal cleaning required | Smaller effect on quality [4] |
| Mobile EEG (Low Motion) | Moderate to High [4] | 5 iterations of sample rejection | Significant improvement [4] |
| Mobile EEG (High Motion) | Lower [4] | 5-10 iterations of sample rejection | Significant improvement [4] |
| TMS-EEG (Variable Artifacts) | Dependent on artifact variability [25] | Measure component variability first | Can decrease reliability if variability is low [25] |
Detailed Experimental Protocols
Protocol 1: ICA-Based Artifact Removal for Standard EEG
This protocol implements ICA for removing common artifacts (eye movements, ECG, muscle) from standard EEG recordings [29] [8].
Data Preparation: Use short EEG samples with evident artifacts and spikes. Ensure data meets ICA assumptions: linear mixing of statistically independent, non-Gaussian sources [29] [8].
ICA Calculation: Apply Joint Approximate Diagonalization of Eigen-matrices (JADE) algorithm to calculate independent components [29].
Component Identification: Analyze components to identify those related to artifacts based on topography, time-course, and spectral characteristics [8].
Signal Reconstruction: Reconstruct signal excluding artifact-related components. Zero out problematic components while applying mixing matrix [8].
Validation: Calculate normalized correlation coefficient between original and cleaned signals to measure changes. Have multiple examiners independently identify changes in morphology and location of discharges and artifacts [29].
Protocol 2: Evaluating ICA Cleaning Accuracy for TMS-Evoked Potentials
This protocol measures accuracy of ICA-based cleaning specifically for TMS-evoked potentials where artifacts may mask early (0-30 ms) TEPs [25].
Simulated Artifacts: Impose simulated artifacts with varying variability on measured artifact-free TEPs. Systematically vary artifact waveform variability from deterministic to stochastic [25].
ICA Processing: Apply ICA decomposition to simulated data using standard parameters.
Accuracy Measurement: Measure cleaning accuracy for each level of artifact variability by comparing to ground-truth artifact-free data.
Variability Quantification: Calculate variability of artifact components using ICA-derived components. Establish relationship between measured variability and cleaning accuracy [25].
Reliability Prediction: Use measured variability to predict cleaning reliability even without ground-truth data [25].
Protocol 3: Optimizing ICA for Mobile EEG with Automatic Cleaning
This protocol implements automatic sample rejection before ICA decomposition for mobile EEG data with significant motion artifacts [4].
Dataset Selection: Use high-density EEG datasets (≥58 channels) with varying movement levels from stationary to mobile Brain/Body Imaging (MoBI) setups [4].
Parameter Variation: Apply AMICA algorithm with varying sample rejection criteria (number of iterations, SD thresholds). Use integrated AMICA sample rejection based on log-likelihood [4].
Quality Assessment: Evaluate decomposition quality using multiple measures: mutual information between components, proportion of brain/muscle/other components, residual variance of brain components, and signal-to-noise ratio [4].
Optimization: Determine optimal cleaning parameters that maximize decomposition quality while preserving data. Moderate cleaning (5-10 iterations) typically provides best results [4].
The Scientist's Toolkit: Research Reagent Solutions
Table 3: Essential Materials for ICA Artifact Removal Research
| Tool/Resource | Function/Purpose | Application Context |
|---|---|---|
| AMICA Algorithm | Adaptive Mixture ICA; currently one of the most powerful decomposition algorithms [4] | Mobile and stationary EEG artifact removal |
| JADE Algorithm | Joint Approximate Diagonalization of Eigen-matrices; calculates independent components [29] | Standard EEG artifact removal |
| Artifact Subspace Reconstruction (ASR) | Identifies artifactual time periods based on artifact subspaces [4] | Initial data cleaning before ICA |
| Sample Rejection (AMICA) | Model-driven rejection of bad samples based on log-likelihood during decomposition [4] | Automatic data cleaning integrated with ICA |
| Variability Measurement Tool | Quantifies trial-to-trial variability of artifact components [25] | Predicting ICA cleaning accuracy for TMS-EEG |
| Normalized Correlation Coefficient | Measures changes caused by artifact component suppression [29] | Validating preservation of neural signals |
Experimental Workflows and System Architecture
ICA-Based Artifact Removal Workflow
Automatic Artifact Detection System Logic
Mobile EEG Preprocessing Pipeline
Frequently Asked Questions (FAQs)
Q1: What is the core advantage of integrating covariates into ICA compared to conventional ICA? Integrating covariates like behavioral scores directly into the ICA decomposition process can uncover stronger and more robust brain-behavior relationships. Unlike conventional ICA, which performs decomposition and correlation analysis sequentially, the augmented approach allows the behavioral data to directly influence how the brain connectivity patterns are separated into independent components, often leading to more significant and stable correlations in independent test datasets [30] [31].
Q2: My dataset has a limited sample size. Can I still use this method? Small sample sizes pose a challenge, particularly for methods that require data splitting. However, newer algorithms like TSS-ICA (Two-Stage Sampling ICA) are being developed specifically to handle small-scale and unstructured datasets more effectively [3]. These methods use a flexible blocking and similarity testing strategy to determine the optimal number of reliable components from limited data.
Q3: What types of covariates can be integrated into the ICA framework? The method is versatile and can incorporate various continuous or categorical measures. The featured research used cognitive performance metrics from standardized tests like the Woodcock-Johnson (WJ) Tests of Cognitive Abilities [30] [31]. In principle, clinical scores, symptom severity ratings, or other behavioral or physiological measures can also be included as covariates.
Q4: How does integrating covariates affect the artifact removal process in EEG analysis? While the primary literature focuses on using covariate-enhanced ICA to find brain-behavior relationships, the underlying principle could refine artifact removal. By making the decomposition informed by a relevant behavioral covariate, the resulting components might more cleanly separate brain signals from non-brain artifacts, though this specific application is an area for further research.
Q5: What are the consequences of selecting too many or too few ICA components? Selecting an incorrect number of components directly impacts result quality:
- Under-decomposition (too few components): Results in components that are poorly separated mixtures of multiple underlying sources, obscuring the true regulatory or artifactual structure and leading to inaccurate interpretations [32].
- Over-decomposition (too many components): Leads to splitting of true sources into multiple components and the creation of biologically meaningless components, often dominated by a single gene or signal feature, which introduces noise [32].
Troubleshooting Guides
Problem 1: Weak or Non-Significant Correlation Between ICA Components and Behavioral Measures
Potential Causes and Solutions:
Cause: Inadequate decomposition quality.
- Solution: Ensure the input data for ICA is clean. For EEG data, apply a high-pass filter (e.g., 1 Hz cutoff) before ICA to remove slow drifts that can reduce the independence of sources [20]. Consider using automatic sample rejection algorithms, like the one built into the AMICA algorithm, to iteratively remove bad samples that negatively impact the model fit [4].
Cause: Using a conventional ICA approach.
- Solution: Shift from the conventional two-step method (ICA then correlation) to an augmented ICA approach where behavioral data is integrated directly into the decomposition matrix. This allows the covariate to guide the separation of brain connectivity patterns [30].
Cause: The number of ICA components is not optimal.
- Solution: Employ a dimensionality selection method like OptICA, which aims to find the highest dimension that produces a low number of over-decomposed (e.g., single-gene dominated) components, thus avoiding both under- and over-decomposition [32].
Problem 2: Determining the Optimal Number of Components for Decomposition
Recommended Procedure (TSS-ICA Method):
This method is designed to find reliable components, even with small sample sizes [3].
- Create Sub-Blocks: Use a two-stage sampling method on your observed data to create two representative sub-blocks.
- Run ICA Separately: Perform ICA on each of the two sub-blocks.
- Similarity Measurement: Identify corresponding Independent Components (ICs) between the two sub-blocks using a novel similarity measurement.
- Hypothesis Testing: Determine which components are "remarkably similar" using a statistical testing approach with corrections for multiple comparisons (e.g., Bonferroni correction).
- Determine Optimal Number: The optimal number of ICs is the number of pure components that are consistently and significantly similar across the sub-blocks.
Problem 3: Handling Missing Data in Multimodal Fusion with ICA
The Problem: Missing data in one or more modalities (e.g., some subjects lack MRI or PET scans) drastically reduces sample size if only complete cases are used, leading to biased results and information loss [33].
Recommended Solution: Full Information Linked ICA (FI-LICA)
FI-LICA handles missing data under the Linked ICA framework without discarding subjects [33].
- Principle: Built upon complete cases, it uses all available data to recover the missing latent information.
- Advantage: More accurate and reliable than complete case analysis or simple zero-filling, leading to better performance in downstream tasks like classification and prediction.
- Implementation: The algorithm employs a full information approach to estimate the shared subject loadings across all modalities, even for subjects with missing data.
Experimental Protocols & Data Presentation
Protocol 1: Augmented ICA with Integrated Covariates
This protocol details the method for integrating behavioral data directly into the ICA decomposition of EEG connectivity data [30] [31].
1. Data Collection and Preprocessing
- Participants: 175 patients with a range of neuropsychiatric conditions.
- EEG Data: Collect 5-minute resting-state EEG with a 19-channel system (10-20 placement). Preprocess data using software like NeuroGuide: apply automated artifact rejection, band-pass filter (1-30 Hz), and re-reference to linked ears.
- Behavioral Covariate: Administer the Woodcock-Johnson (WJ) Tests of Cognitive Abilities to obtain the General Intellectual Ability (GIA) score.
- Connectivity Analysis: Compute functional connectivity measures (e.g., lagged coherence in the upper alpha band) between brain regions using source localization like swLORETA.
2. ICA Decomposition Methods
- Method 1 (Conventional ICA): Perform ICA (e.g., using Infomax algorithm) solely on the EEG connectivity data. Then, correlate the resulting independent components with the WJ GIA scores.
- Method 2 (Augmented ICA): Create an augmented data matrix that combines both the EEG connectivity data and the behavioral covariate (WJ scores). Perform ICA on this augmented matrix to allow the behavioral data to directly influence the decomposition.
3. Analysis and Validation
- Compare the strength and statistical significance of the correlations between EEG connectivity components and cognitive performance found by the two methods.
- Validate the robustness of the correlations using an independent test dataset.
Comparative Analysis: Conventional vs. Augmented ICA
The table below summarizes the key differences and outcomes between the two methodological approaches based on the cited study [30] [31].
| Feature | Conventional ICA | Augmented ICA with Covariates |
|---|---|---|
| Data Input | EEG connectivity data only | Augmented matrix of EEG connectivity + behavioral scores |
| Analytical Sequence | 1. Decompose EEG data2. Correlate components with behavior | Simultaneous decomposition of EEG and behavioral data |
| Influence of Covariate | Indirect (post-hoc correlation) | Direct (guides the decomposition) |
| Reported Outcome | Standard correlations | Stronger, more significant, and robust correlations |
| Key Advantage | Simplicity and established methodology | Enhanced ability to uncover brain-behavior relationships |
Workflow Visualization
The Scientist's Toolkit: Research Reagent Solutions
| Item / Reagent | Function / Application in ICA Research |
|---|---|
| EEG System (19-channel) | Records raw brain electrical activity from the scalp according to the 10-20 system, providing the primary input signal for decomposition [30] [31]. |
| Woodcock-Johnson (WJ) Tests | A standardized battery of cognitive assessments used to obtain behavioral covariates (e.g., General Intellectual Ability score) for integration with EEG data [30] [31]. |
| NeuroGuide Software | Quantitative EEG (qEEG) analysis software used for automated artifact rejection, filtering, and computation of functional connectivity metrics like lagged coherence [30]. |
| Infomax ICA Algorithm | A specific ICA algorithm used to decompose mixed signals into statistically independent components by maximizing the information transfer between mixed signals and components [30]. |
| AMICA Algorithm | (Adaptive Mixture ICA) A powerful ICA algorithm that includes an iterative, model-driven sample rejection function to improve decomposition quality by removing artifactual samples during computation [4]. |
| swLORETA | (Standardized weighted Low-Resolution Electromagnetic Tomography) Used for source localization and calculating functional connectivity metrics between brain regions from EEG signals [30]. |
Technical Support Center
Troubleshooting Guides
Guide 1: Addressing Poor ICA Decomposition Quality in High-Motion Data
Problem: Independent components appear non-dipolar or fail to separate neural activity from motion artifacts during running/jogging paradigms.
Symptoms:
- Low dipolarity scores in ICA components
- High power remains at gait frequency and harmonics after processing
- Failure to recover expected ERP components (e.g., missing P300 effects)
Solutions:
Step 1: Implement Advanced Preprocessing Use either iCanClean or Artifact Subspace Reconstruction (ASR) before ICA decomposition:
- iCanClean with pseudo-reference signals: Apply with R² threshold of 0.65 and 4-second sliding windows when dual-layer noise sensors are unavailable [13].
- Artifact Subspace Reconstruction: Use k-threshold values between 10-30 to avoid over-cleaning; k=20-30 recommended for balancing artifact removal and signal preservation [13].
Step 2: Validate Component Quality
- Calculate dipolarity metrics for brain independent components
- Check power reduction at gait frequency (1.5-3 Hz) and harmonics
- Verify recovery of expected ERP latencies in stimulus-locked tasks [13]
Step 3: Optimize Dimensionality Selection Use CW_ICA method to determine optimal component number:
- Divide mixed signals into two blocks
- Apply ICA separately to each block
- Calculate rank-based correlation matrix between blocks
- Select component count that maximizes meaningful separation [2]
Table 1: Performance Comparison of Motion Artifact Removal Approaches
| Method | ICA Dipolarity | Gait Frequency Power Reduction | ERP Component Recovery | Key Parameters |
|---|---|---|---|---|
| iCanClean (pseudo-reference) | High | Significant | P300 congruency effects recovered | R²=0.65, 4s window |
| ASR | Moderate-High | Significant | Similar latency to standing task | k=20-30 |
| Traditional ICA Only | Low | Minimal | Poor or inconsistent | - |
Guide 2: Automated Artifact Classification Failure
Problem: Automated classifiers misclassify neural components as artifactual or fail to identify motion-contaminated components.
Symptoms:
- Loss of neurologically relevant signals
- Residual artifacts in cleaned data
- Poor generalization across different motion paradigms
Solutions:
Step 1: Feature Selection Optimization Implement optimized feature subset including:
- Frequency domain features: Spectral characteristics in δ (1-3Hz), θ (4-7Hz), and α (8-13Hz) bands
- Spatial domain features: Component scalp topography patterns
- Temporal domain features: Time-course characteristics and correlations [34]
Step 2: Channel Attention Mechanism For OPM-MEG or high-density EEG:
- Employ randomized dependence coefficient (RDC) to evaluate component-reference correlation
- Integrate global average pooling (GAP) and global max pooling (GMP) layers
- Use correlation thresholds to construct training datasets [35]
Step 3: Cross-Paradigm Validation
- Test classifier on data from different experimental paradigms
- Verify preservation of discriminant information for target applications
- Ensure <10% mean squared error compared to expert ratings [34]
Frequently Asked Questions
Q1: How do I determine the optimal number of independent components for my high-motion EEG dataset?
A: The CW_ICA method provides robust dimensionality determination:
- Split your mixed signals into two blocks
- Apply ICA separately to each block
- Compute Spearman correlations between components from different blocks
- Use the column-wise maximum rank-based correlations to determine optimal component count
- This method avoids both under-decomposition (too few components) and over-decomposition (too many components) that can obscure meaningful neural signals [2]
Q2: What are the practical differences between using iCanClean with pseudo-reference signals versus actual dual-layer sensors?
A: The key differences are:
- Dual-layer sensors: Physically separate noise references provide cleaner artifact separation; ideal for new experimental setups
- Pseudo-references: Created by applying notch filters to raw EEG to identify noise subspaces; practical for existing datasets where physical noise sensors weren't recorded
- Effectiveness: Both approaches significantly improve ICA dipolarity and reduce motion artifacts, though dual-layer sensors may provide marginal advantages in extreme motion conditions [13]
Q3: Will aggressive artifact removal damage neural signals of interest?
A: Over-cleaning is a valid concern. Evidence suggests:
- Using ASR with k-values below 10 may remove neural signals along with artifacts
- iCanClean with R² thresholds around 0.65 preserves neural signals while removing motion artifacts
- Always validate against known neural markers (e.g., P300 in flanker tasks) to ensure neural preservation [13]
- The combination of artifact correction and rejection doesn't significantly improve decoding performance in most cases, but correction remains essential to minimize artifact-related confounds [36]
Q4: How can I validate that my automated classification is working properly?
A: Implement a multi-metric validation approach:
- Quantitative metrics: Component dipolarity, power reduction at gait frequencies
- Functional metrics: Recovery of expected ERP components (latency and amplitude effects)
- Decoding metrics: Preservation of task-relevant neural information for MVPA
- Comparative metrics: Performance relative to expert manual classification (target <10% MSE) [13] [34]
The Scientist's Toolkit
Table 2: Essential Research Reagents and Computational Tools
| Tool/Resource | Function/Purpose | Implementation Notes |
|---|---|---|
| iCanClean Algorithm | Motion artifact removal using reference noise signals | Use pseudo-reference signals when dual-layer sensors unavailable; R²=0.65 optimal |
| Artifact Subspace Reconstruction (ASR) | identifies and removes high-variance artifact components | k=20-30 optimal; avoid k<10 to prevent over-cleaning |
| CW_ICA Method | Determines optimal ICA dimensionality | Prevents under/over-decomposition using rank-based correlations |
| Automated Component Classifier | Identifies artifactual components using spatial, spectral, and temporal features | Linear classifiers with optimized feature subsets achieve <10% MSE vs. experts |
| ICLabel | ICA component classification | Not trained on mobile EEG; limited for high-motion paradigms |
| Stationary Wavelet Transform + Savitzky-Golay | Motion artifact mitigation in physiological signals | Preserves critical morphological features (e.g., QRS complex in ECG) |
Experimental Protocol: Validating Artifact Removal in High-Motion Paradigms
Purpose: To evaluate the effectiveness of automated artifact classification and removal methods during high-motion conditions.
Materials:
- Mobile EEG system with minimum 32 channels
- Flanker task or similar cognitive paradigm
- Treadmill or open space for locomotor tasks
Procedure:
Data Acquisition:
- Record EEG during both static standing and dynamic (jogging/running) conditions
- Implement identical cognitive tasks in both conditions
- Include sufficient trials for ERP analysis (minimum 800 trials recommended)
Preprocessing Pipeline:
- Apply either iCanClean (R²=0.65, 4s window) or ASR (k=20)
- Band-pass filter 1.5-40 Hz
- Segment data into epochs time-locked to stimuli
ICA Decomposition:
- Determine optimal component count using CW_ICA
- Perform ICA using FastICA, Infomax, or JADE algorithms
Automated Component Classification:
- Extract spatial, spectral, and temporal features
- Apply pre-trained linear classifier with optimized feature subset
- Remove components classified as artifactual
Validation Metrics:
- Calculate dipolarity of remaining components
- Compare power spectral density at gait frequency pre-/post-cleaning
- Extract ERP components and compare latency/amplitude to static condition
- Verify expected cognitive effects (e.g., P300 congruency effects)
Expected Outcomes:
- Significant reduction in power at gait frequency and harmonics
- Recovery of ERP components with similar latency to static condition
- Preservation of expected cognitive modulation (e.g., larger P300 for incongruent stimuli)
- High dipolarity scores in retained components [13]
Workflow Visualization
Workflow Description: This diagram illustrates the comprehensive pipeline for processing high-motion EEG data, from acquisition through validation. The color-coded sections represent major processing stages: data acquisition (white), preprocessing (green), ICA and component classification (blue), and validation (red). The dashed lines indicate optional feedback loops for parameter optimization based on validation metrics.
Advanced Technical Notes
For researchers implementing these methods in novel paradigms:
Cross-Paradigm Generalization: When applying classifiers trained on one paradigm to another:
- Test on data from different experimental designs (e.g., auditory ERP, motor imagery BCI)
- Verify performance maintains <15% mean squared error compared to expert ratings
- Ensure preservation of task-relevant discriminant information [34]
Computational Efficiency: CW_ICA provides significant computational advantages over bootstrap resampling or cross-validation methods while maintaining robustness for signals with different characteristics [2].
Real-Time Applications: For BCI or neurofeedback applications requiring real-time processing:
- iCanClean and ASR can be implemented in online pipelines
- Automated classification enables immediate artifact removal
- Maintains signal quality without the latency of manual component inspection [13] [34]
Solving Real-World Problems: An Optimization Guide for Challenging Data
Addressing the Specific Challenge of Motion Artifacts in Mobile EEG
Frequently Asked Questions
What are the main types of motion artifacts in mobile EEG? Motion artifacts originate from two primary sources: electrode movement and cable movement. Electrode movement artifacts occur when changes in pressure on the gel layer modify the electrode-tissue interface, altering the electrode's offset. Cable movement artifacts result from changing capacitive coupling as cables move within an electrical field. These artifacts are particularly challenging because their frequency band often overlaps with useful EEG signals, they may be uncorrelated in electrode space, and both EEG and artifacts are non-stationary [37] [38].
Why are motion artifacts particularly problematic for ICA decomposition? Motion artifacts reduce ICA decomposition quality by contaminating the ability to identify maximally independent sources. The continued presence of large motion artifacts can prevent ICA from effectively separating brain signals from artifactual sources. Furthermore, standard component classification tools like ICLabel have not been trained on mobile EEG data and do not adapt to the present dataset, making them less reliable for identifying motion-related artifacts [13] [39].
Which preprocessing methods are most effective for motion artifact removal before ICA? Research comparing artifact removal approaches during running found that iCanClean (using pseudo-reference noise signals) and Artifact Subspace Reconstruction (ASR) were particularly effective. Both methods led to the recovery of more dipolar brain independent components, significantly reduced power at the gait frequency and its harmonics, and produced ERP components similar in latency to those identified in stationary tasks. iCanClean was somewhat more effective than ASR in certain analyses, particularly for capturing expected P300 ERP congruency effects [13] [39].
Troubleshooting Guides
Problem: Poor ICA Decomposition Quality During Movement
Symptoms: Reduced component dipolarity, high residual variance, difficulty classifying brain vs. non-brain components, spectral power peaks at gait frequency and harmonics.
Solution: Implement targeted preprocessing before ICA decomposition.
Step-by-Step Protocol:
- Assess Data Quality: Calculate power spectral density to identify peaks at step frequency and harmonics [13] [39].
- Select Preprocessing Method:
- Apply Cleaning: Process data through selected algorithm before ICA
- Validate: Check reduction in power at gait frequency and improvement in component dipolarity
Expected Outcomes:
- Significant reduction in power at gait frequency and harmonics [13] [39]
- Increased number of dipolar brain components identified [13]
- Improved signal-to-noise ratio for event-related potentials [13]
Problem: Motion Artifacts in Real-Time Applications
Symptoms: Signal saturation, high-amplitude transients time-locked to movement, corrupted data in mobile paradigms.
Solution: Implement real-time artifact subspace reconstruction.
Step-by-Step Protocol:
- Calibration Phase: Collect 30 seconds to 2 minutes of clean data during stationary period [38]
- Preprocess Calibration Data: Subtract mean, apply IIR filter to remove alpha before PCA [38]
- Compute Reference Matrix: Calculate PCA mixing matrix of filtered data and RMS of principal components [38]
- Set Threshold: Determine rejection threshold Γ using k parameter (typically 5-7 for real-time applications) [38]
- Processing Phase: Apply ASR to incoming data using calibration reference
Implementation Details:
- Use 64-sample chunks for real-time processing [38]
- For each window, check if principal components exceed rejection threshold
- Replace artifactual components with zeros and reconstruct using calibration data [38]
Performance Comparison of Motion Artifact Removal Techniques
Table 1: Quantitative Performance Metrics of Different Approaches
| Method | Component Dipolarity | Power Reduction at Gait Frequency | ERP Compatibility | Computational Demand |
|---|---|---|---|---|
| iCanClean with pseudo-reference | Highest | Significant | Preserves P300 effects | Medium-High |
| ASR (k=20) | High | Significant | Preserves latency | Medium |
| AMICA with sample rejection | Moderate-High | Moderate | Limited data | Low-Medium |
| Motion-Net Deep Learning | Not reported | 86% artifact reduction | Not reported | High (training required) |
Table 2: Recommended Parameters for Different Movement Conditions
| Movement Type | Recommended Method | Key Parameters | Expected Outcome |
|---|---|---|---|
| Running/Jogging | iCanClean | R²=0.65, 4s window | Power reduction at gait harmonics, preserved ERPs |
| Walking | ASR | k=10-20 | Improved dipolarity, reduced high-amplitude artifacts |
| Standing with subtle movements | AMICA with sample rejection | 5-10 iterations, 3SD threshold | Robust decomposition with minimal data loss |
| Real-time applications | ASR | k=5-7, 64-sample windows | Real-time cleaning with 30s calibration |
Experimental Protocols for Method Validation
Protocol 1: Validating Artifact Removal During Locomotion
Purpose: Evaluate effectiveness of motion artifact removal methods during running using a modified Flanker task [13] [39].
Materials:
- Mobile EEG system with sufficient channels for ICA (≥32 recommended)
- Motion artifact removal software (iCanClean, ASR implementation)
- Synchronized trigger system for Flanker task presentation
Procedure:
- Participant Preparation: Apply EEG cap following standard protocols, ensuring secure electrode connection
- Baseline Recording: Record 5 minutes of stationary data with Flanker task
- Experimental Recording: Record data during dynamic jogging version of Flanker task
- Data Processing: Apply artifact removal methods (iCanClean with pseudo-reference or ASR)
- ICA Decomposition: Run AMICA or other ICA algorithm on cleaned data
- Component Classification: Classify components using ICLabel or manual inspection
Validation Metrics:
- Proportion of dipolar brain components [13]
- Power spectral density changes at step frequency and harmonics [13] [39]
- Presence and characteristics of P300 ERP in Flanker task [13]
- Residual variance of brain components [4]
Protocol 2: Optimizing AMICA Decomposition with Sample Rejection
Purpose: Systematically evaluate the impact of automatic sample rejection on ICA decomposition quality across different movement intensities [4].
Materials:
- EEG datasets with varying movement intensity
- AMICA algorithm with sample rejection capability
- Quality assessment metrics (mutual information, residual variance, component classification)
Procedure:
- Data Selection: Collect or obtain EEG datasets with varying movement levels
- AMICA Decomposition: Run AMICA with varying sample rejection parameters:
- Number of cleaning iterations (0-10)
- Standard deviation threshold (3-5 SD)
- Quality Assessment: Evaluate decomposition quality using:
- Mutual information of components
- Proportion of brain, muscle, and 'other' components
- Residual variance of brain components
- Signal-to-noise ratio in exemplary components
Expected Results:
- Increased movement decreases decomposition quality within individual studies [4]
- Cleaning strength significantly improves decomposition, but effect is smaller than expected [4]
- Moderate cleaning (5-10 iterations of AMICA sample rejection) improves most datasets regardless of motion intensity [4]
Method Selection Workflow
Research Reagent Solutions
Table 3: Essential Tools for Motion Artifact Research
| Tool/Resource | Function | Implementation Notes |
|---|---|---|
| iCanClean Algorithm | Motion artifact removal using reference noise signals | Use with dual-layer electrodes when possible; pseudo-references created via notch filtering when not available [13] |
| Artifact Subspace Reconstruction (ASR) | Identifies and removes artifact subspaces using PCA | Critical to set appropriate k parameter (5-7 for real-time, 10-20 for offline); requires clean calibration data [13] [38] |
| AMICA with Sample Rejection | ICA decomposition with integrated artifact rejection | Enable sample rejection with 5-10 iterations at 3SD threshold; robust even with limited data cleaning [4] |
| Motion-Net Deep Learning | CNN-based framework for subject-specific artifact removal | Requires training per subject; achieves 86% artifact reduction and 20dB SNR improvement [40] |
| Visibility Graph Features | Structural information for deep learning models | Enhances model accuracy on smaller datasets; improves artifact removal consistency [40] |
| Dual-Layer Electrodes | Physical separation of brain signals and motion artifacts | Provides reference noise signals mechanically coupled to electrodes but not in contact with scalp [13] |
Independent Component Analysis (ICA) is a fundamental statistical signal processing technique used to separate observed signals, such as EEG or MEG data, into statistically independent source signals. Its application in neuroscience is crucial for isolating and removing artifacts (e.g., from eye blinks, heartbeats, or muscle movement) from neural signals of interest. The core assumption is that these various source signals are statistically independent and non-Gaussian.
A central challenge in employing ICA is optimizing component selection. Overcleaning—the excessive removal of independent components (ICs)—poses a significant risk. It can result in the unintended loss of neural signals of interest, potentially distorting brain activity maps, altering spectral power estimates, or invalidating conclusions drawn from the data. This technical support document provides troubleshooting guides and FAQs to help researchers navigate the process of artifact removal while strategically preserving neural data integrity.
Frequently Asked Questions (FAQs)
Q1: What are the primary risks of overcleaning my EEG data with ICA? Overcleaning, or excluding too many Independent Components (ICs), directly leads to the loss of neural signals. This can manifest as:
- Distortion of Event-Related Potentials (ERPs): Altering the amplitude or latency of brain responses.
- Reduction in Spectral Power: Particularly in frequency bands like alpha or beta, leading to inaccurate assessments of brain activity.
- Diminished Data Rank and Information: Removing an excessive number of components reduces the complexity and informational content of your dataset, potentially excising meaningful brain network activity along with artifacts [41].
Q2: How can I determine the optimal number of independent components to keep? Selecting the correct number of ICs is critical to avoid under-decomposition (leaving artifacts) or over-decomposition (breaking neural signals into noise). Several automated methods exist, as summarized in the table below [3] [2].
Table 1: Methods for Determining the Optimal Number of ICs
| Method | Brief Description | Key Advantage | Key Disadvantage |
|---|---|---|---|
| CW_ICA | Divides data into two blocks, runs ICA separately, and uses rank-based correlation between ICs to find the optimal number [2]. | High computational efficiency and robustness for signals with different characteristics [2]. | Performance may degrade with very small sample sizes [3]. |
| TSS-ICA | Employs a two-stage sampling strategy to create representative sub-blocks and uses hypothesis testing on component similarity [3]. | Suitable for both small-scale and high-dimensional datasets; provides statistical significance [3]. | More complex implementation due to the two-stage sampling and testing procedure [3]. |
| Durbin-Watson (DW) Criterion | Measures the signal-to-noise ratio in residual signals after ICA decomposition. Values near 0 indicate under-decomposition, while values near 2 indicate over-decomposition [2]. | Provides a metric for each signal channel. | Can be subjective when interpreting heatmaps and may have high variance in real-world, non-linear data [2]. |
| RELAX-Jr Pipeline | A fully automated pipeline that uses wavelet-enhanced ICA (wICA) and an adjusted algorithm to identify artifact components, designed to be sensitive to data from populations like children [41]. | Reduces experimenter bias and is optimized for noisy data where artifacts are more pronounced [41]. | May be over-adapted for typical adult datasets. |
Q3: My ICA results are inconsistent. What preprocessing steps are essential before running ICA? Proper preprocessing is vital for a stable and accurate ICA solution. A key step is filtering.
- High-Pass Filtering: Apply a high-pass filter with a ~1 Hz cutoff before fitting ICA. This removes slow drifts that reduce the independence of sources, making it harder for the algorithm to find a good solution. The ICA solution found on the filtered data can then be applied to the unfiltered raw signal [20].
Q4: I am using ICA for EOG artifact correction, but the algorithm is not detecting blinks correctly. What should I do? This is a common issue often related to parameter settings.
- Check Event Detection: First, verify what parts of the signal are being classified as EOG peaks. Use functions like
find_eog_events()and plot these events on the raw EOG channel to ensure they align with actual blinks. - Adjust Thresholds: If detections are too few or too many, manually adjust the detection threshold. The default threshold may not be suitable for your data. Experiment with values (e.g.,
90e-6to500e-6) to find what best captures blinks without including other noise [42].
Troubleshooting Guides
Issue 1: A Specific Neural Signal (e.g., Alpha Rhythm) Appears Weakened After ICA
Problem: After ICA cleaning, a known neural signal of interest has been reduced in power or is absent. Diagnosis: This is a classic symptom of overcleaning. The independent component representing the neural signal (e.g., an occipital alpha rhythm) may have been mistakenly identified as an artifact and removed. Solution:
- Systematic Component Inspection: Before applying ICA, always visually inspect the topographical map, time course, and frequency spectrum of each component.
- Identify Neural Components: Look for components with a plausible brain topography (e.g., an alpha component localized to the occipital lobe) and a frequency spectrum showing a clear peak in the alpha band.
- Re-run ICA, Preserving Neural ICs: When applying ICA, explicitly exclude only the components definitively identified as artifacts (e.g., blink components with a frontal scalp distribution and large EOG channel contribution). Ensure components matching neural signals are not added to the exclude list.
Issue 2: ICA Decomposition is Unstable or Fails to Converge
Problem: The ICA algorithm fails to find a solution, or the results change dramatically with different random seeds. Diagnosis: This is often caused by inappropriate data rank or the presence of strong, non-stationary noise. Solution:
- Ensure Data is Appropriately Scaled and Whitened: ICA in toolboxes like MNE-Python automatically scales and whitens data using PCA as a first step [20].
- Reduce Dimensionality: If you have many channels, manually specify the
n_componentsparameter to be less than the total number of channels. This can stabilize the decomposition. - Use a Robust ICA Algorithm: Consider using the Picard algorithm, which is known to converge faster and be more robust than FastICA or Infomax when sources are not completely independent, a common scenario with real EEG/MEG data [20] [41].
Experimental Protocols & Workflows
Protocol: A Standard Workflow for Safe ICA-based Artifact Removal
This protocol provides a step-by-step methodology for using ICA to remove artifacts while minimizing the risk of overcleaning.
1. Data Preparation and Preprocessing:
- Import Data: Load your continuous EEG/MEG data.
- Filter: Apply a high-pass filter at 1 Hz to remove slow drifts. A low-pass filter can also be applied, but it is not strictly required for ICA [20].
- Segment (Optional): For event-related studies, epoch the data around your events of interest.
2. Fit the ICA Model:
- Choose Parameters: Select an ICA algorithm (e.g.,
picardfor robustness) and specify the number of components (n_components). Using a float value (e.g.,0.99) to explain 99% of the variance is a safe and data-driven starting point [20]. - Fit ICA: Apply the ICA
fit()method to the preprocessed data.
3. Identify Artifactual Components:
- Automated Detection: Use provided functions (e.g.,
find_bads_eogfor eye blinks,find_bads_ecgfor heartbeats) to get an initial list of suspect components [20]. - Visual Inspection: This is a critical step. Manually inspect each component using:
plot_components(): View the topographical map of all components.plot_properties(): For a single component, see its topography, time course, and power spectrum.
- Label Components: Categorize each component as "Neural," "Blink," "Heartbeat," "Muscle," or "Unknown." Only mark clear, unambiguous artifacts for exclusion.
4. Apply ICA and Reconstruct Data:
- Apply with Exclusion: Use the
apply()method, specifying only the confirmed artifact components in theexcludeparameter. This reconstructs the sensor signal without the contribution of the artifact components, thereby preserving all other neural signals [20].
The following workflow diagram visualizes this protocol and the key decision points for preserving neural signals.
The Scientist's Toolkit: Essential Research Reagents & Software
This table details key software tools and algorithms essential for implementing the strategies discussed in this guide.
Table 2: Key Software and Algorithmic "Reagents" for ICA Optimization
| Tool/Algorithm Name | Type | Primary Function | Role in Avoiding Overcleaning |
|---|---|---|---|
| MNE-Python [20] | Software Library | A comprehensive open-source Python package for exploring, visualizing, and analyzing human neurophysiological data. | Provides the full ICA workflow with transparent control over fitting, component inspection, and application, preventing automated over-aggressive cleaning. |
| EEGLAB [43] | Software Environment | An interactive MATLAB toolbox for processing continuous and event-related EEG, MEG, and other electrophysiological data. | Offers extensive plugins (like RELAX-Jr) and visualization tools for manual component rejection, giving the researcher final authority. |
| RELAX-Jr Pipeline [41] | Automated Pipeline | A fully automated EEG pre-processing pipeline designed for developmental data, incorporating wavelet-enhanced ICA (wICA). | Its adjusted artifact detection algorithms are specifically tuned to be more sensitive to noisy data, reducing the risk of misclassifying neural signals as noise. |
| Picard Algorithm [20] [41] | ICA Algorithm | An ICA method that converges faster and is more robust than FastICA or Infomax on real-world data. | A stable decomposition reduces the variance in identified components between runs, leading to more reliable and consistent artifact identification. |
| CW_ICA / TSS-ICA [3] [2] | Dimensionality Determination Method | Algorithms to automatically determine the optimal number of independent components to extract. | Directly addresses the core problem by providing a data-driven estimate for the number of components, preventing over-decomposition from the outset. |
Electroencephalography (EEG) is the only brain imaging method light enough and with the temporal precision to assess electrocortical dynamics during human locomotion and other naturalistic behaviors [44]. However, the recorded signals are notoriously susceptible to contamination from various artifacts, including those originating from eye movements, muscle activity, and, particularly in mobile settings, head motion. These artifacts can severely contaminate the EEG and reduce the quality of subsequent Independent Component Analysis (ICA) decomposition, a cornerstone technique for isolating and removing non-brain signals [44] [4]. For researchers in neuroscience and drug development, where the integrity of neural data is paramount, optimizing the preprocessing pipeline is a critical step. This technical resource center explores the impact of two prominent artifact removal approaches—Artifact Subspace Reconstruction (ASR) and iCanClean—on ICA decomposition, providing evidence-based guidelines and troubleshooting support for your experimental work.
Comparative Analysis: ASR vs. iCanClean
Table 1: Performance Comparison of Motion Artifact Removal Approaches
| Approach | Key Mechanism | Effect on ICA Decomposition | Key Performance Findings |
|---|---|---|---|
| iCanClean | Uses pseudo-reference noise signals for adaptive denoising [44]. | Improved recovery of dipolar brain independent components [44]. | Somewhat more effective than ASR; enabled identification of the expected P300 ERP congruency effect during running [44]. |
| Artifact Subspace Reconstruction (ASR) | Identifies and removes high-variance artifact subspaces from the data [4]. | Improved recovery of dipolar brain independent components [44]. | Effectively reduced power at the gait frequency; produced ERPs similar to those identified in static tasks [44]. |
| Generalized Eigenvalue Decomposition (GED) | Uses contrast between conditions to separate brain and artifact signals [45]. | Increased number of brain components by 10.9 and 11.8 for real data during walking/jogging [45]. | Superior to ASR and ICA in very low Signal-to-Noise Ratio (SNR) regimes; enabled microstate analysis during motion [45]. |
Detailed Experimental Protocols and Workflows
Protocol 1: Evaluating Preprocessing for an Overground Running Task
This protocol is adapted from a comparative study that evaluated motion artifact removal during dynamic activities [44].
- Data Acquisition: EEG is recorded from participants while they perform a cognitive task (e.g., a Flanker task) under two conditions: dynamic jogging and static standing.
- Preprocessing: The continuous data is high-pass filtered at 1 Hz. This step is critical for ICA, which is sensitive to low-frequency drifts [46] [47].
- Artifact Removal: The data is preprocessed using either the iCanClean algorithm (with its pseudo-reference noise signals) or the standard ASR routine.
- ICA Decomposition: ICA is run on the preprocessed data. The use of the Adaptive Mixture ICA (AMICA) algorithm is recommended for its power [4].
- Evaluation Metrics:
- ICA Quality: Assessed via the number and quality of "brain" components, measured by their dipolarity [44].
- Artifact Removal: Quantified by the reduction in power at the gait frequency and its harmonics [44].
- Signal Fidelity: Evaluated by the recovery of expected event-related potential (ERP) components, such as the P300 congruency effect [44].
Protocol 2: Systematic Evaluation of Data Cleaning Strength on AMICA
This protocol investigates the built-in sample rejection feature of the AMICA algorithm, which can be fine-tuned for optimal results [4].
- Data Preparation: Gather multiple EEG datasets with varying levels of motion intensity, from stationary to highly mobile.
- AMICA Configuration: Run the AMICA decomposition while systematically varying the sample rejection parameters:
- Cleaning Iterations: The number of times bad samples are rejected (e.g., from 0 to 10 iterations).
- Rejection Threshold: The standard deviation threshold for rejecting bad samples (e.g., 3 SDs).
- Quality Assessment: Evaluate the decomposition quality using multiple measures:
- Mutual information between components.
- The proportion of brain, muscle, and 'other' components.
- Residual variance of brain components.
- Signal-to-noise ratio in a specific experimental condition.
- Result: Empirical evidence suggests that moderate cleaning (e.g., 5 to 10 iterations of AMICA's sample rejection) is likely to improve the decomposition of most datasets, regardless of motion intensity [4].
Diagram 1: AMICA sample rejection workflow.
The Scientist's Toolkit: Essential Research Reagents & Algorithms
Table 2: Key Algorithms and Software Tools for ICA-based Artifact Removal
| Tool Name | Type/Category | Primary Function in Research |
|---|---|---|
| iCanClean | Artifact Removal Algorithm | Uses adaptive filtering with pseudo-reference signals to remove motion, muscle, and line-noise artifacts, improving ICA decomposition [44]. |
| Artifact Subspace Reconstruction (ASR) | Artifact Removal Algorithm | Identifies and removes high-variance components in sliding windows of the data, effective for large, transient artifacts [44] [4]. |
| AMICA (Adaptive Mixture ICA) | ICA Algorithm | A powerful ICA algorithm that includes an integrated, model-driven function for rejecting bad samples during decomposition [4]. |
| Generalized Eigenvalue Decomposition (GED) | Artifact Removal Algorithm | A contrast-based method effective for artifact removal even in ultra-low SNR conditions, validated for ambulatory EEG [45]. |
| EEGLAB | Software Environment | A collaborative, open-source environment for processing EEG data, offering implementations of ASR, AMICA, and other plugins [46]. |
| MNE-Python | Software Library | An open-source Python package for exploring, visualizing, and analyzing human neurophysiological data, with built-in ICA support [47]. |
Troubleshooting Guide & Frequently Asked Questions (FAQs)
FAQ 1: Why does my ICA decomposition look abnormal, with one component explaining most of the variance and showing a focal topomap?
This is a common issue, often traced to large, localized artifacts in the raw data that dominate the decomposition.
- Potential Cause: A single bad channel or persistent, high-amplitude artifacts (e.g., from an occipital electrode) can cause this [48].
- Solution:
- Inspect Raw Data: Before running ICA, carefully inspect the raw data and power spectral density (PSD) plots for channels with excessive noise or artifacts [48].
- Remove Bad Channels: Identify and interpolate or remove blatantly bad channels before filtering and running ICA [48].
- Reject Bad Segments: Manually or automatically remove time segments containing large, non-stereotypical artifacts (e.g., large electrode shifts or spikes). This step has been shown to significantly improve ICA results [48].
FAQ 2: My ICA finishes much faster than I expected. Is this a sign of a problem?
Not necessarily. The computation time for ICA is highly dependent on the algorithm and implementation you use.
- Explanation: The
fasticaandpicardalgorithms in MNE-Python are highly optimized and can be significantly faster than some implementations in other software (like EEGLAB'sbinica) [48]. This efficiency alone does not indicate a problem. - Action: To ensure quality, focus on the results rather than the speed. Check the resulting components and their topographies for the expected mix of brain and artifact components. You can also try alternative algorithms like Picard or Extended Infomax for comparison [48].
FAQ 3: Should I apply artifact removal techniques like ASR before or after ICA?
The consensus from recent literature is that these techniques can be effectively applied before ICA to create a cleaner dataset for decomposition.
- Best Practice: Use ASR or iCanClean as a preprocessing step on the continuous data after filtering but before ICA [44]. These methods reduce large-amplitude motion artifacts that can bias the ICA solution, leading to a better separation of sources and more dipolar brain components [44] [4].
- Note: When using ASR, a lenient cutoff is recommended to avoid removing neural signal along with the artifacts [48].
FAQ 4: How do I determine the optimal number of independent components to extract?
This is a fundamental question with several methodological approaches.
- Standard Practice: A common and simple approach is to set the number of components (
n_components) equal to the number of channels in your data, which is the maximum possible [18]. - Advanced Methods: For a more data-driven determination, novel methods are being developed. One approach involves running ICA on sub-blocks of the observed signals and determining the number of "pure" components that are remarkably similar between blocks [3]. In MNE-Python, you can also set
n_componentsto a float (e.g.,0.999999) to select the number of components required to explain a certain proportion of the data's variance [47].
Diagram 2: The complete preprocessing pipeline with troubleshooting inputs.
Frequently Asked Questions (FAQs)
FAQ 1: Can Independent Component Analysis (ICA) be used for artifact removal in single-channel EEG? Traditional ICA is challenging to apply directly to single-channel EEG because it requires multiple channels to separate sources effectively. However, a hybrid approach can overcome this. By first decomposing the single-channel signal into multiple components using a method like Complete Empirical Mode Decomposition with Adaptive Noise (CEEMDAN), you create a pseudo-multichannel dataset. ICA can then be applied to these components to identify and remove those correlated with artifacts, such as eye blinks (EOG) [49].
FAQ 2: What are the most effective methods for handling EOG artifacts in single-channel EEG? Research indicates that hybrid methods combining signal decomposition with advanced filtering are highly effective. One promising method is Fixed Frequency Empirical Wavelet Transform (FF-EWT) with a Generalized Moreau Envelope Total Variation (GMETV) filter. This approach automatically identifies and removes artifact-laden components based on features like kurtosis and dispersion entropy. Another validated method combines Discrete Wavelet Transform (DWT) with CEEMDAN and ICA (DWT-CEEMDAN-ICA) to solve the "overcomplete" problem and effectively eliminate EOG artifacts [15] [49].
FAQ 3: How does low-density EEG affect artifact removal, and what strategies are recommended? Low-density EEG (typically fewer than 16 channels) limits the effectiveness of standard artifact rejection techniques like ICA because of reduced spatial information. This is a common challenge with wearable EEG devices. Strategies include:
- Targeted Algorithms: Using methods specifically designed for low-channel counts, such as hybrid pipelines that integrate artifact subspace reconstruction (ASR) or single-channel blind source separation (SCBSS) techniques [11].
- Channel-Type Specific Processing: When running ICA on low-density systems that include non-EEG channels (e.g., EMG), select only EEG channels for decomposition, as relationships between EEG and EMG signals may involve propagation delays that violate ICA's assumptions [9].
FAQ 4: Does artifact correction always improve decoding performance in EEG analysis? Not necessarily. Systematic research shows that while artifact correction is crucial for interpretability, it can sometimes reduce decoding performance. This happens because artifacts like eye movements can be systematically associated with the task or condition being decoded. If a classifier learns to use these artifactual patterns for prediction, removing them will lower its accuracy. Therefore, the goal should be a balance between valid neural signal interpretation and performance, rather than maximizing performance alone [50].
Detailed Experimental Protocols
Protocol 1: Single-Channel EOG Removal using DWT-CEEMDAN-ICA
This protocol is designed to overcome the limitations of ICA in single-channel setups by creating a virtual multi-channel dataset [49].
Workflow Diagram: DWT-CEEMDAN-ICA Protocol
Methodology:
- Signal Decomposition: Perform Discrete Wavelet Transform (DWT) on the contaminated single-channel EEG signal. This decomposes the signal into approximation and detail coefficients.
- Mode Decomposition: Apply CEEMDAN to the wavelet coefficients. This adaptive decomposition generates a set of Intrinsic Mode Functions (IMFs), solving the mode-mixing problem of simpler EMD and creating a sufficient number of input components for ICA.
- Source Separation: Form a pseudo-multichannel dataset from the obtained IMFs. Apply ICA (e.g., using the
runicaalgorithm in EEGLAB) to this dataset to separate independent sources [9]. - Artifact Identification: Calculate the sample entropy of each independent component. Components with entropy values significantly higher than the average are identified as artifact-dominated (e.g., EOG) and marked for removal.
- Signal Reconstruction: Reconstruct the artifact-corrected EEG signal from the remaining components.
Protocol 2: Low-Density EEG Preprocessing for Optimal ICA
This protocol outlines steps to prepare low-density EEG data for the most effective ICA decomposition, which is sensitive to data quality [46] [20].
Workflow Diagram: Low-Density EEG Preprocessing
Methodology:
- High-Pass Filtering: Filter the raw data with a 1-2 Hz high-pass cutoff. This removes slow drifts that can dominate the signal's variance and bias ICA towards these high-amplitude, low-frequency components, improving the decomposition of neural data in higher frequencies [46].
- Data Cleaning: Identify and remove bad channels or severely contaminated data segments. Including channels filled with zeros or persistent noise can crash or significantly slow down the ICA computation [46].
- Downsampling: If the original sampling rate is high (e.g., >500 Hz), consider downsampling the data to around 250 Hz. This compresses data size and can help ICA produce better decomposition by cutting off unnecessary high-frequency information. Anti-aliasing filtering is applied automatically during this step in tools like EEGLAB [46].
- ICA Execution: Compute the ICA decomposition using a chosen algorithm (e.g., Infomax, FastICA, or Picard). For low-density data, use all available EEG channels for the decomposition [9].
- Component Inspection: Visually inspect the resulting independent components. Identify artifacts based on their scalp topography (e.g., frontal projection for eye blinks), time course (e.g., spike-like patterns for muscle activity), and power spectrum (e.g., wide-band for muscle) [9] [20].
Table 1: Performance Comparison of Single-Channel Artifact Removal Methods
| Method | Key Metrics | Reported Performance | Primary Application |
|---|---|---|---|
| FF-EWT + GMETV [15] | Relative RMSE (RRMSE), Correlation Coefficient (CC), Signal-to-Artifact Ratio (SAR) | Lower RRMSE, Higher CC, Improved SAR on real and synthetic data | EOG Artifact Removal |
| DWT-CEEMDAN-ICA [49] | Overcompleteness solved, Mode Aliasing reduced, Sample Entropy thresholding | Effective EOG removal while preserving signal integrity, validated on real data | EOG Artifact Removal |
| VMD-BSS [51] | Euclidean Distance (ED), Spearman Correlation (SCC) | ED: ~704.04, SCC: 0.82 | General Artifact Removal |
| DWT-BSS [51] | Euclidean Distance (ED), Spearman Correlation (SCC) | ED: ~703.64, SCC: 0.82 | General Artifact Removal |
Table 2: Impact of Preprocessing Choices on Low-Density EEG Decoding Performance
| Preprocessing Step | Typical Recommendation | Impact on Decoding Performance |
|---|---|---|
| High-Pass Filter Cutoff [50] | 1-2 Hz | Higher cutoffs (e.g., 1 Hz) consistently increased decoding performance. |
| Artifact Correction (ICA, AutoReject) [50] | Apply to remove artifacts | Generally decreased decoding performance, as classifiers may learn artifactual patterns. |
| Low-Pass Filter Cutoff [50] | e.g., 40 Hz | Lower cutoffs (e.g., 40 Hz) increased performance for time-resolved decoders. |
| Detrending / Baseline Correction [50] | Apply linear detrending | Increased decoding performance in most experiments. |
The Scientist's Toolkit: Key Research Reagents & Materials
Table 3: Essential Computational Tools for Single-Channel and Low-Density EEG Analysis
| Tool / Algorithm | Function in Analysis | Application Context |
|---|---|---|
| CEEMDAN | Adaptive time-frequency decomposition to create multiple components from a single signal. | Solves the "overcomplete" problem, enabling ICA on single-channel EEG [49]. |
| Fixed Frequency EWT (FF-EWT) | Signal decomposition method that targets specific fixed frequency ranges associated with artifacts. | Effectively isolates EOG artifacts in single-channel EEG for precise removal [15]. |
| Sample Entropy | A measure of signal complexity used to automatically identify noisy components. | Serves as a thresholding metric to flag artifact-dominated ICA components [49]. |
| Variational Mode Decomposition (VMD) | Decomposes a signal into a set of band-limited intrinsic mode functions (BLIMFs). | Used in hybrid BSS methods for isolating artifacts in both single and multi-channel EEG [51]. |
| Artifact Subspace Reconstruction (ASR) | A statistical method for identifying and removing high-variance artifact components. | Suitable for cleaning continuous data in low-density and wearable EEG systems [11]. |
Benchmarking Performance: Validation Metrics and Comparative Analysis
This guide provides a standardized framework for validating the success of Independent Component Analysis (ICA) in artifact removal, a critical step in electrophysiological data processing for research and drug development. Proper validation ensures that artifact removal techniques effectively eliminate noise without distorting the underlying neural signals of interest. Below, we detail the key metrics, experimental protocols, and troubleshooting advice for optimizing your ICA component selection process.
FAQ: Key Validation Metrics
Q1: What are the core quantitative metrics for validating ICA-based artifact removal? The four primary metrics for validating ICA success are Signal-to-Noise Ratio (SNR), Root Mean Square Error (RMSE), Correlation Coefficient, and Dipolarity. Each measures a different aspect of performance, from the accuracy of the cleaned signal to the physiological plausibility of the isolated components.
Q2: Why is Dipolarity an important metric in neuroimaging research? Dipolarity measures how well an independent component's scalp topography can be explained by a single equivalent current dipole in the brain [52]. A high dipolarity score (e.g., >90%) indicates that the component is likely of cerebral origin, which helps distinguish brain-derived components from those generated by muscle, eye movement, or other non-cerebral artifacts [52].
Q3: My cleaned data shows a high correlation with the original data, but I suspect neural signals were also removed. How can I verify this? A high correlation can be misleading, as it may indicate that both signal and noise remain. To verify, you should cross-validate with the Dipolarity metric [52]. Furthermore, investigate the trial-to-trial variability of the artifact components; low variability can cause ICA to inaccurately remove brain-derived data, leading to a false high correlation [16].
Q4: What is an acceptable RMSE value after ICA cleaning? Acceptable RMSE values are context-dependent and relate to the amplitude of your signal. For instance, one study on ECG denoising reported successful artifact removal with an RMSE that was comparable to or better than wavelet-based methods, particularly for atypical noises like electrode cable movement [53]. Establishing a baseline RMSE for your specific data type and noise profile is recommended.
Troubleshooting Guide
Problem: Poor Signal-to-Noise Ratio (SNR) After ICA
- Symptoms: The cleaned signal appears noisy, or expected neural responses are obscured.
- Potential Causes & Solutions:
- Cause 1: Insufficient Data for ICA Training. ICA requires a large amount of clean, representative data to function correctly [9].
- Solution: Ensure you are using a sufficient number of data points (e.g., many trials) for the ICA decomposition. For a high number of channels, more data is required.
- Cause 2: Incorrect Number of Components.
- Solution: Consider using an ICA method with a built-in noise model, like Spectral Matching ICA (SMICA), which can estimate fewer sources than sensors without a potentially detrimental PCA pre-processing step [52].
- Cause 3: Suboptimal ICA Algorithm.
- Solution: Experiment with different ICA algorithms available in toolboxes like EEGLAB (e.g., Infomax, FastICA, JADE, SOBI). The choice of algorithm can impact performance depending on your data's properties [9].
- Cause 1: Insufficient Data for ICA Training. ICA requires a large amount of clean, representative data to function correctly [9].
Problem: High RMSE and Signal Distortion
- Symptoms: The cleaned signal deviates significantly from the expected ground truth or original signal in key segments.
- Potential Causes & Solutions:
- Cause 1: Over-aggressive Component Rejection. Removing components that contain neural signal.
- Solution: Use a combination of metrics for component selection, not just a single one. Prioritize components with low dipolarity and atypical power spectra for rejection [9].
- Cause 2: Inaccurate Ground Truth.
- Solution: When using simulated artifacts, ensure they accurately reflect real-world noise properties. For example, simulate electrode cable movement artifact as a sum of sinusoids with frequencies between 1.5 and 8 Hz [53].
- Cause 1: Over-aggressive Component Rejection. Removing components that contain neural signal.
Problem: Low Dipolarity in All Components
- Symptoms: Few or none of your isolated components have scalp maps that can be fit well by a single dipole.
- Potential Causes & Solutions:
- Cause 1: Persistent, Widespread Artifacts. Muscle or movement artifacts may dominate the decomposition.
- Solution: Ensure data is clean before ICA. Manual rejection of severely contaminated data portions before running ICA is often necessary [9].
- Cause 2: ICA Assumptions Are Violated. Components may not be statistically independent.
- Solution: Be aware that artifacts with low trial-to-trial variability (a common feature of TMS-induced artifacts) can break the assumption of independence, leading to unreliable component separation [16].
- Cause 1: Persistent, Widespread Artifacts. Muscle or movement artifacts may dominate the decomposition.
Experimental Protocols & Methodologies
Protocol 1: Validating with Simulated Artifacts
This method is used to quantitatively assess ICA performance when a ground truth is known.
- Data Preparation: Start with a clean, artifact-free electrophysiological recording (e.g., EEG/MEG) [16].
- Artifact Simulation: Add simulated artifacts to the clean data at varying amplitudes (e.g., 25%, 50%, 75%, 100% of maximum noise amplitude). Common simulated noises include:
- ICA Processing: Run your chosen ICA algorithm on the contaminated data.
- Component Selection & Signal Reconstruction: Identify and remove artifact-related components.
- Metric Calculation: Compare the cleaned signal to your original, clean ground truth using RMSE, SNR, and Correlation Coefficient.
Protocol 2: Assessing Component Physiological Plausibility
This method is used on real data where a ground truth is unknown.
- ICA Decomposition: Run ICA on your pre-processed dataset.
- Component Inspection: For each component, examine:
- Dipolarity Calculation: Fit an equivalent current dipole (ECD) to the scalp topography of each component. Calculate the dipolarity, which reflects how well a single dipole explains the topography [52].
- Classification: Classify components as "brain-like" (high dipolarity) or likely artifactual (low dipolarity, atypical spectrum, e.g., high power at high frequencies for muscle noise) [9].
The following tables summarize key quantitative findings from the literature to serve as benchmarks for your research.
Table 1: ICA Performance Comparison on MEG Localization
Data derived from phantom MEG datasets with low-amplitude dipole sources (20 nAm) [52]
| ICA Method | Median Dipole Localization Error | Key Feature |
|---|---|---|
| SMICA | 1.5 mm | Uses spectral diversity and a noise model |
| Competing Methods | ≥ 7 mm | Traditional noiseless ICA (often with PCA) |
Table 2: Dipolarity Performance on EEG Data
Comparison of methods based on the number of strongly dipolar sources recovered [52]
| ICA Method | Number of Strongly Dipolar Sources (>90% dipolarity) | Key Feature |
|---|---|---|
| SMICA | >80% (with 10 sources) | Noisy model, estimates fewer sources than sensors |
| Competing Methods | ≤ 65% (with 10 sources) | Traditional non-Gaussian ICA |
Table 3: Example Noise Parameters for Validation
Parameters for generating simulated artifacts based on established protocols [53]
| Noise Type | Simulation Parameters | Typical Amplitude |
|---|---|---|
| Power Line Interference | 50/60 Hz sinusoid | 0.333 mV |
| EMG (Muscle) Noise | Random Gaussian signal | Standard deviation ~10% of peak-to-peak EEG |
| Baseline Wander | Slow sinusoid (e.g., 0.15-3 Hz) | ~1 mV |
| Electrode Cable Movement | Sum of sinusoids (1.5, 3.16, 6.3, 8 Hz) | Up to 200% of peak-to-peak EEG |
Workflow Diagrams
ICA Validation Workflow
Metric Calculation Logic
The Scientist's Toolkit
Table 4: Essential Research Reagents & Solutions
| Item | Function in ICA Validation |
|---|---|
| Clean, Ground-Truth Datasets | Baseline signals for validating artifact removal accuracy using RMSE and correlation [16] [53]. |
| Simulated Artifact Libraries | Controlled noise signals (power line, EMG, baseline wander) to test ICA performance quantitatively [53]. |
| ICA Software Toolboxes (e.g., EEGLAB) | Provides multiple ICA algorithms (Infomax, FastICA, JADE) and visualization tools for component inspection [9]. |
| Dipole Fitting Tool | Software utility to calculate the dipolarity of components, assessing physiological plausibility [52]. |
| High-Density Sensor Arrays | EEG/MEG systems with many sensors improve ICA's ability to separate independent sources [9]. |
Frequently Asked Questions (FAQs)
Q1: What is the core theoretical difference between ICA and more recent approaches like ASR or iCanClean?
A1: The core difference lies in their foundational principles and operational scope. Independent Component Analysis (ICA) is a blind source separation method that relies on the statistical principles of non-Gaussianity and independence to separate mixed signals into their underlying source components [23] [54]. It assumes that the observed data is a linear mixture of statistically independent source signals and aims to find a separating matrix that maximizes the independence of the output components [55].
In contrast, newer methods often target specific artifact properties or use different mathematical frameworks:
- Artifact Subspace Reconstruction (ASR) uses a sliding-window principal component analysis (PCA) to identify and remove high-amplitude, high-variance artifacts based on a calibration period of clean data [13] [56]. It is primarily a statistical outlier detection method.
- iCanClean leverages canonical correlation analysis (CCA) to identify and subtract noise subspaces from the EEG signal that are highly correlated with reference (or pseudo-reference) noise signals [13] [56]. Its operation is guided by direct correlation with noise, rather than assumptions of source independence.
- Deep Learning (DL) models (e.g., CLEnet, AnEEG) do not rely on pre-defined statistical assumptions. Instead, they use data-driven training to learn a mapping function from artifact-contaminated EEG to clean EEG. CLEnet, for example, integrates Convolutional Neural Networks (CNN) and Long Short-Term Memory (LSTM) networks to simultaneously extract morphological and temporal features from the signal for artifact removal [14] [57].
The following diagram illustrates the fundamental difference in how ICA and a representative deep learning model (CLEnet) process data to remove artifacts:
Q2: When should a researcher choose ICA over a deep learning method like AnEEG or CLEnet for artifact removal?
A2: The choice hinges on data availability, computational resources, and the need for interpretability.
| Factor | Independent Component Analysis (ICA) | Deep Learning (e.g., AnEEG, CLEnet) |
|---|---|---|
| Data Requirements | Requires a large amount of data for a good decomposition (e.g., ~30 mins of high-density EEG) [56]. | Requires a large, labeled dataset for training (clean vs. noisy EEG pairs) [14] [57]. |
| Computational Cost | Computationally intensive and slow; can take hours for high-density data, making it less suitable for real-time use [56]. | High computational cost is front-loaded in training; after training, application can be very fast, enabling real-time use [14]. |
| Interpretability | High. Produces components with topographies and timecourses that can be linked to brain sources or specific artifacts, allowing for informed manual curation [1]. | Low. Acts as a "black box"; the filtering process is not easily interpretable, making it hard to verify what neural information may be altered [14]. |
| Ideal Use Case | Offline analysis where component inspection is desired, or when labeled training data is unavailable. | Real-time processing or offline analysis when a high-quality labeled dataset exists and maximum automation is preferred. |
Q3: Our lab wants to implement iCanClean. What are the key experimental parameters we need to optimize?
A3: Successful implementation of iCanClean requires careful optimization of its core parameters based on your specific data and artifacts [13].
Noise Reference Configuration:
- Dual-layer Sensors (Optimal): Use mechanically coupled electrodes that are not in contact with the scalp to record pure motion and environmental noise [56].
- Pseudo-reference Signals (Fallback): If dedicated noise sensors are unavailable, create pseudo-references by applying a temporary notch filter (e.g., below 3 Hz) to the raw EEG to isolate noise subspaces [13].
Canonical Correlation Analysis (CCA) Parameters:
- R² Threshold: This critical value determines which noise-correlated components are subtracted. A higher threshold (e.g., ~0.65) is more conservative, preserving more brain signal but potentially leaving some artifact. A lower threshold is more aggressive [13].
- Sliding Window Length: The duration of the data window used for CCA. A 4-second window has been shown effective for capturing motion artifacts during human locomotion [13].
Q4: How does the performance of ICA compare to ASR and iCanClean in removing motion artifacts during running?
A4: Quantitative studies show that preprocessing with ASR or iCanClean generally leads to better outcomes than ICA alone for motion-laden data like running. The table below summarizes a comparative study on EEG during running [13]:
| Method | Key Metric: ICA Component Dipolarity | Key Metric: Power at Gait Frequency | Key Metric: P300 ERP Congruency Effect |
|---|---|---|---|
| ICA Alone | Lower quality decomposition due to massive motion artifact [13]. | Significant power remains at the step frequency and its harmonics [13]. | Often too contaminated to reliably capture the expected effect [13]. |
| ICA + ASR | Improved recovery of dipolar brain components [13]. | Significantly reduced power at the gait frequency [13]. | Produced ERP components similar to those in a static task [13]. |
| ICA + iCanClean | Most effective in recovering dipolar brain components [13]. | Significantly reduced power at the gait frequency [13]. | Successfully identified the expected greater P300 amplitude to incongruent flankers [13]. |
Troubleshooting Note: A common issue with ASR is "over-cleaning" if the threshold parameter (
k) is set too low, which can remove brain activity. It is recommended not to setkbelow 10 for locomotion studies [13].
Troubleshooting Guides
Problem: ICA Decomposition Yields Poor or Unstable Components
Possible Causes and Solutions:
Insufficient or Non-Diverse Data:
- Symptoms: Components appear noisy, do not map to clear topographies, or change drastically between runs.
- Solution: Ensure you have recorded an adequate amount of data. For mobile EEG, a minimum of 30 minutes of high-density (100+ channel) data is often recommended to provide enough information for a stable decomposition [56].
Incorrect Dimensionality Selection:
- Symptoms: Many components are dominated by a single, highly weighted gene/feature (over-decomposition) or components are large and contain multiple mixed regulons/sources (under-decomposition) [58].
- Solution: Use a dimensionality selection method like OptICA. This method aims to select the highest dimensionality that produces a low number of components dominated by a single gene/feature, thus avoiding both over- and under-decomposition [58]. The process involves computing ICA across a range of dimensions and analyzing the stability and structure of the resulting components.
Inadequate Preprocessing:
- Symptoms: A few components are dominated by high-amplitude artifacts, obscuring the separation of neural sources.
- Solution: Incorporate a robust preprocessing step before ICA. Using ASR or iCanClean to first remove large motion and muscle artifacts can dramatically improve the subsequent ICA decomposition, leading to more dipolar and interpretable brain components [13].
Problem: Choosing Between Multiple Deep Learning Architectures
Decision Framework:
If your primary challenge is removing a known, specific artifact type, you can choose a specialized model. However, for general-purpose use with multi-channel data and unknown artifacts, a model like CLEnet is more robust. The following workflow can guide your decision:
| Category | Item / Software | Brief Description / Function |
|---|---|---|
| Algorithms & Code | FastICA / Infomax ICA | Standard algorithms for performing ICA decomposition, available in toolboxes like EEGLAB [23] [59]. |
| Artifact Subspace Reconstruction (ASR) | Real-time capable artifact removal method, included in EEGLAB and BCILAB [13] [56]. | |
| iCanClean | A novel framework using CCA and reference noise signals for comprehensive artifact removal [13] [56]. | |
| CLEnet | A deep learning model combining dual-scale CNN and LSTM for end-to-end artifact removal from multi-channel EEG [14]. | |
| AnEEG | A generative model using an LSTM-based Generative Adversarial Network (GAN) for producing clean EEG [57]. | |
| Data & Validation | ICLabel | An EEGLAB plugin for automated classification of ICA components into categories (brain, eye, muscle, etc.) [13]. |
| Phantom Head Apparatus | An electrically conductive head model with embedded sources to obtain ground-truth signals for validating artifact removal methods [56]. | |
| Key Metrics | Dipolarity | Measures how well an ICA component's scalp topography can be explained by a single dipole in the brain; a hallmark of a brain component [13]. |
| Signal-to-Noise Ratio (SNR) | Measures the level of desired signal relative to background noise. An increase after processing indicates better performance [14] [57]. | |
| Correlation Coefficient (CC) | Quantifies the linear similarity between the processed signal and a ground-truth clean signal [14] [57]. |
Troubleshooting Guide: Artifact Removal and Analysis
Q1: After using ICA for artifact removal, my ERP components (like P300) appear attenuated, especially in prefrontal recordings. What could be the cause?
Artifact removal can inadvertently remove neural signals if component selection is not optimized. This is particularly true for prefrontal ERP measurements, where traditional parietal-centric components like P300 are naturally smaller, and other components like P200 are more prominent [60]. Over-cleaning is a common cause.
Diagnosis Checklist:
- Compare Topographies: Plot the scalp topographies of the components you removed. Brain-origin components should typically show smooth, focal distributions. Components classified as artifacts (e.g., eye blinks, muscle) have characteristic topographies, such as a strong frontal projection for eye artifacts [9].
- Review ERPimage: Use the
erpimage.mfunction in EEGLAB to visually inspect the component's activity. This can help distinguish brain-related activity from noise [9]. - Check Preprocessing Log: Aggressive preprocessing steps before ICA, such as high-pass filtering with a very high cutoff or extreme Artifact Subspace Reconstruction (ASR) parameters (e.g., a low 'k' value below 10), can distort or remove neural signals [13].
Solution:
- Re-run ICA with Careful Preprocessing: Avoid over-cleaning. For ASR, a 'k' parameter between 10-30 is recommended to preserve brain signals while removing artifacts [13].
- Use a Semi-Automated Approach: Instead of relying solely on automated classifiers, combine them with visual inspection of component properties (scalp map, activity time course, power spectrum) to make final rejection decisions [9].
- Leverage Advanced Tools: For data with strong motion artifacts, consider using algorithms like iCanClean, which can be more effective than ASR in preserving brain sources during decomposition, especially when using pseudo-reference noise signals [13].
Q2: My connectivity measures (PLV, Coherence, Granger Causality) show inconsistent results after artifact correction. How can I verify the integrity of my connectivity analysis?
Residual artifacts or the removal of neural signals can severely distort connectivity metrics. Ensuring the cleaned data is free from these contaminants is key.
Diagnosis Checklist:
- Inspect Component Time Courses: Look for remaining high-amplitude, high-frequency bursts in the data, which are indicative of residual muscle artifacts that inflate connectivity estimates.
- Analyze the Beta Band: Pay particular attention to the beta band (13-30 Hz). The absence of expected event-related desynchronization (ERD) in this band after cleaning could indicate that the process has removed or distorted true neural activity related to task performance and readiness [60].
- Validate with Ground Truth: If possible, compare your results with a known condition. For example, in a memory task, compare connectivity on "target" versus "lure" trials. Enhanced global connectivity in theta and gamma bands on target trials is a common finding that can serve as a sanity check [61].
Solution:
- Use Robust Connectivity Estimators: For directed connectivity like Granger Causality, use modern multivariate autoregressive (MVAR) model-based estimators such as Generalized Partial Directed Coherence (GPDC) or direct Directed Transfer Function (dDTF). These methods are better at resolving issues like volume conduction [61].
- Implement a Double-Check Workflow: After ICA and component rejection, apply a secondary, targeted artifact removal method. For instance, use a method like Fixed Frequency Empirical Wavelet Transform (FF-EWT) combined with a Generalized Moreau Envelope Total Variation (GMETV) filter to automatically identify and remove any remaining eye-blink artifacts from the cleaned EEG signal [15].
Q3: I am working with a limited-channel (especially two-channel) prefrontal EEG system. How do I adapt my analysis for reliable ERP and connectivity measures?
Limited-channel systems require tailored analysis approaches, as standard methods developed for high-density systems may not be directly applicable [60].
Diagnosis Checklist:
- Identify the Dominant Components: Recognize that in prefrontal ERP signals, the P200 amplitude may be a more reliable marker than the P300 latency, which is typically smaller in frontal regions [60].
- Assess Signal Consistency: Check for high trial-to-trial variability in response time and ERP latency. Greater variability is a known characteristic of cognitive impairment and can obscure results [60].
- Evaluate Synchronization: In connectivity analysis, a loss of synchronization in the beta band in response to standard stimuli can be a key finding, as it may indicate impaired brain communication [60].
Solution:
- Focus on Variability and Connectivity: For ERP analysis, use measures of P300 latency variability and response time variability as they can be more sensitive markers than amplitude alone [60].
- Prioritize Robust Connectivity Metrics: For two-channel connectivity, Phase Locking Value (PLV) and Coherence (COH) are highly suitable. They are relatively robust to noise and are effective at revealing a loss of neural synchronization in clinical populations [60].
- Leverage Deep Learning Frameworks: For a more advanced analysis, employ a deep learning-enriched framework like a 'Functional-Connectivity-Net' (FCNet). Such a framework can optimally identify the most informative frequency components and connectivity inflow/outflow patterns from limited data, providing non-linear, discriminative measures of information flow [62].
Experimental Protocols for Method Validation
The following table summarizes key methodologies from recent studies for validating artifact removal impacts on downstream analysis.
| Study Objective | Core Methodology | Key Outcome Measures | Critical Parameters & Tools |
|---|---|---|---|
| Validating Motion Artifact Removal [13] | Compare iCanClean (with pseudo-reference) vs. Artifact Subspace Reconstruction (ASR) on EEG data collected during running. | 1. ICA Component Dipolarity2. Power Reduction at gait frequency3. Recovery of P300 ERP congruency effect | - iCanClean: R² threshold=0.65, 4s sliding window.- ASR: ‘k’ parameter=20-30.- Task: Adapted Flanker task during jogging vs. standing. |
| Analyzing Directed Connectivity in Memory [61] | Use a Multivariate Autoregressive (MVAR) model on EEG to compute Granger Causality for a recognition memory task. | 1. Directed Connectivity (GPDC, dDTF)2. Enhanced global connectivity in theta/gamma bands on target trials. | - Estimators: Generalized Partial Directed Coherence (GPDC), direct Directed Transfer Function (dDTF).- Analysis: Time-frequency effective connectivity. |
| Assessing Prefrontal ERP in Cognitive Decline [60] | Analyze two-channel prefrontal ERP signals from a large cohort (N=1,754) during an auditory oddball task. | 1. P300 Latency Variability2. Beta Band Connectivity (PLV, Coherence)3. Presence of Event-Related Desynchronization (ERD) | - Connectivity Measures: Phase Locking Value (PLV), Coherence (COH).- Groups: Cognitively Normal (CN), Subjective Cognitive Decline (SCD), amnestic/non-amnestic MCI. |
| Single-Channel EOG Artifact Removal [15] | Propose an automated method using Fixed Frequency EWT (FF-EWT) and a GMETV filter. | 1. Relative Root Mean Square Error (RRMSE)2. Correlation Coefficient (CC)3. Signal-to-Artifact Ratio (SAR) | - Decomposition: FF-EWT into six Intrinsic Mode Functions (IMFs).- Component Identification: Kurtosis, Dispersion Entropy, Power Spectral Density. |
The Scientist's Toolkit: Research Reagent Solutions
| Tool / Algorithm | Primary Function | Application Context |
|---|---|---|
| ICA (EEGLAB) [9] | Blind source separation to decompose EEG into independent components for artifact identification and removal. | Standard preprocessing for artifact removal in multi-channel EEG studies. |
| iCanClean [13] | Motion artifact removal using Canonical Correlation Analysis (CCA) and reference noise signals. | Ideal for mobile EEG studies involving walking, running, or other gross motor movements. |
| Artifact Subspace Reconstruction (ASR) [13] | Identifies and removes high-variance artifacts from continuous EEG using a sliding-window PCA. | Fast, automated cleaning of continuous EEG data; effective for a variety of artifacts. |
| Fixed Frequency EWT (FF-EWT) + GMETV [15] | Automated decomposition and filtering to remove EOG artifacts from single-channel EEG. | Critical for preprocessing data from portable, single-channel EEG devices. |
| Phase Locking Value (PLV) & Coherence (COH) [60] | Measures functional connectivity and phase synchronization between two brain signals. | Assessing brain network integrity, particularly in the beta band, in clinical populations. |
| Granger Causality / GPDC / dDTF [61] | Estimates directed, effective connectivity (information flow) between brain regions. | Investigating the directionality of neural communication in cognitive tasks like memory retrieval. |
| Functional-Connectivity-Net (FCNet) [62] | An interpretable convolutional neural network to decode and analyze spectral directed functional connectivity. | Extracting optimal, non-linear measures of information inflow/outflow from complex connectivity networks. |
Workflow Diagrams for Experimental Processes
Experimental Validation Workflow
ICA Component Selection Logic
Frequently Asked Questions (FAQs)
FAQ 1: Under what experimental conditions is manual correction superior to automated methods?
Manual correction by experts is significantly more accurate than automated algorithms, especially when dealing with complex or novel artifact types that automated systems have not been trained on. This approach is considered the "gold standard" for correcting distortions like drift in eye-tracking data during reading tasks [63]. Experts are better at interpreting context and applying nuanced corrections. However, this superiority depends on the corrector's experience; novice correctors perform on par with the best automated algorithms [63]. Manual correction is most justified in studies where the highest possible spatial or component accuracy is critical for validating findings, such as in single-trial analyses or when establishing ground truth for new paradigms.
FAQ 2: My ICA decomposition leaves residual artifacts. How can I improve component classification?
Residual artifacts after ICA often stem from suboptimal training data or incorrect filter settings. To improve classification [64] [25]:
- Optimize ICA Training Data: Improve the quality of the data used to train the ICA algorithm by massively overweighting the proportion of training data that contains high-amplitude myogenic artifacts (e.g., saccadic spike potentials). This helps the algorithm better learn to identify and separate these artifacts [64].
- Adjust Filter Settings: Apply an optimal high-pass filter to the data before ICA decomposition. For mobile EEG experiments, a high-pass filter cutoff of up to 2 Hz can lead to better decomposition quality compared to the more traditional 0.5 Hz cutoff used for stationary data [65].
- Assess Component Variability: Be aware that ICA performance can be unreliable if the artifact has low trial-to-trial variability, as this can create dependencies between components. In such cases, ICA might incorrectly remove brain-derived signals along with the artifact. You can estimate this reliability by measuring the variability of the ICA-derived components themselves [25].
FAQ 3: When should I consider using a hybrid approach for artifact correction?
A hybrid approach is recommended when both the preservation of neural signal fidelity and high throughput are required. This is common in large-scale studies or those involving naturalistic behaviors where multiple artifact types (e.g., motion, ocular, muscle) are present [13] [63]. You can first apply an automated, data-driven method like iCanClean or Artifact Subspace Reconstruction (ASR) to handle large, stereotyped motion artifacts [13]. Subsequently, expert manual review can be used to inspect and correct residual, irregular artifacts that the automated method missed. This strategy balances efficiency with the accuracy of expert oversight.
Troubleshooting Guides
Problem: Inconsistent ICA component selection across researchers. Solution: Implement a standardized component classification protocol.
- Step 1: Establish clear, predefined criteria for identifying common artifact types (e.g., ocular, muscle, cardiac, motion) based on component topography, time course, and spectral properties.
- Step 2: Use standardized tools like ICLabel to provide an initial, automated classification of components. However, do not rely on them exclusively, especially for mobile EEG data, as they may not be trained on all artifact types [13].
- Step 3: For critical studies, have multiple trained researchers independently classify the components and then calculate the inter-rater agreement (e.g., Intra-Class Correlation Coefficient). Resolve discrepancies through consensus discussion [63].
Problem: Automated artifact removal is distorting neurogenic activity. Solution: Validate and adjust automated cleaning parameters.
- Step 1: Quantify potential overcorrection by comparing the cleaned data to a known baseline or ground truth. For example, check if event-related potential (ERP) components known to be present in the task (like the P300 in a Flanker task) are preserved with the expected latency and amplitude after cleaning [13].
- Step 2: If using Artifact Subspace Reconstruction (ASR), increase the
kparameter (e.g., to 20-30 or higher). A lowerkvalue is more aggressive and can "overclean" the data, inadvertently removing brain signals. A higher value is more conservative [13]. - Step 3: If using iCanClean, adjust the
R²correlation threshold. A higher threshold will subtract fewer noise components, reducing the risk of removing neural data [13]. - Step 4: On a subset of data, compare the automated cleaning results to a carefully performed manual correction to assess the degree of neural signal distortion [63].
Problem: How to select the best artifact removal method for a specific experiment. Solution: Use a systematic, quantitative evaluation framework based on your research goals.
Evaluate different methods (e.g., manual, ASR, iCanClean) against the following criteria using a representative sample of your data [13]:
- Criterion 1: Component Dipolarity. After applying ICA, assess the quality of the decomposition by measuring the number and proportion of independent components that have a dipolar topography. A higher number of dipolar components suggests a better decomposition [13].
- Criterion 2: Signal Power at Artifact Frequencies. For motion artifacts, calculate the power spectral density of the cleaned data. A good method will significantly reduce power at the frequency of the artifact (e.g., gait frequency during walking/running) and its harmonics without affecting other frequency bands broadly [13].
- Criterion 3: Fidelity of Event-Related Potentials. Check if the cleaned data reproduces expected ERP components (e.g., P300 congruency effects in a Flanker task) that are similar to those obtained in a stationary, low-motion condition [13].
The table below summarizes a quantitative comparison from a study on motion artifact removal during running.
Table 1: Quantitative Comparison of Artifact Removal Methods for Mobile EEG during Running (adapted from [13])
| Method | ICA Component Dipolarity | Power Reduction at Gait Frequency | P300 Congruency Effect Recovery |
|---|---|---|---|
| iCanClean (with pseudo-reference) | Best recovery of dipolar brain components | Significant reduction | Yes, identified the expected effect |
| Artifact Subspace Reconstruction (ASR) | Good recovery of dipolar brain components | Significant reduction | Produced similar P300 latency, but congruency effect not specified |
| Standard ICA (no preprocessing) | Reduced by motion artifacts | Not significantly reduced | Not reliably identified |
Experimental Protocols
Protocol 1: Validating Manual vs. Automated Correction Accuracy with Synthetic Data
This protocol uses synthetic data with a known ground truth to objectively evaluate the accuracy of any correction method [63].
- Data Generation: Create synthetic eye-tracking or EEG trials that simulate realistic neural signals and participant behaviors (e.g., fixations, saccades, regressions during reading).
- Introduce Distortions: Systematically introduce known types and magnitudes of distortion (e.g., noise, slope, shift, offset) into the synthetic data.
- Apply Correction Methods: Have both expert and novice human correctors, as well as automated algorithms, correct the distorted data.
- Accuracy Measurement: Compare the corrected data from each method to the original, undistorted synthetic data. Calculate accuracy metrics such as the root mean square error (RMSE) or fixation position error.
Diagram: Synthetic Data Validation Workflow
Protocol 2: Optimizing ICA for Ocular Artifact Removal in Free-Viewing Experiments
This protocol details steps to improve the identification and removal of ocular artifacts from EEG data recorded during tasks with unconstrained eye movements [64].
- Data Collection: Record simultaneous EEG and eye-tracking data.
- Data Filtering: High-pass filter the continuous EEG data. A cutoff of 1-2 Hz is often more effective than 0.5 Hz for data with eye movements.
- Overweight Artifact-rich Periods: Create a custom dataset for ICA training by selectively overweighting data segments containing large ocular artifacts like saccadic spike potentials (SPs).
- Run ICA: Perform ICA decomposition (e.g., using Infomax ICA) on this optimized training dataset.
- Component Classification & Rejection: Use the concurrent eye-tracking data to objectively identify and label ICA components that are correlated with ocular events. This can be automated and is more reliable than classification based on topography alone.
Diagram: Optimized ICA Pipeline for Ocular Artifacts
The Scientist's Toolkit: Research Reagent Solutions
Table 2: Essential Tools and Methods for Artifact Correction Research
| Tool / Method | Function / Description | Key Application in Research |
|---|---|---|
| Independent Component Analysis (ICA) | A blind source separation technique that linearly decomposes multi-channel data into maximally independent components [13]. | The core method for isolating neural and artifactual sources in EEG data prior to classification and removal [13] [64]. |
| ICLabel | A standardized, automated classifier for ICA components that labels them as brain, eye, muscle, heart, line noise, or other [13]. | Provides a consistent baseline for component classification; useful for training new researchers and initial assessment. May be less reliable for mobile EEG data [13]. |
| Artifact Subspace Reconstruction (ASR) | An automated, data-driven method that uses a sliding-window PCA to identify and remove high-variance, high-amplitude artifacts from continuous EEG [13]. | Effective as a preprocessing step for reducing large motion artifacts in mobile brain imaging studies (e.g., during walking or running), improving subsequent ICA decomposition [13]. |
| iCanClean | An automated algorithm that uses canonical correlation analysis (CCA) and reference noise signals to detect and subtract noise subspaces from the EEG [13]. | Highly effective for preprocessing EEG to remove motion, muscle, and line-noise artifacts, particularly in human locomotion studies. Can use dedicated noise sensors or create pseudo-references from the EEG itself [13]. |
| Synthetic Data Generators | Algorithms that create simulated eye-tracking or EEG trials with known properties and controllable distortions [63]. | Provides objective ground truth for validating the accuracy of manual and automated correction methods, free from the uncertainties of real data [63]. |
Conclusion
Optimizing ICA component selection is not a one-size-fits-all process but a strategic exercise that balances automated efficiency with critical, domain-specific validation. The key takeaways are that successful implementation relies on: 1) a solid understanding of ICA principles and artifact characteristics, 2) the judicious use of automated tools like ICLabel while acknowledging their limitations in novel paradigms, 3) proactive troubleshooting for high-motion and low-channel-count scenarios, and 4) rigorous benchmarking against both traditional and emerging methods like iCanClean and deep learning models. For future directions, the integration of multimodal data (e.g., eye-tracking) and the development of more adaptive, dataset-specific classifiers hold immense promise. These advances will lead to more reliable artifact removal, directly enhancing the quality of EEG biomarkers in clinical trials and the robustness of neuroscientific findings in drug development. This progress is crucial for translating neural signals into actionable clinical insights.
References
- 1. ICA for dummies - Arnaud Delorme [https://arnauddelorme.com/ica_for_dummies/]
- 2. CW_ICA: an efficient dimensionality determination method ... [https://www.nature.com/articles/s41598-023-49355-z]
- 3. Determination of the optimal number of independent ... [https://www.sciencedirect.com/science/article/abs/pii/S0957417425014502]
- 4. Optimizing EEG ICA decomposition with data cleaning in ... [https://www.nature.com/articles/s41598-024-64919-3]
- 5. Optimizing the ICA-based removal of ocular EEG artifacts ... [https://pubmed.ncbi.nlm.nih.gov/31689537/]
- 6. EEG Artifacts: Types, Detection, and Removal Techniques ... [https://www.bitbrain.com/blog/eeg-artifacts]
- 7. Review of challenges associated with the EEG artifact ... [https://www.sciencedirect.com/science/article/abs/pii/S1746809421003384]
- 8. Removing Artifacts From EEG Data Using Independent ... - TMSi [https://www.tmsi.artinis.com/blog/removing-eeg-artifacts-with-independent-component-analysis-ica]
- 9. Independent Component Analysis for artifact removal [https://eeglab.org/tutorials/06_RejectArtifacts/RunICA.html]
- 10. A Systematic Review of Techniques for Artifact Detection ... [https://pmc.ncbi.nlm.nih.gov/articles/PMC12473706/]
- 11. A Systematic Review of Techniques for Artifact Detection ... [https://www.mdpi.com/1424-8220/25/18/5770]
- 12. An Overview of ECG Artifact Detection in EEG Signals [https://www.organscigroup.com/jcmc/article/view/JCMC-12-322/1927]
- 13. A Comparison of Approaches for Motion Artifact Removal from ... [https://pmc.ncbi.nlm.nih.gov/articles/PMC12349273/]
- 14. A novel EEG artifact removal algorithm based on an ... [https://www.nature.com/articles/s41598-025-98653-1]
- 15. Single-channel EOG artifact removal using fixed frequency ... [https://www.nature.com/articles/s41598-025-10276-8]
- 16. Measuring the accuracy of ICA-based artifact removal from ... [https://pmc.ncbi.nlm.nih.gov/articles/PMC11636693/]
- 17. Automatic Classification of Artifactual ICA-Components for ... [https://pmc.ncbi.nlm.nih.gov/articles/PMC3175453/]
- 18. Independent Component Analysis (ICA) – demystified [https://pressrelease.brainproducts.com/independent-component-analysis-demystified/]
- 19. Enhanced automatic artifact detection based on ... [https://www.sciencedirect.com/science/article/abs/pii/S0893608008000324]
- 20. Repairing artifacts with ICA — MNE 1.10.2 documentation [https://mne.tools/stable/auto_tutorials/preprocessing/40_artifact_correction_ica.html]
- 21. A review of independent component analysis application to ... [https://pmc.ncbi.nlm.nih.gov/articles/PMC3005719/]
- 22. Independent EEG Sources Are Dipolar - PMC - PubMed Central [https://pmc.ncbi.nlm.nih.gov/articles/PMC3280242/]
- 23. Independent component analysis [https://en.wikipedia.org/wiki/Independent_component_analysis]
- 24. ICA output issue - Brainstorm [https://neuroimage.usc.edu/forums/t/ica-output-issue/16893]
- 25. Measuring the accuracy of ICA-based artifact removal from ... [https://www.sciencedirect.com/science/article/pii/S1935861X23019629]
- 26. How does Independent Component Analysis ... [https://pubmed.ncbi.nlm.nih.gov/39904902/]
- 27. ICLabel [https://eeglab.org/plugins/ICLabel/]
- 28. ICLabel: An automated electroencephalographic ... [https://pmc.ncbi.nlm.nih.gov/articles/PMC6592775/]
- 29. Independent component analysis as a tool to eliminate ... [https://pubmed.ncbi.nlm.nih.gov/14530738/]
- 30. Independent Component Analysis (ICA) With Covariates ... [https://pmc.ncbi.nlm.nih.gov/articles/PMC12282553/]
- 31. Independent Component Analysis (ICA) With Covariates ... [https://pubmed.ncbi.nlm.nih.gov/40698201/]
- 32. Optimal dimensionality selection for independent component ... [https://bmcbioinformatics.biomedcentral.com/articles/10.1186/s12859-021-04497-7]
- 33. Full Information Linked ICA: addressing missing data ... [https://arxiv.org/html/2406.18829v1]
- 34. Automatic Classification of Artifactual ICA-Components for ... [https://behavioralandbrainfunctions.biomedcentral.com/articles/10.1186/1744-9081-7-30]
- 35. Automatic Removal of Physiological Artifacts in OPM-MEG [https://pmc.ncbi.nlm.nih.gov/articles/PMC12564105/]
- 36. and LDA-based decoding of EEG signals [https://www.sciencedirect.com/science/article/pii/S1053811925003076]
- 37. Motion Artifacts on EEG - TMSi - Artinis Medical Systems [https://www.tmsi.artinis.com/blog/movement-artifacts]
- 38. Motion artifact removal using Artifact Subspace ... [https://mbraintrain.com/motion-artifact-removal-using-artifact-subspace-reconstruction/]
- 39. A Comparison of Approaches for Motion Artifact Removal ... [https://www.mdpi.com/1424-8220/25/15/4810]
- 40. Motion Artifact Removal from EEG Signals Using the ... [https://www.sciencedirect.com/science/article/pii/S1746809425013886]
- 41. RELAX‐Jr: An Automated Pre‐Processing Pipeline for ... [https://pmc.ncbi.nlm.nih.gov/articles/PMC11456615/]
- 42. Problem finding and removing EOG artifacts - MNE Forum [https://mne.discourse.group/t/problem-finding-and-removing-eog-artifacts/4881]
- 43. General FAQ [https://eeglab.org/others/TIPS_and_FAQ.html]
- 44. A Comparison of Approaches for Motion Artifact Removal from ... [https://pubmed.ncbi.nlm.nih.gov/40807974/]
- 45. Contrast-based artifact removal enables microstate ... [https://pubmed.ncbi.nlm.nih.gov/41196780/]
- 46. Makoto's preprocessing pipeline - SCCN [https://eeglab.ucsd.edu/wiki/Makoto's_preprocessing_pipeline]
- 47. mne.preprocessing.ICA — MNE 1.11.0 documentation [https://mne.tools/stable/generated/mne.preprocessing.ICA.html]
- 48. Unexpected ICA Results - Support & Discussions - MNE Forum [https://mne.discourse.group/t/unexpected-ica-results/10965]
- 49. Single-channel EEG signal extraction based on DWT ... [https://pmc.ncbi.nlm.nih.gov/articles/PMC9532603/]
- 50. How EEG preprocessing shapes decoding performance [https://www.nature.com/articles/s42003-025-08464-3]
- 51. Advancements in Blind Source Separation for EEG Artifact ... [https://www.sciencedirect.com/science/article/abs/pii/S0003682X24004511]
- 52. Spectral Independent Component Analysis with noise ... [https://www.sciencedirect.com/science/article/abs/pii/S0165027021000790]
- 53. Independent Component Analysis and Decision Trees ... - PMC [https://pmc.ncbi.nlm.nih.gov/articles/PMC4048160/]
- 54. Independent component analysis: recent advances - PMC [https://pmc.ncbi.nlm.nih.gov/articles/PMC3538438/]
- 55. Independent Component Analysis (ICA) [https://towardsdatascience.com/independent-component-analysis-ica-a3eba0ccec35/]
- 56. iCanClean Removes Motion, Muscle, Eye, and Line-Noise ... [https://www.mdpi.com/1424-8220/23/19/8214]
- 57. leveraging deep learning for effective artifact removal in ... [https://pmc.ncbi.nlm.nih.gov/articles/PMC11484783/]
- 58. Optimal dimensionality selection for independent ... [https://pmc.ncbi.nlm.nih.gov/articles/PMC8653613/]
- 59. Independent Component Analysis - ML [https://www.geeksforgeeks.org/machine-learning/ml-independent-component-analysis/]
- 60. beta band responses to the auditory oddball stimuli [https://pmc.ncbi.nlm.nih.gov/articles/PMC11524914/]
- 61. ERP analysis of recognition memory process by directed ... [https://pubmed.ncbi.nlm.nih.gov/33559863/]
- 62. A deep learning-enriched framework for analyzing brain ... [https://www.nature.com/articles/s41598-025-17635-5]
- 63. On the Validity and Benefit of Manual and Automated Drift ... [https://pmc.ncbi.nlm.nih.gov/articles/PMC12101172/]
- 64. Optimizing the ICA-based removal of ocular EEG artifacts ... [https://www.sciencedirect.com/science/article/pii/S1053811919307086]
- 65. Optimizing the ICA-based removal of ocular EEG artifacts ... [https://www.semanticscholar.org/paper/Optimizing-the-ICA-based-removal-of-ocular-EEG-from-Dimigen/d232019f749d27f5dd1a020165c7793670ee81b1]