Cross-Frequency Coupling in EEG Analysis: A Comprehensive Guide for Neuroscientists and Clinical Researchers
Cross-frequency coupling (CFC) has emerged as a fundamental neural mechanism for coordinating brain networks, with significant implications for understanding cognition and neurological disorders.
Cross-Frequency Coupling in EEG Analysis: A Comprehensive Guide for Neuroscientists and Clinical Researchers
Abstract
Cross-frequency coupling (CFC) has emerged as a fundamental neural mechanism for coordinating brain networks, with significant implications for understanding cognition and neurological disorders. This article provides a comprehensive resource for researchers and drug development professionals, exploring the foundational principles of CFC, its role in brain function, and its alterations in pathological conditions. We systematically review current methodological approaches for CFC quantification, including phase-amplitude coupling and emerging statistical frameworks, while addressing critical challenges in analysis reliability and standardization. Through examination of CFC applications across psychiatric and neurological disorders, we demonstrate its potential as a biomarker for diagnosis, prognosis, and treatment development. The integration of CFC with network neuroscience and machine learning approaches offers promising pathways for advancing neurotherapeutics and precision medicine.
Understanding Cross-Frequency Coupling: From Basic Mechanisms to Clinical Relevance
Cross-frequency coupling (CFC) represents a fundamental mechanism for integrating neural activity across different spatiotemporal scales within the brain. This phenomenon describes the statistical dependencies between distinct frequency bands of neural oscillations, enabling the coordination of local fast cortical processing with global slow brain dynamics [1]. Recent studies suggest that CFC serves critical functional roles in neuronal computation, communication, and learning by providing a hierarchical organizational structure for brain networks [1]. The significance of CFC research lies in its potential to reveal how the brain seamlessly integrates information across multiple temporal and spatial domains—from the rapid, local processing required for synaptic modification to the slower, distributed networks that govern behavioral timescales and cognitive control.
In electrophysiological research, particularly electroencephalography (EEG) analysis, CFC has emerged as a crucial biomarker for understanding brain function and dysfunction. The presence and strength of CFC differ across brain areas in a task-relevant manner, change rapidly in response to sensory, motor, and cognitive events, and correlate significantly with performance in learning tasks [1]. This dynamic modulation suggests that CFC serves as a flexible mechanism for adapting brain networks to changing behavioral demands. As a research tool, analyzing CFC patterns provides a window into the brain's functional connectivity state, offering insights that complement traditional single-frequency-band analyses and revealing more complex organizational principles of neural computation.
Fundamental Types of Cross-Frequency Coupling
CFC encompasses several distinct classes of interactions between neural oscillations. Understanding these categories is essential for selecting appropriate analysis methods and interpreting results accurately within neurophysiological contexts. The three primary types of CFC are phase-amplitude coupling, phase-phase coupling, and amplitude-amplitude coupling, each with distinct characteristics and functional implications [1].
Phase-Amplitude Coupling (PAC) represents the most extensively studied form of CFC. PAC describes the dependence between the phase of a low-frequency rhythm and the amplitude (or power) of a higher-frequency oscillation [1]. This type of coupling provides an effective neural mechanism for integrating activity across different spatial and temporal scales; the low-frequency phase reflects rhythmic changes in neuronal excitability over large regions, while high-frequency amplitude increases reflect either a general increase in population synaptic activity or the selective activation of a connected neuronal subnetwork [1]. Theta-gamma coupling (4-8 Hz theta phase coupled with >30 Hz gamma amplitude) represents a particularly prominent example observed in hippocampal and cortical regions during cognitive tasks [1].
Phase-Phase Coupling (or n:m phase synchronization) occurs when the phases of two different frequency rhythms maintain a consistent relationship to each other. This form of coupling potentially serves as a mechanism for regulating communication between different spatiotemporal scales and has been implicated in temporal compression of neural patterns, such as the speedup of firing-rate correlations observed during learning that repeat during NREM sleep [1]. While computationally more challenging to detect, phase-phase CFC offers a potential mechanism for explaining how brain activity occurring at significantly different rates can be temporally coordinated.
Amplitude-Amplitude Coupling describes the correlation between the amplitude envelopes of two different frequency bands. Although this form of CFC has been observed in neural recordings and sometimes correlates with behavior, its functional role remains less clear compared to other CFC types [1]. The neurophysiological mechanisms underlying amplitude-amplitude CFC may reflect co-modulation of different frequency networks by a common neuromodulatory input or functional interactions between distinct neuronal populations.
Table 1: Types of Cross-Frequency Coupling in Neural Signals
| CFC Type | Definition | Functional Correlations | Common Frequency Combinations |
|---|---|---|---|
| Phase-Amplitude Coupling (PAC) | Phase of low-frequency oscillation modulates amplitude of high-frequency oscillation | Learning, memory, cognitive processing, information routing | Theta-Gamma (4-8 Hz & 30-90 Hz), Alpha-High Gamma (8-12 Hz & >60 Hz) |
| Phase-Phase Coupling | Consistent phase relationship between two different frequency oscillations | Temporal pattern compression, inter-scale communication | Theta-Beta (4-8 Hz & 12-30 Hz), Delta-Theta (1-4 Hz & 4-8 Hz) |
| Amplitude-Amplitude Coupling | Correlation between amplitude envelopes of different frequency bands | Less understood, potentially reflects common modulation | Theta-Alpha (4-8 Hz & 8-12 Hz), Beta-Gamma (12-30 Hz & 30-90 Hz) |
Neurophysiological Significance of CFC
The functional significance of CFC extends across multiple domains of brain function, serving as a fundamental mechanism for coordinating neural processes across spatial and temporal scales. Neuronal oscillations create rhythmic changes in cortical excitability, meaning that brain rhythms directly affect local computation by determining how stimuli are processed based on their timing relative to ongoing oscillatory phases [1]. When neuronal excitability is associated with the trough of a local field potential oscillation, stimuli time-locked to this trough may be processed faster or more comprehensively than stimuli arriving at less excitable phases [1]. This timing mechanism provides a temporal framework for organizing neural computation.
CFC, particularly phase-amplitude coupling, enables the brain to solve the problem of integrating activity operating at different timescales. Low-frequency brain rhythms (delta, theta, alpha) are often entrained by external sensory and motor events as well as internal cognitive processes, while high-frequency activity (beta, gamma) reflects local processing in cortical circuits [1]. The combination of low-frequency phase entrainment with phase-amplitude CFC provides a plausible mechanism to coordinate fast, spike-based computation with slower external and internal state events guiding perception, cognition, and action. This integration allows large-scale brain networks operating at behavioral timescales to influence the fast, local cortical processing required for effective computation and synaptic modification [1].
In clinical contexts, alterations in CFC patterns have emerged as potential biomarkers for neurological and psychiatric disorders. For instance, in the cognitive biotype of depression, researchers have observed decreased phase-amplitude coupling between theta (Pz: t =-3.512, FDR-corrected p = 0.011), alpha (P3: t =-3.377, FDR-corrected p = 0.009; Pz: t =-3.451, FDR-corrected p = 0.009), and beta (P3: t =-3.129, FDR-corrected p = 0.020; Pz: t =-3.333, FDR-corrected p = 0.020) rhythms with low gamma oscillations during eyes-closed states [2]. Conversely, coupling between delta and gamma rhythms was significantly increased in the cognitive biotype (P4: t = 3.314, FDR-corrected p = 0.022) [2]. These CFC alterations correlated with cognitive performance measures, suggesting they may reflect underlying pathophysiological mechanisms rather than mere epiphenomena.
Similarly, in reading disabilities, a Bayesian PAC framework revealed altered theta-gamma coupling at 16 Hz, particularly in frontoparietal regions, suggesting disrupted connectivity patterns in neural circuits supporting reading [3]. Using PAC features derived from this analysis, classifiers could distinguish children with and without reading difficulties with balanced accuracies of 75-80%, demonstrating the diagnostic potential of CFC measures [3]. These findings across disorders highlight how CFC metrics provide sensitive indices of network dysfunction that may not be apparent from traditional power-based analyses alone.
Quantitative Methods for CFC Analysis
The accurate quantification of CFC requires specialized analytical approaches designed to detect statistical dependencies between different frequency components of neural signals. The development of robust CFC measures represents an active area of methodological research, with multiple competing approaches offering different advantages and limitations [1]. Currently, no single "gold standard" has emerged, requiring researchers to select methods based on their specific experimental questions and data characteristics [1].
A comparative study evaluated eight different phase-amplitude CFC measures, including the Heights Ratio (HR), Kullback-Liebler based Modulation Index (KL-MI), Mean Vector Length Modulation Index (MVL-MI), Phase-Locking Value (PLV), Envelope-to-Signal Correlation (ESC), Normalized Envelope-to-Signal Correlation (NESC), General Linear Model (GLM) measure, and Power Spectral Density (PSD) of the high-frequency amplitude envelope [1]. Each method employs distinct mathematical approaches to quantify the relationship between low-frequency phase and high-frequency amplitude, with varying sensitivity to different coupling strengths and noise levels.
The Kullback-Liebler based Modulation Index (KL-MI) has been widely adopted in recent research, including studies on depression biotypes [2]. This method involves binning and averaging high-frequency amplitude values as a function of low-frequency phase, then quantifying the deviation of this distribution from uniformity using Kullback-Leibler divergence [1]. This approach provides a normalized measure of coupling strength that is relatively robust to variations in absolute power.
Table 2: Quantitative Methods for Phase-Amplitude CFC Analysis
| Method | Key Principle | Advantages | Limitations |
|---|---|---|---|
| Kullback-Liebler Modulation Index (KL-MI) | Measures divergence of amplitude-phase distribution from uniform | Normalized measure, robust to power variations | Requires multiple cycles, sensitive to noise |
| Mean Vector Length Modulation Index (MVL-MI) | Computes modulus of complex amplitude-phase vector | Simple interpretation, works with limited data | Sensitive to amplitude outliers, requires surrogate correction |
| Phase-Locking Value (PLV) | Measures consistency of phase relationship between phase and amplitude | Less sensitive to absolute amplitude values | Requires filtering of amplitude envelope |
| Envelope-to-Signal Correlation (ESC) | Correlation between raw signal and amplitude envelope | Computationally simple, intuitive | Confounded by low-frequency amplitude |
| General Linear Model (GLM) | Generalization of NESC removing phase dependence | Detects CFC for any phase relationship | More complex implementation |
| Bayesian PAC Framework | Incorporates prior knowledge and spatial dependencies | Robust to noise, models uncertainty | Computationally intensive, complex implementation [3] |
Advanced analytical frameworks continue to emerge to address limitations of conventional methods. The Bayesian PAC framework incorporates prior knowledge of significant coupling at each electrode to guide estimations, yielding a robust measure of neural synchronization both within and across brain regions [3]. This approach is particularly valuable for detecting subtle CFC alterations in clinical populations or in noisy data environments where traditional methods may struggle with reliability.
Experimental Protocols for CFC Research
EEG Data Acquisition and Preprocessing
Standardized protocols for EEG data acquisition and preprocessing are essential for obtaining reliable CFC measures. In recent research on depression biotypes, researchers acquired neural oscillation data using a 24-channel wireless EEG system configured according to the international 10-20 electrode placement system [2]. All recordings were conducted in an electromagnetically shielded chamber under controlled low-light conditions to minimize environmental artifacts. During resting-state EEG acquisition, participants were instructed to maintain a calm, relaxed, and alert state while seated comfortably, with data collected for approximately 5 minutes each under eyes-open and eyes-closed conditions [2]. Signals were typically digitized at a sampling rate of 300 Hz, providing sufficient temporal resolution to capture gamma-band activity.
Data preprocessing followed a standardized pipeline using EEGLAB, a MATLAB-based toolbox [2]. The pipeline included: (1) band-pass filtering (1-90 Hz) with a notch filter at 50 Hz to remove line noise; (2) segmentation into 2-second epochs; (3) identification and removal of artifact-contaminated epochs; (4) spherical spline interpolation for bad channels; and (5) independent component analysis (ICA) to decompose neural signals, followed by manual inspection and removal of components associated with ocular, muscular, and other artifacts [2]. After ICA cleaning and baseline correction, data were re-referenced to the average of all channels, with epochs exceeding the amplitude threshold of ±100 μV excluded from further analysis to minimize movement and muscle artifacts.
Phase-Amplitude Coupling Analysis Workflow
The core analysis workflow for assessing PAC involves several methodical steps applied to preprocessed EEG data. After preprocessing completion, researchers typically concatenate all valid epochs and perform bandpass filtering to extract specific frequency components of interest [2]. The Hilbert transform is then applied to extract the time series of low-frequency phase and high-frequency amplitude for subsequent PAC computation [2]. In studies examining multiple frequency combinations, low-frequency phase and high-frequency amplitude time series are typically extracted with a band-pass filter bandwidth of 1 Hz, yielding multiple phase frequency bands and amplitude frequency bands for comprehensive analysis.
The modulation index (MI) is calculated for all frequency pairs across channels using the Kullback-Leibler divergence method [2]. To account for potential spurious coupling arising from chance or methodological artifacts, z-scores of MIs are computed using a surrogate data approach, where temporal relationships between phase and amplitude are disrupted through shuffling or phase randomization. The final PAC values are obtained by averaging MIs across the low-frequency phase frequency and gamma amplitude frequency ranges, producing a composite measure of coupling strength for each electrode and condition.
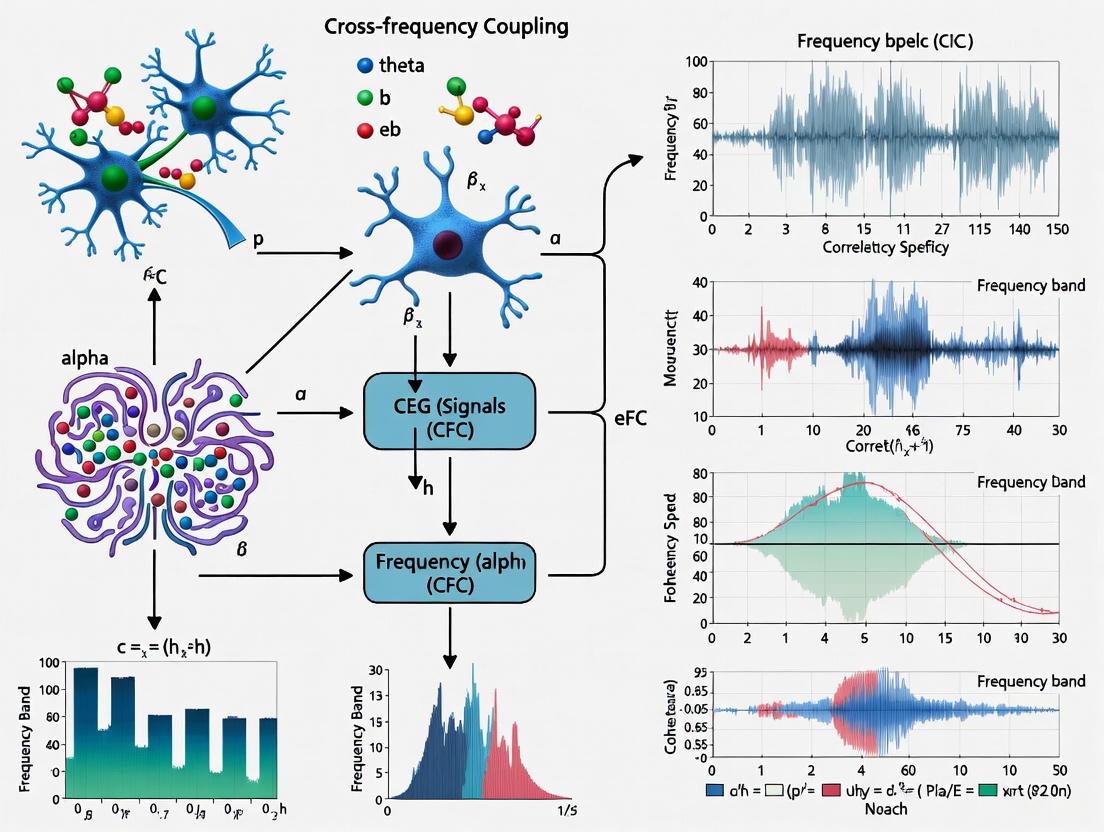
CFC Analysis Workflow: Diagram illustrating the key stages in phase-amplitude coupling analysis from raw EEG data to final PAC values.
The Scientist's Toolkit: Essential Research Reagents and Materials
CFC research requires specialized equipment, software, and analytical tools to acquire high-quality neural data and perform complex signal processing. The following table summarizes key components of the methodological toolkit for investigators in this field.
Table 3: Essential Research Materials and Tools for CFC Studies
| Category | Specific Item/Software | Function in CFC Research |
|---|---|---|
| EEG Hardware | 24-channel wireless EEG system (e.g., DSI-24) | Neural data acquisition with mobility [2] |
| Electrode Systems | International 10-20 placement system | Standardized electrode positioning for comparable data [2] |
| Shielded Chambers | Electromagnetically shielded recording rooms | Minimize environmental interference and artifact [2] |
| Analysis Software | EEGLAB (MATLAB-based toolbox) | Data preprocessing, ICA, and basic CFC analysis [2] |
| Programming Environments | MATLAB with custom scripts | Implementation of specialized CFC algorithms and statistics |
| CFC Analysis Tools | Kullback-Liebler Modulation Index | Quantifies phase-amplitude coupling strength [2] |
| Statistical Packages | SPSS, R, Python (SciPy, statsmodels) | Statistical testing and correlation analysis [2] |
| Surrogate Data Methods | Phase randomization, temporal shuffling | Controls for spurious coupling in significance testing [2] |
| Bayesian PAC Framework | Custom Bayesian modeling implementation | Robust CFC estimation incorporating priors and spatial dependencies [3] |
Beyond the technical tools listed above, rigorous CFC research requires appropriate cognitive assessment batteries when studying clinical populations or cognitive correlates. The MATRICS Consensus Cognitive Battery (MCCB) represents one such comprehensive neuropsychological test battery that has been employed to assess seven cognitive domains: attention/vigilance, working memory, speed of processing, verbal learning, visual learning, reasoning/problem solving, and social cognition [2]. The integration of such cognitive measures with CFC analysis enables researchers to establish meaningful brain-behavior relationships that illuminate the functional significance of observed coupling patterns.
Cross-frequency coupling represents a fundamental organizational principle of brain dynamics, providing a hierarchical framework for integrating neural processes across multiple spatiotemporal scales. The systematic study of CFC, particularly phase-amplitude coupling, has revealed crucial mechanisms by which the brain coordinates local fast processing with global slow dynamics to support complex cognitive functions. Methodological advances in quantifying CFC, from traditional modulation indices to emerging Bayesian frameworks, continue to enhance our ability to detect meaningful neural interactions in increasingly noisy and complex data environments.
The clinical implications of CFC research are substantial, with demonstrated alterations in coupling patterns associated with depression biotypes, reading disabilities, and other neurological conditions. These CFC biomarkers not only advance our understanding of pathophysiological mechanisms but also hold promise for developing objective diagnostic tools and monitoring treatment response. As research in this field progresses, the integration of CFC measures with other neuroimaging modalities, genetic data, and detailed behavioral assessments will further illuminate how cross-frequency interactions support healthy brain function and contribute to disease states.
The human brain operates as a complex multi-scale system where neural networks coordinate through rhythmic electrical activity. A fundamental mechanism enabling this coordination is cross-frequency coupling (CFC), which allows for the integration of information across spatial and temporal scales. CFC refers to the interaction between neuronal oscillations of different frequencies, creating a hierarchical organization where slower rhythms modulate the power or phase of faster rhythms. This mechanism facilitates selective information routing and temporal coordination between distributed brain regions, supporting complex cognitive functions from basic sensory processing to high-level executive control. The precise coordination of these oscillatory dynamics is increasingly recognized as crucial for understanding both normal brain function and the pathophysiology of neurological and psychiatric disorders, making it a target for therapeutic development.
Fundamental Concepts of Neural Oscillations and Coupling
Defining Neural Oscillation Bands
Neural oscillations are typically categorized into standardized frequency bands, each associated with distinct cognitive functions and neural generators. These oscillations reflect rhythmic fluctuations in neuronal excitability that create windows of opportunity for neural communication. The principal frequency bands include delta (1-4 Hz), theta (4-8 Hz), alpha (8-12 Hz), beta (14-25 Hz), and gamma (30-100 Hz) activity [4]. Rather than operating in isolation, these frequencies interact through specific coupling mechanisms that enable the brain to integrate information across spatial and temporal scales.
It is crucial to recognize that oscillation frequencies are not fixed properties but dynamically tuned parameters. The preferred oscillation frequency within the same broad band can differ systematically across brain regions and is modulated by sensory, cognitive, and behavioral variables [4]. For instance, visual cortical gamma-band rhythms exhibit frequency differences of several Hertz between V1 and V4, with gamma frequency increasing with visual stimulus contrast [4]. This frequency detuning plays a critical role in synchronization dynamics and phase relationship establishment between neural assemblies.
Cross-Frequency Coupling Mechanisms
CFC manifests through several distinct physiological mechanisms, with phase-amplitude coupling (PAC) being the most extensively studied. In PAC, the phase of a lower frequency oscillation modulates the amplitude of a higher frequency oscillation, creating a temporal structure for information transfer. Theta-gamma coupling, for example, is thought to support memory processes by organizing gamma-band information packets within theta cycles [2]. Other CFC forms include phase-phase coupling (n:m phase synchronization between different frequencies) and amplitude-amplitude coupling (correlations between power envelopes of different frequencies).
The functional significance of CFC lies in its ability to solve the brain's binding problem by temporally linking distributed neural activity. Low-frequency oscillations establish global temporal windows for communication, while high-frequency oscillations carry localized information content. This hierarchy allows for both integration and segregation of neural information, enabling the brain to maintain multiple information streams simultaneously without cross-talk [5] [6].
Table 1: Primary Types of Cross-Frequency Coupling in Neural Systems
| Coupling Type | Physiological Mechanism | Functional Roles | Common Frequency Combinations |
|---|---|---|---|
| Phase-Amplitude Coupling (PAC) | Phase of low-frequency oscillation modulates amplitude of high-frequency oscillation | Temporal coding, working memory, information routing | Theta-Gamma, Alpha-Gamma, Delta-Gamma |
| Phase-Phase Coupling | Phase synchronization between different frequencies | Multi-scale temporal integration | Theta-Alpha, Theta-Beta |
| Amplitude-Amplitude Coupling | Correlation between power envelopes of different frequencies | Large-scale network coordination | Alpha-Beta, Theta-Gamma |
Neurophysiological Mechanisms of Network Coordination
Frequency-Specific Routing in Attention Networks
Research using simultaneous functional MRI and electrocorticography (ECoG) has revealed that attention processes employ frequency-specific mechanisms to coordinate brain networks. During spatial attention tasks, the dorsal attention network (DAN) and ventral attention network (VAN) become selectively modulated at low frequencies (delta and theta bands) specifically during task epochs where they are functionally recruited [5]. This frequency-specific modulation alters the excitability of task-relevant regions and their effective connectivity, enabling selective information routing while minimizing interference from task-irrelevant networks.
In a spatial cueing task, following an attention-directing cue, the DAN and sensorimotor networks exhibited increased intertrial coherence in the delta band (1-3 Hz) that was maintained throughout the cue and delay periods [5]. This sustained low-frequency synchronization reflects a mechanism for maintaining attention and motor preparation. Conversely, the default-mode network, which is typically suppressed during attention-demanding tasks, showed no such low-frequency modulation [5]. The differential modulation of oscillatory activity across networks represents a fundamental mechanism for flexibly managing neural communication during goal-directed behavior.
Large-Scale Network States in Cognition
Recent magnetoencephalography (MEG) studies of visuospatial working memory have identified distinct large-scale synchronized states in theta and alpha bands that alternate to support cognitive processes [7]. Researchers identified four reproducible network states characterized by different spatial and frequency configurations: (1) increased posterior theta, (2) increased posterior alpha, (3) increased dorsal alpha, and (4) increased dorsal theta [7]. These states were linked to specific cognitive functions, with posterior theta dominance associated with information encoding (flexibility) and dorsal alpha dominance linked to information maintenance (stability).
The rate of transition between these states correlated with cognitive performance, demonstrating that dynamic switching between synchronized states, rather than sustained activity in any single state, supports optimal cognition [7]. This suggests a mechanism where the brain alternates between different functional configurations to balance stability for maintaining information with flexibility for encoding new information. These state transitions are governed by low-frequency synchronization that potentially controls the flow of information contained within higher frequencies through phase-amplitude coupling.
Phase-Modulated Information Transfer
The phase of low-frequency oscillations serves as a fundamental mechanism for regulating information transfer between brain regions. When oscillatory activity in one region becomes phase-locked to another, it creates precise temporal windows that facilitate or inhibit neural communication. This phase-based routing mechanism allows task-relevant networks to interact selectively while minimizing interference from task-irrelevant activity [5].
Experimental evidence demonstrates that attention to spatial locations induces phase-resetting of spontaneous delta oscillations in the dorsal attention network [5]. This phase resetting potentially alters the excitability of task-relevant regions and their effective connectivity by creating temporal windows for information transfer. Different attention processes (holding versus shifting attention) are associated with synchrony at different frequencies, which may minimize unnecessary cross-talk between separate neuronal processes [5]. The spatial distribution of this phase modulation closely aligns with functional connectivity networks identified through fMRI, linking oscillatory dynamics to large-scale network architecture.
Table 2: Frequency-Specific Functional Roles in Network Coordination
| Frequency Band | Primary Network Associations | Cognitive Functions | Coordination Mechanisms |
|---|---|---|---|
| Delta (1-3 Hz) | Dorsal Attention Network, Sensorimotor Network | Sustained attention, maintenance of spatial information | Phase resetting, maintained intertrial coherence |
| Theta (4-8 Hz) | Posterior Network, Hippocampal-frontal circuits | Information encoding, memory formation, error detection | Theta-gamma coupling, phase synchronization |
| Alpha (8-12 Hz) | Dorsal Attention Network, Parietal-frontal circuits | Information maintenance, inhibition of distracting information | Amplitude modulation, traveling waves |
| Gamma (30-100 Hz) | Local cortical circuits across multiple regions | Feature representation, information processing | Phase-amplitude coupling, local synchronization |
Signaling Pathways and Experimental Workflows
Signaling Pathways in Cross-Frequency Coupling
The following diagram illustrates the proposed signaling pathway through which low-frequency oscillations in large-scale networks coordinate high-frequency, information-carrying activity through phase-amplitude coupling:
This mechanism illustrates how low-frequency networks, potentially initiated by basal-ganglia-thalamocortical loops, synchronize large-scale neural populations [7]. The phase of these synchronized low-frequency oscillations then modulates the amplitude of high-frequency gamma activity through phase-amplitude coupling, creating temporal windows that regulate the flow of information carried by neural spiking activity [7]. This coordinated activity ultimately supports cognitive performance in tasks requiring both stability and flexibility.
Experimental Workflow for CFC Research
The following diagram outlines a standardized experimental workflow for investigating cross-frequency coupling in cognitive tasks, integrating methods from published studies:
This workflow integrates methods from multiple studies [5] [7], beginning with neurophysiological data acquisition during cognitive tasks, proceeding through network identification and frequency analysis, and concluding with coupling analysis and computational modeling to validate proposed mechanisms.
Research Reagent Solutions and Methodologies
Essential Research Tools for CFC Investigations
Table 3: Essential Research Reagents and Tools for CFC Studies
| Tool Category | Specific Examples | Primary Function | Key Features |
|---|---|---|---|
| Neuroimaging Hardware | MEG Systems, EEG Systems (24-channel DSI-24), ECoG Grids | Neural signal acquisition | High temporal resolution, multi-channel recording capabilities |
| Data Analysis Software | EEGLAB, AFNI, MATLAB with custom scripts | Signal processing and analysis | Time-frequency analysis, ICA, connectivity measures |
| Computational Modeling Tools | Kuramoto model simulations, Whole-brain spiking models | Mechanism testing and validation | Biologically realistic connectivity, simulation of oscillatory dynamics |
| Cognitive Task Paradigms | Posner spatial cueing task, Visuospatial Working Memory tasks, 2-back tasks | Controlled cognitive engagement | Isolate specific processes (attention, memory maintenance) |
| Specialized Analysis Packages | Phase-amplitude coupling toolkits, Modulation index calculators | Quantifying cross-frequency interactions | Surrogate statistics, multiple CFC measures |
Detailed Methodological Protocols
Phase-Amplitude Coupling Analysis Protocol
Based on established research methodologies [2], the following protocol details the steps for quantifying phase-amplitude coupling:
Signal Preprocessing: Acquire EEG/MEG/ECoG data at sufficient sampling rates (≥300 Hz). Apply band-pass filtering (1-90 Hz) with notch filtering at line noise frequency (50/60 Hz). Segment data into epochs and remove artifact-contaminated segments using automated algorithms and visual inspection. Perform Independent Component Analysis (ICA) to remove ocular, cardiac, and muscular artifacts.
Time-Frequency Decomposition: Extract low-frequency phase and high-frequency amplitude time series using band-pass filters with bandwidth of 1 Hz, typically yielding 29 phase frequency bands and 34 amplitude frequency bands. Apply Hilbert transform to filtered signals to obtain instantaneous phase and amplitude information.
Modulation Index Calculation: Compute the Modulation Index (MI) using Kullback-Leibler divergence to quantify the divergence of the amplitude distribution across phase bins from uniform distribution. Generate surrogate data by randomly shifting the amplitude time series relative to the phase time series and recalculating MI to create a null distribution. Compute z-scores of MIs using the surrogate data approach to account for potential spurious coupling.
Statistical Analysis: Perform group comparisons using independent-sample t-tests with false discovery rate (FDR) correction for multiple comparisons. Conduct correlation analyses between PAC values and cognitive performance measures using Pearson correlation coefficients.
Network State Identification Protocol
For identifying frequency-specific network states [7]:
Data Acquisition and Preprocessing: Collect MEG data during cognitive task performance. Preprocess using standard pipelines including co-registration of structural and functional images, removal of transient initial frames, slice timing correction, motion correction, spatial blurring (6 mm FWHM kernel), and bandpass filtering (0.01-0.1 Hz).
Network Identification: Filter data into frequency bands of interest (theta and alpha). Apply Independent Component Analysis (ICA) to separate independent signals within each frequency band. Use ICA operator weights to determine brain regions generating each network signal.
State Clustering: Extract network activity time courses for each identified network. Apply k-means clustering to classify each time point into states based on network activation patterns. Validate clustering stability across subjects and sessions.
State Dynamics Analysis: Calculate state transition rates and dwell times. Correlate state dynamics with behavioral performance measures (reaction time, accuracy). Compare state prevalence across task conditions and cognitive loads.
Clinical Applications and Therapeutic Implications
CFC Alterations in Neuropsychiatric Disorders
Cross-frequency coupling mechanisms are increasingly implicated in the pathophysiology of neuropsychiatric disorders, offering potential biomarkers for diagnosis and treatment response monitoring. Research on the cognitive biotype of depression has revealed specific alterations in PAC between low-frequency oscillations and gamma activity [2]. Patients with cognitive impairment in depression showed decreased PAC between theta/alpha/beta phases and low-gamma amplitude in parietal regions during eyes-closed resting state [2]. Conversely, they exhibited increased delta-gamma coupling, suggesting a compensatory mechanism or pathological shift in oscillatory coordination.
These CFC alterations correlated with cognitive performance on the MATRICS Consensus Cognitive Battery (MCCB), establishing a direct link between specific coupling patterns and cognitive dysfunction in depression [2]. The spatial specificity of these effects (parietal regions) and state-dependency (present during eyes-closed but not eyes-open conditions) highlights the precision of CFC measures as potential biomarkers. Similar CFC disruptions have been reported in schizophrenia, bipolar disorder, and ADHD, suggesting transdiagnostic significance of oscillatory coordination deficits [8].
Computational Modeling of Pathological CFC
Computational models provide mechanistic insights into how altered CFC contributes to cognitive deficits in neuropsychiatric disorders. Whole-brain models with biologically realistic connectivity can simulate both oscillatory control layers and spiking information layers [7]. These models demonstrate how synchronization in the oscillatory layer influences information flow in the spiking layer through phase-amplitude coupling, and how disruptions in this mechanism impair cognitive function.
Through in-silico modeling, researchers can manipulate specific parameters (oscillation frequencies, connection strengths, neuromodulatory influences) to simulate pathological states and test potential interventions [7]. This approach allows for hypothesis testing about causal mechanisms linking CFC alterations to cognitive symptoms, potentially identifying targets for neuromodulation therapies. Models can predict how specific pharmacological agents or stimulation protocols might normalize aberrant CFC and improve cognitive function.
The coordination of brain networks across frequencies represents a fundamental mechanism for neural information processing and cognitive function. Cross-frequency coupling, particularly phase-amplitude coupling, provides a hierarchical temporal structure that enables flexible routing of information between distributed brain regions. The precise frequency, phase, and spatial organization of these oscillatory dynamics determines functional brain states that balance stability and flexibility in cognition.
Future research should focus on developing more sophisticated computational models that incorporate multi-scale neural dynamics, from microcircuits to large-scale networks. Advanced analysis techniques that capture directional coupling and non-stationary dynamics will provide deeper insights into how CFC supports cognition. Therapeutic applications targeting CFC through pharmacological or neuromodulation approaches hold promise for treating cognitive deficits across neuropsychiatric disorders. As measurement and analysis technologies continue to advance, our understanding of these fundamental neural coordination mechanisms will undoubtedly grow, potentially revolutionizing our approach to diagnosing and treating brain disorders.
Cross-frequency coupling (CFC) is a fundamental brain mechanism where neural oscillations at different frequencies interact and coordinate their activity. This process is critical for integrating information across spatial and temporal scales, facilitating complex cognitive functions such as memory formation, attentional control, and information processing. In the hierarchy of brain oscillations, slower rhythms (e.g., theta, 4-8 Hz) are thought to organize the timing of faster rhythms (e.g., gamma, 30-90 Hz), enabling the brain to package and transfer information efficiently [9]. The precise coordination between these frequencies provides a neural basis for cognitive operations that require the integration of local processing with global brain network communication. This technical guide explores the mechanisms, functions, and methodological approaches for studying CFC in healthy brain function, with particular emphasis on its role in memory, attention, and cognition.
Neurophysiological Mechanisms of CFC
Cross-frequency coupling represents a sophisticated mechanism of neural integration that allows brain networks to communicate across different temporal and spatial scales. The primary forms of CFC include phase-amplitude coupling (PAC), where the phase of a slower rhythm modulates the amplitude of a faster oscillation; phase-phase coupling (or n:m phase synchronization), where phases of different frequencies maintain a consistent relationship; and amplitude-amplitude coupling between different frequency bands [2].
The functional architecture of CFC follows a hierarchical organization where low-frequency oscillations (theta and alpha bands) provide a temporal framework that coordinates the activity of high-frequency oscillations (gamma band), which are associated with local cortical processing. This hierarchical organization creates discrete temporal windows for information processing, allowing the brain to efficiently manage cognitive operations that require both localized computation and global integration [9]. Research has demonstrated that this coupling is particularly prominent between theta and gamma frequencies in brain regions critical for cognition, including the hippocampus, prefrontal cortex, and parieto-occipital regions [10] [9].
From a neurochemical perspective, catecholamine systems, particularly dopamine and norepinephrine, play crucial modulatory roles in CFC. Dopaminergic projections from the ventral tegmental area and substantia nigra to the prefrontal cortex fine-tune neural circuits by modulating the signal-to-noise ratio of neuronal responses [11]. Dopamine receptors (D1-family and D2-family) are distributed throughout cortical layers and influence both excitatory and inhibitory neuronal activity, thereby shaping the oscillatory dynamics that underlie CFC [11]. This neurochemical modulation enables dynamic reconfiguration of network properties in response to cognitive demands, facilitating optimal information processing during memory and attention tasks.
CFC in Memory Processes
Working Memory
Working memory, the cognitive system that temporarily holds and manipulates information, relies heavily on coordinated theta-gamma coupling. Research has demonstrated that theta-phase to gamma-amplitude coupling serves as a mechanism for organizing multiple items in working memory by creating discrete temporal slots within each theta cycle [10]. This temporal segmentation allows for the sequential processing of information chunks, thereby expanding the functional capacity of working memory buffers.
Computational models of oscillatory neural networks have provided insights into the mechanisms through which CFC enhances memory capacity. These models predict that theta-gamma oscillatory circuits in the hippocampus and cortex perform robust information storage and pattern retrieval [10]. Specifically, the inclusion of CFC in neural network models enables error-free pattern retrieval, whereas networks without CFC fail to retrieve patterns accurately. The capacity gains are most pronounced when the frequency ratio between gamma and theta oscillations matches biological observations (typically 5:1 to 7:1), supporting the functional significance of this coupling mechanism in memory processes [10].
Empirical evidence from electroencephalography (EEG) studies supports these computational findings. During working memory tasks, increased theta-gamma coupling has been observed in frontal and parietal regions, with the strength of coupling correlating with memory performance [9]. This coupling appears to facilitate the coordination between the maintenance of memory representations (mediated by theta rhythms) and the active processing of sensory information (mediated by gamma rhythms).
Long-term Memory Formation
CFC also plays a crucial role in the formation of long-term memories, particularly during the consolidation process. Studies have shown that successful memory encoding is associated with increased theta-gamma phase synchronization in medial temporal and prefrontal regions. This synchronization is thought to facilitate the transfer of information from short-term storage systems to long-term memory networks by creating optimal temporal windows for synaptic plasticity [9].
The mechanism underlying this process involves the precise timing of gamma bursts relative to the theta phase, which influences spike-timing-dependent plasticity—a fundamental process for strengthening synaptic connections. When presynaptic and postsynaptic neurons fire in close temporal proximity, synchronized by the theta rhythm, the synaptic connections between them are potentiated, leading to more stable memory representations [11]. Dopaminergic modulation from the midbrain further enhances this process by signaling the salience of information to be encoded, thereby prioritizing certain memories for consolidation [11].
Table 1: CFC Signatures in Memory Processes
| Memory Type | CFC Type | Frequency Bands | Brain Regions | Functional Role |
|---|---|---|---|---|
| Working Memory | Phase-Amplitude Coupling | Theta-Gamma | Prefrontal Cortex, Parietal Cortex | Temporal segmentation for multi-item maintenance |
| Long-term Memory Formation | Phase Synchronization | Theta-Gamma | Hippocampus, Medial Temporal Lobe | Synaptic plasticity and memory consolidation |
| Pattern Retrieval | n:m Phase Synchronization | Theta-Gamma | Hippocampal-Cortical Networks | Error-free retrieval in oscillatory neural networks |
| Associative Learning | Phase-Amplitude Coupling | Theta-Gamma | Ventrolateral Prefrontal Cortex | Acquisition of novel visuomotor associations |
CFC in Attentional Processes
Attentional control, the process of selectively focusing on relevant information while ignoring distractions, depends on coordinated neural activity across multiple brain regions. CFC serves as a key mechanism for this coordination by enabling communication between fronto-parietal networks involved in top-down control and sensory regions processing bottom-up information [9].
Research using visuo-spatial attention tasks has revealed that shifts of spatial attention modulate phase synchronization between theta and gamma activity in parieto-occipital cortex [9]. When attention is directed to a specific location, the phase of theta oscillations resets to synchronize with gamma activity, creating optimal conditions for processing attended stimuli. This cross-frequency phase synchronization is stronger in the hemisphere contralateral to the attended visual field, demonstrating its specificity to the focus of attention [9].
The functional role of CFC in attention can be understood as a memory matching mechanism [9]. Theta oscillations, which reflect top-down processes from frontal regions, carry information about task-relevant templates or expectations. Gamma oscillations, which represent bottom-up processes in sensory regions, carry information about incoming sensory input. The synchronization between these frequencies enables the comparison between stored representations and current sensory information, facilitating the detection of behaviorally relevant stimuli.
Table 2: CFC Patterns in Attentional Processes
| Attention Type | CFC Pattern | Frequency Bands | Direction of Change | Functional Significance |
|---|---|---|---|---|
| Spatial Attention | Phase Synchronization | Theta-Gamma | Increased in parieto-occipital cortex | Memory matching between template and stimulus |
| Target Detection | Phase Resetting | Theta-Gamma | Theta resetting to synchronize with gamma | Enhanced processing of attended stimuli |
| Executive Attention | Phase-Amplitude Coupling | Theta-Gamma | Increased in fronto-parietal network | Integration of top-down and bottom-up signals |
| Sustained Attention | n:m Phase Synchronization | Alpha-Beta-Gamma | Variable based on task demands | Maintenance of attentional focus over time |
CFC as a Biomarker of Cognitive Function
The integrity of CFC mechanisms serves as a sensitive biomarker of overall cognitive function and neural network efficiency. Studies of disorders of consciousness have revealed that preserved CFC patterns distinguish patients with higher levels of consciousness and better cognitive outcomes [12] [13].
In patients with acute disorders of consciousness, those who transitioned to a minimally conscious state (MCS) showed distinctly different CFC patterns compared to those who transitioned to a vegetative state (VS) [13]. Specifically, the MCS group exhibited significantly weaker cross-frequency coupling in the delta-theta and theta-beta bands, particularly in frontal-parietal regions [13]. This seemingly counterintuitive finding—where reduced CFC in certain frequency combinations associates with better outcomes—may reflect more efficient and specialized neural processing in patients with higher levels of consciousness.
Graph theoretical analysis of multilayer brain networks that incorporate both within-frequency and cross-frequency connectivity has revealed that patients with better cognitive outcomes show higher small-world properties in the alpha band and in cross-frequency theta-beta and alpha-beta networks [12] [13]. These network properties suggest better-preserved information processing efficiency, balancing both segregated and integrated information processing.
Similarly, in psychiatric conditions characterized by cognitive deficits, such as depression with cognitive impairment, specific alterations in CFC have been identified. Individuals with the cognitive biotype of depression show decreased phase-amplitude coupling between theta/alpha/beta phases and low-gamma amplitude in parietal regions during eyes-closed resting state [2]. These CFC alterations correlate with performance on cognitive tasks, particularly in domains of attention, working memory, and executive function, highlighting their value as biomarkers of cognitive dysfunction.
Methodological Approaches for CFC Analysis
Experimental Protocols and EEG Acquisition
The investigation of CFC requires carefully designed experimental protocols and precise electrophysiological recording techniques. For cognitive studies involving memory and attention, common paradigms include cued visual attention tasks [9], working memory delayed-response tasks [11], and auditory processing tasks using personally significant stimuli such as one's own name [13].
High-quality EEG data acquisition is essential for reliable CFC analysis. Standard protocols recommend:
- Using 24-channel EEG systems configured according to the international 10-20 electrode placement system [2]
- Recording in electromagnetically shielded chambers under controlled environmental conditions
- Collecting data during both eyes-open and eyes-closed resting states as well as during task performance [2]
- Employing a sampling rate of at least 300 Hz to adequately capture gamma oscillations [2]
- Using appropriate reference electrodes (typically FPz or average reference) and ground electrodes (typically left earlobe) [2]
For studies focusing on auditory cognition, presenting auditory name-calling stimulation has proven particularly effective, as it elicits robust brain activation without requiring active patient cooperation, making it suitable for populations with varying levels of consciousness [13].
Signal Processing and CFC Quantification
Robust preprocessing of EEG signals is crucial before CFC analysis. Standard preprocessing pipelines include:
- Band-pass filtering (typically 1-90 Hz) with a notch filter at 50/60 Hz to remove line noise [2]
- Segmentation of data into epochs (commonly 2-second segments) [2]
- Artifact removal using automated algorithms and visual inspection, followed by independent component analysis (ICA) to remove ocular, cardiac, and muscle artifacts [2]
- Bad channel interpolation using spherical spline methods [2]
The core of CFC analysis involves quantifying the coupling between different frequency bands. The most common approach is phase-amplitude coupling (PAC) analysis, which typically involves:
- Bandpass filtering the signal in both low-frequency (for phase) and high-frequency (for amplitude) ranges with a bandwidth of 1 Hz [2]
- Extracting phase and amplitude time series using the Hilbert transform [2]
- Calculating the modulation index (MI) using Kullback-Leibler divergence to quantify how much the amplitude of the high-frequency signal is modulated by the phase of the low-frequency rhythm [2]
- Statistical validation using surrogate data approaches (e.g., shuffling the temporal relationship between phase and amplitude) to compute z-scores of modulation indices and account for spurious coupling [2]
For n:m phase synchronization analysis, used particularly in studies of disorders of consciousness [13], researchers calculate the n:m phase synchronization index (PSI) to quantify both within-frequency and cross-frequency phase synchronization, which can then be used to construct functional brain networks.
CFC Analysis Workflow: This diagram illustrates the standard processing pipeline for cross-frequency coupling analysis of EEG signals, from raw data preprocessing to final CFC metric extraction.
Network Analysis and Graph Theory
Advanced CFC analysis involves constructing multilayer functional brain networks that incorporate both within-frequency connectivity and cross-frequency interactions [13]. This approach involves:
- Creating frequency-specific functional connectivity matrices using phase synchronization indices
- Integrating across frequency bands to form multilayer networks
- Applying graph theoretical measures to quantify network properties, including:
- Small-worldness - Balancing localized processing and global integration
- Clustering coefficient - Measuring local interconnectedness
- Characteristic path length - Assessing global integration efficiency
- Modularity - Quantifying specialized functional communities
These network metrics provide insights into how CFC supports information integration across the brain and how alterations in these patterns correlate with cognitive function and consciousness levels [12] [13].
Research Toolkit for CFC Studies
Table 3: Essential Research Tools and Reagents for CFC Studies
| Tool/Reagent | Specification/Function | Example Use Cases |
|---|---|---|
| EEG Systems | 24-channel wireless systems (e.g., DSI-24); Sampling rate ≥300 Hz | Neural oscillation data acquisition during cognitive tasks [2] |
| Analysis Software | EEGLAB (MATLAB-based toolbox) | Preprocessing, ICA, and basic CFC analysis [2] |
| CFC Analysis Packages | Custom MATLAB scripts for PAC, n:m PSI | Quantifying phase-amplitude coupling and phase synchronization [13] [2] |
| Statistical Packages | SPSS, R with specialized neuroimaging packages | Group comparisons, correlation analysis with cognitive measures [2] |
| Cognitive Assessment | MATRICS Consensus Cognitive Battery (MCCB) | Evaluating multiple cognitive domains in clinical populations [2] |
| Surrogate Data Algorithms | Phase-randomization, time-shift methods | Statistical validation of CFC measures against chance levels [2] |
| Graph Theory Tools | Brain Connectivity Toolbox, custom multilayer network scripts | Analyzing topological properties of CFC-based networks [13] |
Cross-frequency coupling represents a fundamental mechanism of neural coordination that underlies memory, attention, and broader cognitive functions. The precise interaction between low-frequency and high-frequency oscillations enables the brain to integrate information across spatial and temporal scales, facilitating complex cognitive operations. Methodological advances in EEG analysis, particularly phase-amplitude coupling quantification and multilayer network approaches, have provided unprecedented insights into these mechanisms. As research progresses, CFC measures show increasing promise as biomarkers of cognitive function and targets for therapeutic interventions in neurological and psychiatric disorders. Future research directions should focus on establishing standardized CFC metrics, elucidating the neurochemical modulation of cross-frequency interactions, and developing CFC-based neuromodulation approaches to enhance cognitive function.
Cross-frequency coupling (CFC), particularly phase-amplitude coupling (PAC), has emerged as a crucial neural trait reflecting the brain's hierarchical information processing capabilities. This technical review synthesizes current evidence on CFC as a stable, trait-like neural characteristic, examining its developmental trajectory from early critical periods of plasticity to its stabilization in adulthood. We explore the cellular and molecular mechanisms—including excitatory-inhibitory balance and extracellular matrix maturation—that govern the stabilization of CFC patterns across development. The document provides comprehensive experimental protocols for CFC quantification, detailed visualization of neural pathways, and essential research reagent solutions, serving as a foundational resource for researchers and drug development professionals investigating CFC as a biomarker for neurological and psychiatric disorders.
Cross-frequency coupling represents a fundamental mechanism for neural integration, where the phase of low-frequency oscillations modulates the amplitude of high-frequency oscillations, enabling coordinated communication across distributed brain networks. Neural traits are defined as quantifiable, brain-based characteristics that demonstrate temporal stability and influence individual differences in cognition and behavior [14]. Evidence increasingly positions CFC, particularly in the resting-state brain, as meeting these criteria through its test-retest reliability and capacity to disassociate individuals based on unique coupling patterns.
The developmental trajectory of CFC follows principles of critical period plasticity observed in sensory systems. During early life, neural circuits exhibit profound plasticity before undergoing stabilization processes. This stabilization is actively mediated by molecular "brakes" that limit excessive circuit rewiring beyond critical periods, resulting in established CFC patterns that function as enduring neural traits [15]. The anterior insula and lateral prefrontal cortex represent key regions where stable CFC patterns have been documented, with these patterns predicting individual differences in cognitive control and social decision-making [14].
Understanding CFC as a neural trait requires examining its neurobiological foundations at multiple scales. At the cellular level, parvalbumin-positive (PV+) GABAergic interneurons are crucial for generating and maintaining oscillatory activity. At the systems level, coordinated activity across large-scale networks establishes consistent CFC profiles that represent a "neural fingerprint" for individual subjects, with recent studies demonstrating recognition rates up to 99% based on unique patterns of EEG activity [14].
Developmental Trajectory of CFC Stability
The development of CFC follows a nonlinear trajectory characterized by an initial period of high plasticity followed by progressive stabilization. This developmental course is governed by the maturation of specific neurobiological systems that first enable then constrain circuit-level plasticity.
Critical Periods and Plasticity Windows
Critical periods represent developmental windows during which neural circuits demonstrate heightened sensitivity to experience-dependent shaping:
- Triggering Mechanisms: The onset of critical periods is determined primarily by the maturation of specific GABAergic circuits, particularly those containing parvalbumin (PV+ interneurons) [15]
- Timing Plasticity: Critical period timing itself exhibits plasticity—pharmacological activation of GABAA receptors can trigger premature onset, while genetic disruptions can delay plasticity windows [15]
- Cascading Organization: Critical periods unfold in a cascading fashion across brain regions, with primary sensory areas developing stability before higher-order association cortices [15]
Molecular Brakes on Plasticity
The transition from plastic to stable CFC patterns is actively mediated by molecular factors that dampen circuit rewiring capacity:
- Structural Brakes: Molecules such as chondroitin sulfate proteoglycans in perineuronal nets physically constrain neurite outgrowth and synaptic reorganization [15]
- Functional Brakes: Myelin-related proteins (e.g., Nogo Receptor) limit structural plasticity and stabilize neural connections in mature circuits [15]
- Reversibility: Experimental manipulation of these brakes can reopen plastic windows in adulthood, demonstrating their role in maintaining CFC stability [15]
Empirical Evidence for CFC Stabilization
Recent research provides direct evidence for CFC stabilization as a developmental outcome:
Table: Developmental Changes in Neural Coupling Metrics
| Age Period | CFC Pattern | Neural Correlates | Behavioral Manifestations |
|---|---|---|---|
| Early Childhood | High variability, experience-dependent | Immature GABA circuits, low myelination | Rapid learning, sensitive periods |
| Adolescence | Consolidating patterns | PV+ interneuron maturation, ECM deposition | Specialization of cognitive abilities |
| Adulthood | Stable trait-like patterns | Established PNNs, molecular brakes | Stable cognitive traits, neural fingerprints |
| Aging | Pattern dedifferentiation | PNN integrity loss, GABA decline | Cognitive flexibility changes |
Research examining academic engagement over three years demonstrates how experiential factors interact with developmental timelines to shape CFC profiles. Students with sustained academic engagement showed distinct CFC patterns during working memory tasks, specifically in T8 and P3 channels for amplitude-amplitude coupling (AAC) and C3 channels for phase-amplitude coupling (PAC). Notably, these differences emerged only during cognitive engagement (Sternberg Working Memory Task), not during resting state, highlighting the state-dependent expression of trait-level CFC differences [16].
Neurobiological Mechanisms of CFC Stability
The stabilization of CFC patterns emerges from complex interactions between excitatory and inhibitory circuits, neuromodulatory systems, and structural constraints that collectively limit circuit rewiring capacity.
Excitatory-inhibitory (E-I) balance serves as a primary regulator of CFC stability through development:
- PV+ Interneuron Maturation: The development of perineuronal nets around parvalbumin-positive interneurons enhances their temporal precision, enabling more stable gamma oscillations nested within theta phases [15]
- Circuit Stabilization: Mature GABAergic signaling restricts the temporal windows for synaptic plasticity, thereby stabilizing CFC patterns against constant perturbation [15]
- Critical Period Trigger: Direct manipulation of inhibitory transmission through benzodiazepines or genetic approaches can shift the timing of plasticity windows, demonstrating the causal role of E-I balance in CFC stabilization [15]
Structural Stabilization Mechanisms
Extracellular matrix components establish physical constraints that stabilize neural circuits underlying CFC:
- Perineuronal Nets (PNNs): Chondroitin sulfate proteoglycan-rich structures encase synaptic contacts on PV+ interneurons, physically limiting new spine formation and synaptic turnover [15]
- Myelin-Related Inhibition: Oligodendrocyte-derived signals (e.g., Nogo-A) restrict axonal sprouting and structural reorganization in mature circuits [15]
- Synaptic Consolidation: Molecular brakes such as PirB and Nogo Receptor 1 titrate anatomical plasticity in the adult brain, maintaining stable CFC patterns despite ongoing experience [15]
The following diagram illustrates the key neurobiological mechanisms that stabilize CFC patterns across development:
Network-Level Consolidation
At the systems level, CFC stability emerges from the consolidation of large-scale brain networks:
- Prefrontal Stabilization: The prefrontal cortex exhibits particularly stable CFC patterns in adulthood, contributing to consistent cognitive control capabilities [14]
- Default Mode Network Integration: Stable alpha-gamma coupling in the default network supports consistent self-referential thought patterns [17]
- Hierarchical Information Flow: CFC stabilizes the brain's hierarchical information flow, with lower-frequency oscillations in thalamocortical circuits constraining higher-frequency local processing [15]
Quantitative Assessment and Experimental Protocols
Robust quantification of CFC as a neural trait requires standardized experimental protocols and analytical pipelines. Below, we detail methodologies for assessing CFC stability and developmental trajectories.
EEG Acquisition Parameters
Consistent EEG acquisition is fundamental for reliable CFC measurement:
Table: EEG Acquisition Parameters for CFC Trait Assessment
| Parameter | Resting-State Protocol | Task-Based Protocol | Notes |
|---|---|---|---|
| Sampling Rate | ≥1000 Hz | ≥1000 Hz | Prevents aliasing of high-frequency oscillations |
| Filter Settings | 0.1-250 Hz | 0.1-250 Hz | Minimal filtering to preserve natural dynamics |
| Electrode System | 64+ channels | 64+ channels | Dense coverage for source localization |
| Impedance | <5 kΩ | <5 kΩ | Consistent signal quality across sessions |
| Recording Duration | 10 mins eyes open, 10 mins eyes closed | Task-specific blocks | Longer recordings improve reliability |
| Reference Scheme | Average reference | Average reference | Consistent re-referencing during processing |
CFC Quantification Metrics
Multiple analytical approaches capture different aspects of cross-frequency interactions:
- Phase-Amplitude Coupling (PAC): Measures the relationship between the phase of low-frequency oscillations (theta, alpha) and the amplitude of high-frequency oscillations (gamma) using modulation index or mean vector length approaches [16]
- Amplitude-Amplitude Coupling (AAC): Quantifies correlations between amplitude envelopes of different frequency bands, particularly relevant for long-range interactions [16]
- Directionality Measures: Granger causality or transfer entropy approaches that establish hierarchical directionality in cross-frequency interactions
Test-Retest Reliability Assessment
Establishing CFC as a neural trait requires demonstration of temporal stability:
- Testing Intervals: Multiple sessions separated by weeks to months to assess stability beyond transient states
- Intraclass Correlation Coefficients (ICC): Calculation of ICC values >0.7 support trait-like stability [14]
- Spatial Consistency: Evaluation of topographic stability in CFC patterns across testing sessions
The following workflow diagram outlines the complete experimental pipeline for assessing CFC as a neural trait:
Research Reagent Solutions and Methodological Tools
Advanced methodological tools and analytical approaches are essential for investigating CFC as a neural trait. The following table details key solutions and their applications in CFC research.
Table: Essential Research Reagent Solutions for CFC Investigation
| Category | Specific Tool/Reagent | Function/Application | Example Use in CFC Research |
|---|---|---|---|
| GABA Circuit Manipulation | Benzodiazepines | Prematurely activate GABAA receptors | Accelerate critical period onset and CFC stabilization [15] |
| Extracellular Matrix Modulation | Chondroitinase ABC | Degrades chondroitin sulfate proteoglycans | Reopen plasticity windows in adult cortex by removing PNNs [15] |
| Genetic Tools | PV-Cre transgenic mice | Target parvalbumin-positive interneurons | Selective manipulation of key GABAergic circuits governing oscillations [15] |
| Molecular Brake Inhibitors | Nogo Receptor antagonists | Block myelin-mediated inhibition | Enhance adult plasticity and alter established CFC patterns [15] |
| EEG Analysis Platforms | MATLAB Toolboxes (e.g., Brainstorm, FieldTrip) | CFC calculation and visualization | Quantify PAC and AAC from resting-state and task-based EEG [16] |
| Neuromodulation Approaches | tACS/tDCS | Entrain specific oscillatory patterns | Test causal relationships between oscillations and CFC stability [14] |
Clinical and Translational Applications
The conceptualization of CFC as a stable neural trait has significant implications for understanding neurodevelopmental disorders and developing novel therapeutic interventions.
CFC Alterations in Neurodevelopmental Disorders
Aberrant CFC patterns emerge as transdiagnostic biomarkers across multiple psychiatric conditions:
- Schizophrenia: Postmortem studies reveal deficient myelination, reduced perisomatic GABA synapses, and compromised perineuronal nets in the prefrontal cortex and amygdala [15]
- Autism Spectrum Disorders: Altered critical period timing may disrupt the normal stabilization of CFC patterns, contributing to sensory processing abnormalities [15]
- Major Depression: Chronic stress models demonstrate accelerated critical period closure in prefrontal circuits, potentially stabilizing maladaptive CFC patterns [17]
Therapeutic Targeting of CFC Stability
Molecular brakes on plasticity represent promising therapeutic targets for restoring adaptive CFC patterns:
- Brake Reversal Strategies: Controlled degradation of perineuronal nets or blockade of myelin-mediated inhibition could reopen therapeutic windows for intervention [15]
- Circuit-Based Therapeutics: Neuromodulation approaches targeting specific oscillation frequencies may normalize aberrant CFC in neurological disorders [14]
- Developmental Timing Considerations: Interventions must account for developmental stage, as similar approaches may have divergent effects depending on critical period status [15]
Drug Development Applications
CFC metrics offer promising endpoints for clinical trials targeting neural circuit function:
- Biomarker Validation: Establishing CFC measures as surrogate markers for target engagement in trials of GABAergic medications [15]
- Personalized Medicine: Using individual CFC profiles to stratify patients for targeted interventions based on specific circuit dysfunction [14]
- Cognitive Enhancement: Developing compounds that selectively modulate CFC to enhance cognitive function in neuropsychiatric disorders [17]
Future Research Directions
Several promising research avenues will advance our understanding of CFC as a neural trait:
- Longitudinal Developmental Studies: Tracking CFC stability from childhood through adulthood in large cohorts to establish normative developmental trajectories
- Multi-Omics Integration: Combining CFC measures with genomic, transcriptomic, and proteomic data to elucidate biological determinants of CFC stability [18] [19]
- Circuit-Specific Manipulations: Using optogenetic and chemogenetic approaches to selectively manipulate specific oscillatory generators while assessing CFC consequences
- Cross-Species Validation: Establishing translational CFC metrics that enable direct comparison between animal models and human participants
- Intervention Studies: Examining how pharmacological, behavioral, and neuromodulatory interventions alter CFC stability across the lifespan
The continued refinement of CFC as a neural trait will enhance our fundamental understanding of brain organization while providing clinically valuable biomarkers for neuropsychiatric disease progression and treatment response.
Cross-frequency coupling (CFC), particularly phase-amplitude coupling (PAC), has emerged as a crucial mechanism for neuronal computation, learning, and communication in the brain. This whitepaper synthesizes current evidence demonstrating how alterations in CFC serve as transdiagnostic biomarkers across neurological and psychiatric conditions. We present quantitative data linking specific CFC patterns to disease states, detailed experimental protocols for CFC assessment, and a mechanistic framework positioning CFC within neuropathological models. The findings underscore CFC's potential for refining diagnostic precision, monitoring treatment response, and developing targeted neurotherapeutics for conditions including depression, epilepsy, and disorders involving subconcussive impacts.
Cross-frequency coupling (CFC) refers to the statistical relationship between distinct frequency bands of neural oscillations, representing a fundamental mechanism for integrating brain activity across multiple spatiotemporal scales [20] [1]. Neural oscillations are categorized into different frequency bands including delta (1-4 Hz), theta (4-8 Hz), alpha (8-12 Hz), beta (12-30 Hz), and gamma (>30 Hz), each associated with different aspects of brain function and spatial scales [20] [1]. Low-frequency rhythms modulate activity over large brain areas with long temporal windows, while high-frequency rhythms operate over smaller regions with shorter time scales [1]. CFC provides a framework for coordinating these different levels of processing, enabling efficient information transfer and integration across distributed brain networks [20] [1].
Several distinct types of CFC have been identified, each with potential functional significance:
- Phase-Amplitude Coupling (PAC): The relationship between the phase of a low-frequency rhythm and the amplitude of a high-frequency rhythm [1]
- Phase-Phase Coupling (PPC): Synchronization between phase angles of different frequencies [20]
- Amplitude-Amplitude Coupling (AAC): Correlation between amplitude envelopes of different frequencies [20]
CFC is believed to play critical roles in neuronal computation, learning, memory, and communication by temporally organizing fast, local cortical processing within slower, large-scale brain networks [20] [1]. This hierarchical organization allows the brain to effectively coordinate sensory input, internal cognitive states, and motor output.
CFC Alterations in Psychiatric Disorders
Depression and Cognitive Biotypes
Recent research has identified distinct CFC alterations in the cognitive biotype of depression, characterized by prominent cognitive dysfunction. A 2025 study by Wang et al. investigated CFC patterns in 141 depressed patients in remission, comparing 56 individuals with cognitive impairment to 85 without cognitive impairment [2].
Table 1: CFC Alterations in Cognitive Biotype of Depression
| Low-Frequency Band | Brain Region | CFC Change | Statistical Significance | Clinical Correlation |
|---|---|---|---|---|
| Theta (4-8 Hz) | Parietal (Pz) | Decreased PAC with low gamma | t = -3.512, FDR-corrected p = 0.011 | Working memory deficits |
| Alpha (8-12 Hz) | Left Parietal (P3) | Decreased PAC with low gamma | t = -3.377, FDR-corrected p = 0.009 | Attentional impairment |
| Alpha (8-12 Hz) | Parietal (Pz) | Decreased PAC with low gamma | t = -3.451, FDR-corrected p = 0.009 | Executive dysfunction |
| Beta (12-30 Hz) | Left Parietal (P3) | Decreased PAC with low gamma | t = -3.129, FDR-corrected p = 0.020 | Processing speed reduction |
| Beta (12-30 Hz) | Parietal (Pz) | Decreased PAC with low gamma | t = -3.333, FDR-corrected p = 0.020 | Cognitive control deficits |
| Delta (1-4 Hz) | Right Parietal (P4) | Increased PAC with gamma | t = 3.314, FDR-corrected p = 0.022 | Not specified |
These CFC alterations were specifically observed during eyes-closed resting states and showed significant correlations with cognitive performance metrics, suggesting they may serve as electrophysiological biomarkers for the cognitive biotype of depression [2]. The parietal localization of these changes implicates networks involved in attentional control and information integration, consistent with the cognitive profile of this depression subtype.
Subconcussive Impacts and Headache Pathophysiology
A 2025 study examined CFC alterations in individuals exposed to repetitive subconcussive (SC) impacts, revealing disruptions in microstate-specific cross-frequency coupling networks (MCFCNs) [21]. The research involved 16 experienced male parachuters with significant exposure to subconcussive impacts compared to 16 demographically matched healthy controls.
Table 2: CFC Alterations in Subconcussive Impact Exposure
| Microstate Class | Associated Network | CFC Alteration | Functional Implication |
|---|---|---|---|
| Microstate A | Default Mode Network (DMN) to Frontoparietal Network (FPN) | Increased delta-band coupling | Altered executive control |
| Microstate A | Large-scale networks | Reduced delta/theta to alpha/beta coupling | Impaired network integration |
| Microstate C | Large-scale networks | Reduced delta/theta to alpha/beta coupling | Disrupted emotional-motor integration |
| Microstate D | Large-scale networks | Reduced delta/theta to alpha/beta coupling | Altered self-referential processing |
Machine learning analysis using LightGBM classifiers successfully discriminated SC-exposed individuals from controls based on these MCFCN features, with SHAP analysis identifying theta-DMN, beta-sensorimotor network (SMN), and delta-limbic network (LIM) interactions as critical nodes [21]. These CFC abnormalities resemble patterns observed in central pain syndromes and may represent early biomarkers for headache vulnerability and chronicity following subconcussive impacts.
CFC in Neurological Disorders
Epilepsy and Seizure Disorders
CFC has been extensively studied in epilepsy, where altered coupling patterns are associated with seizure generation and propagation. During epileptic seizures, prominent CFC occurs between low-frequency phases and high-frequency amplitudes, reflecting the pathological synchronization of neuronal networks [22]. CFC measures have shown utility in localizing epileptogenic zones and monitoring seizure activity.
In genetic syndromes associated with epilepsy, such as Cardiofaciocutaneous (CFC) syndrome, the specific genetic profile influences seizure severity and CFC patterns. CFC syndrome is a rare RASopathy caused by mutations in genes including BRAF, MAP2K1, MAP2K2, and KRAS, which disrupt the RAS-MAPK signaling pathway [23] [24]. A multinational cohort study of 138 CFC syndrome individuals revealed striking genotype-phenotype correlations in neurological manifestations [24]:
- BRAF mutations (75% of cases): 57% developed epilepsy, often moderate to severe polymorphic seizures
- MAP2K1 mutations (25% of cases): 61% developed epilepsy, particularly with p.Y130 variants
- MAP2K2 mutations (25% of cases): Only 30% developed seizures, typically less severe
- KRAS mutations (2% of cases): No epilepsy reported
These findings demonstrate how specific genetic alterations can differentially affect CFC and network synchronization, leading to varied neurological manifestations. The severe, treatment-resistant seizures observed in patients with catalytic protein kinase domain mutations of BRAF and common p.Y130 site mutations of MAP2K1 highlight the potential for CFC analysis to elucidate mechanisms of epileptogenesis [24].
Neurodevelopmental Disorders
In CFC syndrome, neurological involvement is typically more severe than in other RASopathies, with common features including intellectual disability (82%), refractory epilepsy (55%), neurocognitive impairment, motor deficits, and behavioral challenges [23] [24]. Neuroimaging frequently reveals structural abnormalities including ventriculomegaly, cortical atrophy, and hydrocephalus, which may underlie altered CFC patterns [23].
The RAS-MAPK pathway, disrupted in CFC syndrome, plays a crucial role in normal cellular processes including cell growth, proliferation, differentiation, survival, metabolism, and migration [23]. Dysregulation of this pathway leads to aberrant neuronal signaling and network synchronization, providing a molecular basis for the observed CFC alterations.
Methodological Framework for CFC Analysis
Experimental Protocols and Data Acquisition
Robust CFC analysis requires standardized methodologies to minimize spurious findings and enable cross-study comparisons [20]. The following protocol outlines key steps for CFC investigation in clinical populations:
EEG Data Acquisition Parameters:
- Equipment: 24-64 channel EEG systems (e.g., DSI-24, ANT Neuro) [2] [21]
- Electrode Placement: International 10-20 system [2] [21]
- Reference: Linked mastoids (TP9, TP10) or average reference [2] [21]
- Sampling Rate: ≥300 Hz (recommended ≥1000 Hz for high-frequency analysis) [2] [21]
- Filtering: Band-pass 0.3-100 Hz, notch filter at 50/60 Hz [21]
- Recording Conditions: Eyes-closed and eyes-open resting state (5 minutes each) [2]
Preprocessing Pipeline:
- Filtering: Band-pass (1-90 Hz) and notch filtering (50 Hz) [2]
- Segmentation: Division into 2-second epochs [2]
- Artifact Removal: Identification and rejection of contaminated epochs (±100 μV threshold) [2]
- Independent Component Analysis (ICA): Removal of ocular, cardiac, and muscular artifacts [2]
- Bad Channel Interpolation: Spherical spline interpolation [2] [21]
CFC Computation Methods: Multiple measures exist for quantifying CFC, each with specific advantages and limitations [1] [22]:
- Modulation Index (MI): Based on Kullback-Leibler divergence [2]
- Mean Vector Length (MVL): Circular statistics approach [1]
- Phase-Locking Value (PLV): Measures phase synchronization [1]
- Envelope-to-Signal Correlation (ESC): Correlation-based approach [1]
- Generalized Linear Models (GLM): Statistical framework accounting for confounding variables [22]
The GLM framework proposed by Cole & Voytek (2019) offers advantages by modeling high-frequency amplitude as a function of both low-frequency phase and amplitude, providing a more robust measure of PAC while controlling for potential confounds [22].
The Scientist's Toolkit: Essential Research Reagents
Table 3: Essential Resources for CFC Research
| Resource Category | Specific Tools | Application/Function |
|---|---|---|
| EEG Acquisition Systems | DSI-24 (Wearable Sensing), ANT Neuro EEG systems, eego amplifiers | High-quality neural signal acquisition with multichannel capabilities |
| Data Analysis Software | EEGLAB, MATLAB with custom scripts, SPSS for statistical analysis | Signal processing, CFC computation, and statistical testing |
| CFC Analysis Tools | Modulation Index (MI) scripts, Phase-Locking Value (PLV) algorithms, GLM frameworks | Quantifying different types of cross-frequency coupling |
| Cognitive Assessment | MATRICS Consensus Cognitive Battery (MCCB), Gesell developmental evaluation | Correlating CFC measures with cognitive and behavioral phenotypes |
| Genetic Analysis | Whole exome sequencing, Sanger sequencing, ACMG variant classification | Linking genetic profiles to CFC alterations in neurodevelopmental disorders |
Molecular Mechanisms and Signaling Pathways
The RAS-MAPK pathway represents a crucial molecular foundation for understanding CFC alterations in genetic neurodevelopmental disorders. This pathway, when disrupted in conditions like CFC syndrome, directly impacts neuronal excitability, synaptic plasticity, and network synchronization [23].
Molecular Pathway of CFC Alterations in RASopathies
This pathway illustrates how growth factors stimulate RAS-mediated RAF activation, which phosphorylates MEK1/2, leading to ERK1/2 activation and subsequent cellular responses [23]. In CFC syndrome, heterozygous pathogenic variants in BRAF, MAP2K1, MAP2K2, or KRAS cause gain-of-function mutations leading to ERK1-2 hyperactivation [23]. This aberrant signaling disrupts normal neuronal development, synaptic function, and network synchronization, ultimately manifesting as altered CFC patterns and clinical symptoms including epilepsy, intellectual disability, and neurodevelopmental impairments.
Discussion and Future Directions
The accumulating evidence positions CFC as a transdiagnostic biomarker reflecting network-level dysfunction across neurological and psychiatric disorders. The consistent findings of altered theta-gamma and alpha-gamma coupling in depression, subconcussive impacts, and epilepsy suggest common mechanisms of impaired network integration despite diverse etiologies.
CFC analysis offers several advantages for clinical research and therapeutic development:
- Quantifiable Biomarkers: CFC measures provide continuous, quantitative metrics of brain function
- Mechanistic Insights: CFC patterns reflect specific network synchronization properties
- Treatment Monitoring: CFC can track response to interventions and disease progression
- Target Engagement: CFC measures can confirm modulation of intended neural circuits
Future research should prioritize establishing standardized CFC methodologies, validating findings across larger cohorts, and developing normative databases for clinical comparison. The integration of CFC with other neuroimaging modalities, genetic profiling, and detailed cognitive assessment will enhance its utility as a biomarker for precision medicine approaches in neurology and psychiatry.
For drug development professionals, CFC measures offer promising intermediate endpoints for clinical trials, particularly for interventions targeting network-level dysfunction. The ability to quantitatively track neural circuit function before and after treatment could accelerate the development of novel therapeutics for conditions with currently limited treatment options.
Cross-frequency coupling represents a fundamental mechanism of brain organization whose disruption transcends traditional diagnostic boundaries. The documented alterations in depression, subconcussive impacts, epilepsy, and neurodevelopmental disorders highlight CFC's clinical relevance as a biomarker of network dysfunction. Through standardized methodologies and continued investigation of genetic and molecular mechanisms, CFC analysis holds promise for refining diagnostic classification, monitoring treatment response, and developing targeted interventions for neurological and psychiatric disorders.
CFC Analysis Methods and Research Applications: From Bench to Bedside
Cross-frequency coupling (CFC) represents a higher-order interaction in which neural oscillations at different frequencies interact, a phenomenon nearly as ubiquitous as oscillations themselves [1] [25]. These interactions are observed across various electrophysiological recording scales, from local field potentials (LFP) to electrocorticogram (ECoG) and electroencephalogram (EEG) [1]. CFC is hypothesized to serve as a mechanism for coordinating activity among disparate neural circuits and systems operating at different temporal and spatial scales [1] [25]. The precise quantification of CFC has become increasingly crucial for understanding its functional role in cognitive processes such as memory, learning, and attention, as well as its alterations in neurological and psychiatric disorders [26] [1] [27].
This technical guide provides a comprehensive overview of the primary forms of CFC—phase-amplitude, amplitude-amplitude, and phase-phase coupling—focusing on their conceptual foundations, quantitative measurement methodologies, and practical application in experimental protocols. The content is framed within the broader context of EEG signal analysis research, with particular emphasis on methodological considerations, potential pitfalls, and emerging analytical approaches that enhance the reliability and interpretability of CFC findings.
Core Concepts and Functional Significance
Neural oscillations parse ongoing neuronal activity into discrete packets with characteristic spatial and temporal scales [1]. Phase-amplitude coupling (PAC), the most extensively studied form of CFC, describes the modulation of high-frequency oscillation amplitude by the phase of a lower-frequency rhythm [28] [1]. This coupling is thought to reflect the hierarchical organization of brain networks, supporting the integration of local processing (represented by high-frequency activity) with broader network coordination (represented by low-frequency rhythms) [26]. Theta-gamma PAC in the hippocampus, for instance, has been implicated in short-term memory coding and the temporal organization of neural activity for information encoding and retrieval [26] [1].
Amplitude-amplitude coupling (AAC) refers to correlations between the amplitude envelopes of oscillations in different frequency bands [1] [27]. While observed in various contexts and correlated with behavior, the functional role of AAC remains less clearly defined compared to PAC [1].
Phase-phase coupling (PPC), also termed n:m phase-locking, occurs when the phase difference between accelerated phase time series of two oscillations remains constant [29]. This coupling type has been hypothesized to support memory processes through temporal compression mechanisms, though recent evidence suggests earlier reports may have suffered from methodological artifacts [29].
Table 1: Common Frequency Band Interactions and Their Functional Correlates
| Coupling Type | Common Frequency Pairs | Brain Regions | Associated Functions |
|---|---|---|---|
| Phase-Amplitude | Theta (4-8 Hz) - Gamma (30-100 Hz) | Hippocampus, Neocortex | Memory encoding, Information routing [28] [26] [1] |
| Phase-Amplitude | Delta (1-4 Hz) - Gamma (>30 Hz) | Sensory Cortices | Sensory processing [30] [1] |
| Phase-Amplitude | Alpha (8-12 Hz) - Gamma (>30 Hz) | Prefrontal, Parietal Cortices | Working memory, Attentional processes [26] [31] |
| Phase-Phase | Theta-Gamma n:m locking | Hippocampus | Proposed memory compression [29] |
| Amplitude-Amplitude | Various frequency pairs | Multiple | Behavioral correlates, less defined function [1] [27] |
Quantitative Measurement Approaches
Phase-Amplitude Coupling Metrics
Multiple quantitative approaches have been developed to assess PAC, each with distinct advantages and limitations [1]. No single "gold standard" has emerged, though the modulation index (MI) remains widely adopted [28] [1].
The Kullback-Leibler Modulation Index (KL-MI) quantifies PAC by measuring the deviation of the observed amplitude distribution across phase bins from a uniform distribution [28]. The calculation follows these steps:
- Filter the raw signal at the phase frequency (fP) and amplitude frequency (fA) of interest
- Extract the phase time series (φfP(t)) from the fP-filtered signal using the Hilbert transform
- Extract the amplitude envelope (AfA(t)) from the fA-filtered signal using the Hilbert transform
- Bin the phase time series and calculate the mean amplitude for each bin
- Normalize the binned amplitudes to create a distribution-like function P(j)
- Compute the KL distance between P(j) and the uniform distribution: MI = DKL(P,U)/log(N) [28]
The Mean Vector Length Modulation Index (MVL-MI) computes the modulus of the average complex-valued time series where each sample point has a modulus of the high-frequency amplitude and a phase of the low-frequency phase [1]. Other approaches include the phase-locking value (PLV), envelope-to-signal correlation (ESC), and general linear model (GLM) measures [1] [32].
Table 2: Comparison of Primary Phase-Amplitude Coupling Measures
| Measure | Key Principle | Advantages | Limitations |
|---|---|---|---|
| KL Modulation Index (KL-MI) | Deviation from uniform phase-amplitude distribution [28] | Sensitive to various modulation patterns, well-validated | Requires sufficient data for stable distribution |
| Mean Vector Length (MVL-MI) | Circular mean of amplitude-weighted phases [1] | Straightforward interpretation, computational efficiency | Sensitive to amplitude outliers |
| Phase-Locking Value (PLV) | Consistency of phase relationship between LF phase and HF amplitude phase [1] | Robust to amplitude variations | Requires filtering of amplitude envelope |
| Envelope-Signal Correlation (ESC) | Correlation between LF signal and HF amplitude [1] | Computationally simple | May detect spurious coupling due to non-sinusoidal waveforms |
| General Linear Model (GLM) | Linear modeling of amplitude by phase components [32] | Flexible, allows for covariate inclusion | More complex implementation |
Amplitude-Amplitude and Phase-Phase Coupling Measures
Amplitude-amplitude coupling is typically quantified using correlation coefficients between the amplitude envelopes of different frequency bands [1] [27]. This approach identifies when power fluctuations in distinct frequency ranges co-vary, potentially indicating coordinated activation of neural populations operating at different temporal scales.
Phase-phase coupling assessment involves accelerating the phase time series of both oscillations so their instantaneous frequencies match, then evaluating the constancy of their phase difference [29]. The concentration of the phase difference distribution (Δφnm(t) = n×φB(t) - m×φA(t)) is measured using the length of the mean resultant vector (Rn:m), which ranges from 0 (no coupling) to 1 (perfect phase locking) [29]. However, recent evidence suggests that proper statistical controls are essential for PPC analysis, as filtering artifacts and non-sinusoidal waveforms can produce spurious coupling [29].
Emerging Methodological Approaches
State space methods represent a novel approach that addresses limitations of traditional filtering-based PAC analysis [25]. This method uses state space oscillator models to separate oscillatory components, avoiding the need for traditional bandpass filtering and the associated introduction of spurious transients [25]. The approach employs a parametric representation of PAC based on an amplitude modulation model:
Af(t) = A0[1 + Kmodcos(φs(t)-φmod)] + εt
where Kmod represents modulation strength and φmod the preferred phase [25]. This formulation improves statistical efficiency and enables formal statistical inference with credible intervals, addressing major limitations of conventional methods [25].
Experimental Protocols and Methodological Considerations
Standard Protocol for Phase-Amplitude Coupling Analysis
A detailed protocol for PAC analysis in local field potentials provides a standardized approach applicable to various electrophysiological signals, including EEG and ECoG [26] [33]. The procedure consists of the following key stages:
Data Preparation and Preprocessing
- Identify experimental setup, sampling frequency, and trial structure specific to the dataset [26]
- Load raw data and remove trials with high-amplitude artifacts (e.g., signals deviating >3 standard deviations from the median) [26]
- Eliminate power line interference using appropriate notch filtering
- Normalize signals as needed to ensure comparability across trials and conditions
Time-Frequency Decomposition and PAC Computation
- Filter data at phase and amplitude frequencies of interest using zero-phase shift filters to prevent artifactual phase distortions [26]
- Extract phase and amplitude time series using the Hilbert transform
- Compute preferred PAC metric (e.g., Modulation Index) by assessing the relationship between low-frequency phase and high-frequency amplitude [26]
- Generate comodulograms to visualize coupling strength across multiple frequency pairs
Statistical Normalization and Validation
- Normalize results using surrogate data methods (e.g., phase-shifting or block permutation approaches) to establish significance thresholds [26]
- Apply multiple comparison correction for whole-comodulogram analysis
- Validate findings with appropriate statistical tests comparing experimental conditions
Figure 1: Experimental workflow for phase-amplitude coupling analysis
Methodological Pitfalls and Validation Strategies
CFC analysis presents several methodological challenges that require careful consideration:
Filtering Artifacts: Traditional bandpass filtering can introduce spurious phase-amplitude and phase-phase coupling, particularly when analyzing white noise or signals with sharp transitions [29] [25]. Proper surrogate controls and state-space approaches that avoid traditional filtering can mitigate these issues [25].
Harmonic Coupling: Non-sinusoidal waveforms naturally contain harmonics that exhibit spurious CFC [29] [25]. Distinguishing true cross-frequency interactions from harmonic relationships requires specialized approaches, such as examining multiple frequency pairs or using methods robust to waveform shape [25].
Statistical Validation: The absence of appropriate statistical controls represents a major concern in CFC analysis [29] [25]. Surrogate data methods (e.g., phase randomization, time-block permutation) provide essential empirical null distributions for determining statistical significance [26] [29].
Data Requirements: Conventional CFC methods typically require substantial data amounts for reliable estimation, limiting their applicability to dynamic or real-time scenarios [25]. State-space and parametric approaches offer improved statistical efficiency for time-varying scenarios [25].
Applications in Research and Clinical Contexts
CFC analysis has demonstrated significant utility across basic cognitive neuroscience and clinical applications. In epilepsy research, PAC has emerged as a valuable biomarker for identifying the seizure onset zone and predicting seizure occurrence [27]. Studies have successfully employed PAC measures combined with machine learning classifiers to detect pre-seizure states with high accuracy, potentially enabling therapeutic interventions [27].
In cognitive neuroscience, task-dependent CFC changes reflect dynamic coordination of neural processing across spatial and temporal scales [30] [1] [31]. For example, reinforced theta coupling during target tone perception in auditory oddball tasks reveals the role of CFC in brain network communication during sensory processing [30]. Similarly, alpha-gamma PAC in premotor cortex during motor planning phases illustrates how CFC may temporally organize local circuit activity in relation to behavioral demands [31].
The Researcher's Toolkit
Table 3: Essential Resources for CFC Research
| Resource Category | Specific Tools & Functions | Application Context |
|---|---|---|
| Programming Environments | MATLAB, Python with specialized toolboxes (e.g., TensorPAC) [31] | Signal processing, CFC metric implementation, statistical analysis |
| Data Acquisition Systems | High-density EEG systems (256 channels), intracranical EEG (iEEG), ECoG platforms [30] [27] | High-resolution spatial sampling, clinical epilepsy monitoring |
| Specialized Electrodes | Tungsten microelectrodes (1-4 MΩ impedance) for LFP [26] | Non-human primate research, rodent studies |
| Analysis Toolboxes | Custom PAC analysis code [26], State-space PAC methods [25] | Implementing standardized protocols, advanced methodological approaches |
| Statistical Frameworks | Surrogate data generation methods, multiple comparison corrections [26] [29] | Significance testing, control for false positives |
The quantitative analysis of cross-frequency coupling provides powerful insights into the multi-scale coordination of neural activity underlying cognitive function and its disruption in neurological disorders. While phase-amplitude coupling has received the most extensive validation and application, all CFC types offer complementary perspectives on neural network dynamics. Emerging methodological approaches, particularly state-space models, address critical limitations of traditional filtering-based methods, enhancing statistical efficiency and reliability. As CFC metrics continue to evolve and standardize, they promise to further illuminate the complex temporal architecture of brain function and dysfunction, with growing applications in basic neuroscience, translational research, and clinical practice.
Cross-frequency coupling (CFC) represents a fundamental mechanism for neural coordination across different spatiotemporal scales in the brain. The most extensively studied form, phase-amplitude coupling (PAC), occurs when the phase of a lower frequency rhythm modulates the amplitude of a higher frequency oscillation [34] [22]. This phenomenon allows efficient control of communication and information transfer between brain regions and has been observed under various physiological and pathological conditions, including memory tasks, cognitive processing, and disorders of consciousness [34] [35]. In the context of electroencephalogram (EEG) signal analysis, accurately quantifying CFC has proven challenging due to its non-linear nature and the potential confounding effects of other signal properties, such as low-frequency amplitude [22].
Advanced analytical approaches have emerged to address these challenges, moving beyond traditional CFC measures like the Modulation Index (MI) and Phase-Locking Value (PLV). This guide focuses on two sophisticated frameworks: Linear Parameter Varying Autoregressive (LPV-AR) Models and Generalized Linear Model (GLM) frameworks. These methods provide a more robust, statistically rigorous foundation for identifying and quantifying CFC in neural data, offering significant advantages for basic neuroscience research and applied clinical domains, including drug development and brain-computer interfaces (BCIs) [34] [22].
Theoretical Foundations of LPV-AR Models for CFC
From AR to LPV-AR Models
The LPV-AR model is an extension of the classical autoregressive (AR) model. In a standard AR model, a signal of interest ( y(n) ) is expressed as a linear combination of its past values plus a noise term [34] [36]: [ y(n) = \sum{k=1}^{p} ak y(n-k) + \varepsilon(n) ] where ( p ) is the model order, ( a_k ) are the AR coefficients, and ( \varepsilon(n) ) is a zero-mean white noise vector.
The LPV-AR model introduces a crucial modification: the coefficients ( ak ) are dynamically modulated by an external, time-varying scheduling signal ( s(n) ) [34] [36]: [ y(n) = \sum{k=1}^{p} ak(sn) y(n-k) + \varepsilon(n) ] This key innovation allows the model to capture non-linear dynamics and interactions, which are inherent to the CFC phenomenon, while remaining linear in the parameters for identification purposes.
Model Identification and Estimation
The LPV-AR model is identified by expressing the coefficient functions ( ak(sn) ) as a linear combination of known fixed basis functions. A polynomial basis is often selected for its simplicity, requiring only the selection of a polynomial order ( q ) [34] [36]: [ ak(sn) = \thetak^T \Psik(sn) = \theta{k0} + \sum{i=1}^{q} \theta{ki} \psi{ki}(sn), \quad k=1:p ] With this parameterization, the model can be rewritten in a linear regression form: [ y(n) = w^T \varphi(n) + \varepsilon(n) ] where ( w ) is a vector containing all unknown parameters ( \theta{ki} ), and ( \varphi(n) ) is the extended regressor vector that incorporates interactions between the signal ( y(n-k) ) and the scheduling variable ( sn ).
The unknown coefficients ( w ) can then be estimated using standard Least Squares (LS) or Regularized Least Squares (RLS) approaches, providing closed-form solutions to this otherwise non-linear problem [34] [36]: [ w{LS} = (\Phi^T \Phi)^{-1} \Phi^T y ] [ w{RLS} = (\Phi^T \Phi + \lambda I)^{-1} \Phi^T y ] where ( \Phi ) is the matrix of concatenated regressors and ( \lambda ) is a regularization parameter that helps prevent overfitting.
Application to CFC Quantification
To quantify CFC between the phase of a low-frequency rhythm (band L) and the amplitude of a high-frequency rhythm (band H), the LPV-AR framework is applied as follows [34]:
- Signal Preprocessing: The raw EEG signal ( x ) is band-pass filtered in the low-frequency (L) and high-frequency (H) bands of interest.
- Instantaneous Amplitude and Phase Extraction: The Hilbert transform is applied to the filtered signals to extract the instantaneous phase ( \phi{low}(n) ) of the low-frequency component and the instantaneous amplitude ( A{high}(n) ) of the high-frequency component.
- LPV-AR Modeling: The instantaneous low-frequency phase ( \phi{low}(n) ) is used as the scheduling variable ( s(n) ) to modulate the AR model coefficients fitted to the instantaneous high-frequency amplitude ( A{high}(n) ).
- CFC Strength Assessment: The strength of CFC is inferred from the estimated model parameters ( w ), which capture how the power spectrum of the high-frequency amplitude varies as a function of the low-frequency phase.
Table 1: Key Advantages of LPV-AR for CFC Estimation
| Advantage | Technical Explanation | Benefit for CFC Research |
|---|---|---|
| Captures Non-Linearity | Models coefficient variation via scheduling signal, unlike static AR models. | Effectively quantifies the non-linear nature of neural cross-frequency interactions. |
| Linear in Parameters | Despite modeling non-linear dynamics, it allows Least Squares estimation. | Enables computationally efficient, closed-form solutions without complex optimization. |
| Models Time-Varying Spectra | Scheduling signal modulates AR coefficients, which describe the signal spectrum. | Directly models how high-frequency amplitude dynamics change with low-frequency phase. |
Statistical Frameworks for Robust CFC Assessment
A Generalized Linear Model (GLM) Framework
A complementary advanced approach involves using a Generalized Linear Model (GLM) framework to assess CFC. This method models the high-frequency amplitude ( A{high} ) as a function of both the low-frequency phase ( \phi{low} ) and the low-frequency amplitude ( A_{low} ) [22]. This is a critical advancement, as it controls for potential confounding effects where changes in low-frequency power could artificially inflate measures of phase-amplitude coupling.
The general model form is [22]: [ A{high} \mid \phi{low}, A{low} \sim \text{Gamma}(\mu, \nu) ] [ \log \mu = \sum{k=1}^{n} \betak fk(\phi{low}) + \gamma A{low} ] Here, the conditional mean of ( A{high} ) is modeled using a spline basis for the low-frequency phase ( \phi{low} ) to capture its potentially non-linear influence, while simultaneously including the low-frequency amplitude ( A_{low} ) as a linear covariate. The Gamma distribution is chosen as it appropriately models positive-valued amplitude data.
Model Comparisons and Inference
The GLM framework enables formal statistical comparisons between nested models to test specific hypotheses about CFC [22]:
- The ( \phi{low} ) Model: Tests for the presence of PAC by modeling ( A{high} ) as a function of ( \phi_{low} ) only.
- The ( A{low} ) Model: Tests for the presence of amplitude-amplitude coupling (AAC) by modeling ( A{high} ) as a function of ( A_{low} ) only.
- The Full Model: Includes both ( \phi{low} ) and ( A{low} ) as predictors, allowing researchers to determine whether PAC exists after accounting for AAC.
The significance of specific CFC types is assessed by comparing the goodness-of-fit of these models using techniques like likelihood ratio tests. This provides a principled, inference-based method for identifying CFC, moving beyond simple descriptive measures.
Table 2: Comparison of Advanced CFC Analysis Methods
| Feature | LPV-AR Model | GLM Framework |
|---|---|---|
| Core Principle | Autoregressive model with coefficients modulated by low-frequency phase. | Regression of high-frequency amplitude on low-frequency phase and amplitude. |
| Primary CFC Type | Phase-Amplitude Coupling (PAC). | PAC and Amplitude-Amplitude Coupling (AAC). |
| Handles Confounds | Implicit in the model structure. | Explicitly controls for low-frequency amplitude. |
| Statistical Inference | Based on estimated model parameters. | Formal model comparison (e.g., likelihood ratio tests). |
| Key Advantage | Models time-varying spectral dynamics; closed-form solution. | Provides a unified framework for testing multiple CFC types and confounds. |
Experimental Protocols and Methodologies
Protocol 1: Validating CFC Measures with Synthetic Data
Synthetic data generation is crucial for validating and comparing the performance of CFC measures against a known ground truth.
Detailed Methodology [34]:
- Signal Generation: Create a simulated signal ( x(n) ) that embodies a specific CFC relationship. A common model is: ( x(n) = \sin(2\pi f{low} n + \phi) + [1 + \alpha \cos(2\pi f{low} n + \phi)] \cdot \eta{high}(n) ) where ( f{low} ) is the low-frequency oscillator, ( \eta_{high}(n) ) is a high-frequency carrier signal (often a filtered noise process), and ( \alpha ) controls the coupling strength.
- Parameter Variation: Systematically vary key parameters such as the signal-to-noise ratio (SNR), the coupling strength ( \alpha ), and the specific frequency bands involved (( f{low} ), ( f{high} )).
- Method Application: Apply the LPV-AR, GLM, and other traditional methods (e.g., MI, MVL) to the synthetic signals.
- Performance Quantification: Assess each method's performance by calculating metrics like the bias and variance of the estimated CFC strength compared to the true value, as well as the false positive rate in the absence of true coupling.
Protocol 2: Assessing CFC in Movement Attempts from SCI Patients
This protocol outlines the application of LPV-AR based CFC to real EEG data from spinal cord injured (SCI) participants during movement attempts, relevant for BCI development.
Detailed Methodology [34] [36]:
- Participant Preparation and EEG Acquisition: Record EEG data from SCI participants using a multi-channel EEG system (e.g., 32-channel setup per the international 10-20 system). Participants are instructed to attempt specific hand or arm movements in response to visual or auditory cues.
- Preprocessing:
- Filter the raw EEG data (e.g., 1-100 Hz) and apply a notch filter to remove line noise.
- Remove artifacts (e.g., ocular, muscular) using techniques like Independent Component Analysis (ICA).
- Segment the data into epochs time-locked to the movement attempt cue.
- CFC Estimation via LPV-AR:
- For each channel and trial, band-pass filter the data into a low-frequency band (e.g., theta, 4-8 Hz) and a high-frequency band (e.g., beta, 15-30 Hz).
- Extract the phase of the low-frequency signal ( \phi{low}(n) ) and the amplitude envelope of the high-frequency signal ( A{high}(n) ) using the Hilbert transform.
- Fit the LPV-AR model to ( A{high}(n) ) using ( \phi{low}(n) ) as the scheduling variable. The model order ( p ) and polynomial order ( q ) are typically determined via cross-validation or information criteria (e.g., AIC, BIC).
- The magnitude of the estimated parameters ( w ) related to the scheduling variable quantifies the CFC strength.
- Statistical Analysis and Decoding:
- Compare CFC strengths between movement attempt conditions and rest using non-parametric statistical tests (e.g., cluster-based permutation tests).
- Use CFC features as input to a machine learning classifier (e.g., Linear Discriminant Analysis, Support Vector Machine) to decode the movement intention.
Protocol 3: Analyzing CFC in Disorders of Consciousness
This protocol employs the GLM framework to investigate CFC alterations during cognitive tasks in patients with disorders of consciousness (DOC).
Detailed Methodology [35] [22]:
- Patient Groups and Paradigm: Recruit DOC patients (e.g., Unresponsive Wakefulness Syndrome - UWS, Minimally Conscious State - MCS) and healthy controls (HC). Conduct an auditory oddball paradigm where a sequence of standard tones is interspersed with rare, deviant tones.
- EEG Recording and Preprocessing: Record continuous EEG during the paradigm. Preprocess data (filtering, artifact removal) and segment into epochs around stimulus presentations.
- CFC Analysis using GLM:
- For each trial and channel, band-pass filter the data into multiple low-frequency (phase: 1-31 Hz) and high-frequency (amplitude: 8-77 Hz) bands.
- Extract ( \phi{low}(n) ), ( A{low}(n) ), and ( A_{high}(n) ).
- Fit the full GLM (including both phase and amplitude predictors) and the nested models to the amplitude data.
- Use a model comparison approach (e.g., likelihood ratio test) to quantify the significant PAC for each frequency pair, creating a comodulogram.
- Group Comparison: Identify the dominant CFC patterns (e.g., delta-gamma coupling). Compare the strength and peak frequency of this coupling between groups (HC, MCS, UWS) using non-parametric permutation tests and bootstrap confidence intervals to assess statistical significance.
Visualization of Analytical Workflows
The following diagrams, generated using Graphviz, illustrate the core logical and methodological workflows for the advanced CFC analysis techniques described in this guide.
LPV-AR CFC Analysis Workflow
GLM Framework for CFC Inference
The Scientist's Toolkit: Essential Research Reagents and Materials
Table 3: Essential Tools and Solutions for CFC Research
| Item / Solution | Function / Purpose | Technical Notes |
|---|---|---|
| Multi-channel EEG System | Records electrical brain activity from the scalp. | Systems with 32+ channels (e.g., EMOTIV) using the 10-20 placement are common. Critical for spatial analysis [37]. |
| Intracranial EEG (iEEG) | Records brain activity with high spatial resolution and signal quality directly from the cortex. | Used in epilepsy monitoring and deep brain structures. Essential for studying high-frequency oscillations [38]. |
| Band-pass / Least-squares FIR Filters | Isolate specific frequency bands of interest for CFC analysis. | Filter order and type (e.g., order 375 for high-frequencies) must be chosen carefully to avoid artifacts [22]. |
| Hilbert Transform Algorithm | Calculates the instantaneous phase and amplitude envelope of band-pass filtered signals. | Found in numerical computing libraries (e.g., SciPy, MATLAB). Fundamental for all CFC measures [34] [22]. |
| LPV-AR Estimation Code | Implements the Least Squares fitting of the LPV-AR model. | Requires custom implementation in Python, R, or MATLAB. Key parameters: model order p, polynomial order q [34] [36]. |
| GLM Fitting Library | Fits Generalized Linear Models (e.g., with Gamma distribution) for statistical CFC testing. | Available in statsmodels (Python), glm (R). Uses spline basis for phase variable [22]. |
| Generative Adversarial Network (GAN) | Generates synthetic EEG data for method validation and augmenting training datasets. | Used to create realistic, labeled data for testing CFC measures and training BCIs [37]. |
Integrating CFC with Graph Theory for Brain Network Analysis
The human brain is a complex, multi-scale system whose intricate functions are governed by synchronized neural oscillations across different frequency bands. Cross-frequency coupling (CFC) has emerged as a crucial mechanism for understanding how these different oscillatory rhythms interact to support cognitive processes and how these interactions are disrupted in neurological and psychiatric disorders. CFC refers to the statistical dependencies or interactions between neural activities in different frequency bands, with phase-amplitude coupling (PAC) being the most widely studied form, where the phase of a low-frequency oscillation modulates the amplitude of a higher-frequency oscillation [2] [3]. Simultaneously, graph theory provides a mathematical framework for modeling the brain as a network of interconnected elements, enabling researchers to quantify the topological architecture of brain connectivity and identify central hubs, modules, and information flow pathways [39] [40]. The integration of CFC with graph theory represents a powerful analytical paradigm that captures both the multi-scale oscillatory dynamics and the higher-order topological organization of the brain, offering unprecedented insights into the neural mechanisms underlying cognition and disease [41] [42].
The fundamental premise for integrating these approaches lies in their complementary strengths: CFC quantifies complex interactions between different neural oscillatory frequencies, while graph theory provides tools to model these interactions as complex networks and characterize their global and local organizational properties. This integration has proven particularly valuable in electroencephalogram (EEG) research, where high temporal resolution enables the detection of transient coupling phenomena that might be missed by other neuroimaging modalities [43] [41]. As research in this field advances, it has become increasingly clear that many brain functions rely on precisely coordinated cross-frequency interactions, and that disruptions in these interactions may underlie various neuropsychiatric conditions including depression, epilepsy, and stroke-related cognitive impairments [2] [41] [44].
Methodological Framework
Cross-Frequency Coupling Methods
CFC analysis begins with preprocessed EEG data that has been cleaned of artifacts and segmented into appropriate epochs for analysis. The most common computational approaches for quantifying CFC include:
Phase-Amplitude Coupling (PAC): This method examines how the phase of a low-frequency oscillation modulates the amplitude of a high-frequency oscillation. The computational pipeline involves bandpass filtering the signal in both frequency ranges of interest, extracting the phase time series from the low-frequency component using the Hilbert transform, extracting the amplitude envelope from the high-frequency component, and then calculating a modulation index (MI) to quantify the strength of coupling [2] [3]. A Bayesian framework for PAC has been developed to add robustness through priors and spatial dependencies, which is particularly useful for detecting subtle coupling differences in clinical populations [3].
Phase-Phase Coupling (PPC): Also known as n:m phase synchronization, this approach measures the synchronization between phases of oscillations in different frequency bands. The phase synchronization index (PSI) is commonly used to quantify PPC by examining the stability of phase differences across time [43] [44].
Amplitude-Amplitude Coupling (AAC): This method assesses correlations between amplitude envelopes of different frequency bands, reflecting co-modulation of rhythmic activities without direct phase relationships [41].
After calculating CFC metrics for all channel pairs and frequency combinations, the results are typically organized into CFC matrices that represent the strength of coupling between different frequency bands across brain regions. These matrices serve as the foundation for subsequent graph theory analysis.
Graph Theory Construction from CFC Metrics
To transform CFC matrices into brain networks for graph analysis, researchers must define nodes and edges based on the CFC measurements:
Node Definition: Nodes typically represent EEG electrodes or source-localized brain regions. The choice of node definition significantly influences network topology, with common approaches including standard electrode positioning systems (e.g., 10-20 system) or parcellation schemes derived from anatomical atlases [39] [40].
Edge Definition: Edges represent the CFC strength between nodes, which can be determined through various approaches:
The resulting CFC-based brain networks can be represented as adjacency matrices, which then serve as input for graph theoretical analysis. These networks can be analyzed as weighted or binary, directed or undirected graphs, depending on the research question and methodological considerations [39] [41].
Key Graph Theory Metrics for CFC Networks
Once brain networks are constructed from CFC data, various graph metrics can be computed to characterize network topology:
Global Metrics:
- Characteristic path length: The average shortest path length between all node pairs, reflecting overall integration efficiency.
- Clustering coefficient: The degree to which nodes tend to cluster together, indicating network segregation.
- Small-worldness: A balance between high clustering and short path length, considered optimal for information processing [39] [40] [42].
Nodal Metrics:
- Degree/Strength: The number or strength of connections incident to a node.
- Betweenness centrality: The fraction of shortest paths passing through a node, identifying hub regions.
- K-coreness: A measure of node centrality based on recursive pruning of peripheral nodes [41].
Modularity: The extent to which a network can be subdivided into clearly delimited groups of nodes (modules) with strong internal connections and weaker external connections [39].
Each metric provides unique insights into brain network organization and can be compared between clinical groups or correlated with behavioral measures to establish structure-function relationships.
Experimental Protocols and Applications
Protocol 1: Resting-State EEG in Major Depressive Disorder
Study Objective: To identify EEG-based biomarkers for diagnosing depression severity using CFC and graph theory [41].
Participant Characteristics:
- 37 subjects (15 healthy, 10 moderately depressed, 12 severely depressed)
- Resting-state EEG recordings
Methodological Pipeline:
- EEG Acquisition: Resting-state EEG signals recorded according to standard protocols
- CFC Calculation: Phase-amplitude coupling between low-alpha and low-gamma bands computed
- Network Construction: Functional networks built from CFC metrics
- Graph Analysis: Degree and K-coreness centrality measures calculated across regions
- Statistical Analysis & Classification: Group comparisons and SVM classification with feature selection
Key Findings: The study revealed that depression affects the entire cerebral cortex, especially frontal and occipital regions. Degree and K-coreness centrality showed statistically significant differences in almost all regions. The SVM classifier achieved 94.25% accuracy using 4 selected features derived from CFC between the low α and low γ bands [41].
Protocol 2: Cognitive Biotype of Depression
Study Objective: To investigate alterations in cross-frequency coupling between low-frequency and gamma oscillations in the cognitive biotype of depression [2].
Participant Characteristics:
- 141 depressed patients in remission (56 cognitive biotype, 85 non-cognitive impairment)
- Cognitive assessment using MATRICS Consensus Cognitive Battery (MCCB)
Methodological Pipeline:
- Cognitive Assessment: Participants classified using MCCB cognitive battery
- EEG Recording: 5-minute resting-state EEG under eyes-closed and eyes-opened conditions
- Signal Processing: Band-pass filtering (1-90 Hz), artifact removal, independent component analysis
- PAC Analysis: Modulation index calculated for phase-amplitude coupling between low-frequency (delta, theta, alpha, beta) and gamma oscillations
- Statistical Analysis: Group comparisons with false discovery rate correction
Key Findings: The cognitive biotype showed decreased PAC values between theta/alpha/beta and low gamma oscillations in parietal regions during eyes-closed state. Conversely, delta-gamma coupling was increased in the cognitive biotype. These alterations were significantly correlated with cognitive performance, suggesting potential biomarkers for precision psychiatry [2].
Protocol 3: Post-Stroke Mental Rotation Task
Study Objective: To evaluate stroke impact using multi-granularity analysis of brain networks assembled with intra-frequency and cross-frequency phase coupling [43].
Participant Characteristics:
- 11 patients with left ischemic stroke
- 11 healthy controls of similar age
- Mental rotation task with hand visual stimuli
Methodological Pipeline:
- Task Paradigm: Mental rotation task with left/right hand decision
- EEG Recording: 30-channel EEG during task performance
- Data Preprocessing: Filtering (0.01-30 Hz), artifact removal, epoching
- CFC Analysis: Phase-phase coupling in delta-alpha, delta-low beta, delta-high beta bands
- Multi-Granularity Analysis: Spatial (whole-brain, hemispheric, channel-pair) and temporal (entire task, sub-stages) analysis
Key Findings: Brain information interaction was highly affected after stroke, especially in delta-related cross-frequency bands. The non-lesion hemisphere of stroke patients also showed significant alterations in delta-alpha coupling. Graph theory analysis revealed that stroke patients' brain networks had longer characteristic path length and smaller clustering coefficient [43].
Protocol 4: Temporal Lobe Epilepsy
Study Objective: To investigate cross-frequency coupling and functional brain networks in temporal lobe epilepsy patients during interictal period [44].
Participant Characteristics:
- 20 patients with right temporal lobe epilepsy
- 18 normal controls
Methodological Pipeline:
- EEG Recording: 15-minute resting-state EEG with eyes closed
- Phase Extraction: Complex Morlet wavelet transform to compute instantaneous phase in delta, theta, alpha, and beta bands
- Synchronization Analysis: Phase synchronization index for within-frequency and cross-frequency coupling
- Network Construction: Functional brain networks from WFC and CFC metrics
- Graph Analysis: Small-world properties and efficiency metrics
Key Findings: Epilepsy patients exhibited stronger within-frequency coupling in theta and beta bands, and altered cross-frequency coupling in delta-alpha and theta-alpha band pairs. The CFC networks showed enhanced small-world efficiency in delta-alpha and theta-alpha pairs, but weakened between alpha and beta bands, suggesting a shift in the optimal operating point in the epileptic brain [44].
Comparative Analysis of CFC-Graph Theory Findings
Table 1: Summary of Key Findings Across Different Neurological Conditions
| Condition | CFC Alterations | Graph Theory Findings | Clinical Applications |
|---|---|---|---|
| Major Depressive Disorder | Decreased PAC between low-alpha and low-gamma bands [41] | Reduced degree and K-coreness centrality, especially in frontal regions [41] | 94.25% classification accuracy for depression severity [41] |
| Cognitive Biotype of Depression | Theta/alpha/beta-gamma PAC decreased; delta-gamma PAC increased in parietal regions [2] | Correlation between PAC values and cognitive performance [2] | Potential biomarker for cognitive impairment in depression [2] |
| Post-Stroke | Altered delta-alpha, delta-beta phase-phase coupling [43] | Longer path length, smaller clustering coefficient [43] | Identification of non-lesion hemisphere impairment [43] |
| Temporal Lobe Epilepsy | Enhanced delta-alpha, theta-alpha CFC; weakened alpha-beta CFC [44] | Altered small-world efficiency in CFC networks [44] | Understanding pathological network reorganization [44] |
Table 2: Common Graph Theory Metrics and Their Interpretations in CFC Studies
| Graph Metric | Computational Definition | Neurobiological Interpretation | Alterations in Disease |
|---|---|---|---|
| Degree/Strength | Number/strength of connections incident to a node [39] | Regional importance or connectivity density | Decreased in MDD frontal regions [41] |
| Clustering Coefficient | Measure of local interconnectedness [39] [40] | Specialized information processing within communities | Decreased in stroke patients [43] |
| Characteristic Path Length | Average shortest path between node pairs [39] [40] | Global integration efficiency | Increased in stroke [43]; decreased in epilepsy [44] |
| Small-Worldness | Balance between segregation and integration [39] [42] | Optimal network organization | Shifted in epilepsy [44] |
| K-coreness | Node centrality based on recursive pruning [41] | Resilience and hierarchical organization | Significant differences in MDD [41] |
Essential Research Reagents and Tools
Table 3: Research Reagent Solutions for CFC-Graph Theory Studies
| Item Category | Specific Examples | Function/Application | Implementation Notes |
|---|---|---|---|
| EEG Acquisition Systems | Nihon Kohden system [44], Brain Vision Recorder [43], DSI-24 [2] | Signal recording with high temporal resolution | 19-30 electrodes typically used; sampling rates 200-1000 Hz [2] [43] [44] |
| Signal Processing Tools | EEGLAB [2], MATLAB with custom scripts [41] | Preprocessing, filtering, artifact removal | Band-pass filtering typically 0.5-70 Hz; ICA for artifact removal [2] [44] |
| CFC Analysis Packages | Custom PAC algorithms [2] [3], Bayesian PAC framework [3], Phase Synchronization Index [43] | Quantifying cross-frequency interactions | Hilbert transform for phase/amplitude extraction [2]; surrogate data for significance testing [2] |
| Graph Theory Software | Brain Connectivity Toolbox, custom MATLAB scripts [41], eLORETA [42] | Network construction and metric calculation | Weighted or binary networks; consideration of thresholding approaches [39] [41] |
| Statistical Analysis Platforms | SPSS [2], SVM classifiers [41] | Group comparisons, classification | FDR correction for multiple comparisons [2]; cross-validation for machine learning [41] |
Analytical Workflow Visualization
The following diagram illustrates the comprehensive analytical pipeline for integrating CFC with graph theory in brain network analysis:
Analytical Pipeline for CFC-Graph Theory Integration
The integration of cross-frequency coupling with graph theory represents a paradigm shift in how researchers analyze and interpret complex brain network dynamics. This powerful combination allows for multi-scale investigation of neural interactions, capturing both the fine-grained oscillatory coordination through CFC and the higher-order topological organization through graph theory. The consistent findings across multiple neurological and psychiatric conditions demonstrate the robustness and clinical relevance of this approach, particularly in identifying novel biomarkers for diagnosis, monitoring treatment response, and understanding pathophysiological mechanisms [2] [41] [44].
Future methodological developments will likely focus on dynamic network analysis techniques that can track temporal changes in CFC-based brain networks, potentially revealing how cross-frequency interactions evolve during cognitive tasks or how they are altered in different disease states [39] [42]. Additionally, the application of advanced machine learning algorithms to CFC-graph theory features shows promising for developing automated diagnostic tools with high classification accuracy, as demonstrated by the 94.25% accuracy achieved in depression severity classification [41]. The development of standardized analytical pipelines and open-source toolboxes will be crucial for promoting reproducibility and facilitating wider adoption of these methods across research laboratories and clinical settings.
As the field advances, the integration of CFC with graph theory is poised to make significant contributions to personalized medicine approaches in neurology and psychiatry, potentially guiding treatment selection based on individual-specific network alterations and providing objective neurophysiological markers for monitoring therapeutic interventions.
Cross-frequency coupling (CFC) has emerged as a crucial neural mechanism for understanding the pathophysiology of neuropsychiatric disorders. This electrophysiological phenomenon, which represents the interaction between distinct neural oscillation frequencies, provides a window into the brain's hierarchical information processing. Within the framework of precision psychiatry, CFC analysis offers a potent methodology for deconstructing the biological heterogeneity of conditions like major depressive disorder (MDD) and related cognitive impairments [45]. This technical guide synthesizes current research on CFC alterations, with particular focus on the cognitive biotype of depression, and provides detailed methodologies for researchers investigating these neural signatures. The accumulating evidence positions CFC not merely as a correlate of cognitive dysfunction but as a potential biomarker for patient stratification and treatment development in neuropsychiatric disorders [2] [45] [46].
CFC Alterations in the Cognitive Biotype of Depression
Parietal Lobe Dysregulation in Cognitive Biotype
Recent research has identified a specific cognitive biotype of depression characterized by prominent cognitive dysfunction with distinct neural correlates. A comprehensive study of 141 depressed patients in remission, classified using the MATRICS Consensus Cognitive Battery (MCCB), revealed significant alterations in phase-amplitude coupling (PAC) between low-frequency oscillations and gamma activity in this subgroup [2] [47].
Table 1: Specific CFC Alterations in Cognitive Biotype of Depression (Eyes-Closed State)
| Low-Frequency Band | Electrode | Statistical Values | Direction of Change | Gamma Sub-band |
|---|---|---|---|---|
| Theta | Pz | t = -3.512, p = 0.011* | Decreased | Low gamma |
| Alpha | P3 | t = -3.377, p = 0.009* | Decreased | Low gamma |
| Alpha | Pz | t = -3.451, p = 0.009* | Decreased | Low gamma |
| Beta | P3 | t = -3.129, p = 0.020* | Decreased | Low gamma |
| Beta | Pz | t = -3.333, p = 0.020* | Decreased | Low gamma |
| Delta | P4 | t = 3.314, p = 0.022* | Increased | Gamma |
*FDR-corrected p-values [2]
The findings demonstrate a consistent pattern of decreased PAC between theta, alpha, and beta oscillations with low-gamma activity in parietal regions, particularly at Pz and P3 electrodes [2]. Conversely, delta-gamma coupling showed increased values in the right parietal region (P4) [2]. These alterations were observed exclusively during the eyes-closed resting state, with no significant differences detected during eyes-open conditions [2] [47]. Furthermore, significant correlations were identified between cognitive function and CFC measures at the eyes-closed state, reinforcing the functional relevance of these oscillatory interactions [2].
Relationship to Gamma Power Abnormalities
Complementary research has identified corresponding reductions in gamma power within the same cognitive biotype population. In the eyes-closed condition, the cognitive impairment (CI) biotype showed decreased low-gamma power at the P3 channel (t = -3.267, FDR = 0.026) [48]. Correlation analyses revealed that low-gamma oscillation was correlated with working memory (r = 0.205, P = 0.015), while in the eyes-open condition, both low- and high-gamma oscillations correlated with social cognition (r = -0.175, P = 0.038; r = -0.241, P = 0.004) [48]. These parallel findings in both gamma power and CFC underscore the fundamental nature of gamma rhythm disruption in cognitive impairment associated with depression.
CFC as a Biomarker for Depression Severity Assessment
Multi-modal CFC Analysis for Severity Scaling
Beyond biotype characterization, CFC metrics show considerable promise for assessing depression severity. A systematic investigation evaluated four distinct CFC types—phase-amplitude coupling (PAC), phase-phase coupling (PPC), frequency-amplitude coupling (FAC), and frequency-frequency coupling (FFC)—for their utility in depression severity assessment [46].
Table 2: CFC-Based Classification Performance for Depression Severity
| CFC Type | Feature Description | Classifier | Accuracy |
|---|---|---|---|
| PPC | Maximum between electrodes in different regions | Decision Tree | 84.28% |
| Combined | Two most significant features | k-NN | 91.43% |
The study analyzed EEG data from 22 depressed patients (12 severely depressed, 10 moderately depressed) and 15 healthy participants across 19 channels [46]. Particularly valuable insights emerged from analyzing specific electrode pairs: temporal-central couplings in the Theta1-Gamma1 bands and occipital-central couplings in the Delta-Gamma1 bands provided critical information for assessing depression severity [46]. This multi-modal CFC approach demonstrates the potential for developing objective neurophysiological biomarkers that could complement clinical rating scales.
Regional Specificity of CFC Alterations in Depression
Spatial analysis of CFC alterations reveals distinct patterns across brain regions in depression. Research indicates that depression particularly affects communication in occipital, parietal, and temporal regions, reflecting the impact of the disorder on distributed brain networks [46]. Statistical analyses demonstrate significant changes in interhemispheric communication, with CFC serving as a sensitive measure of these network-level disruptions [46]. The pronounced CFC presence in frontal, temporal, and central areas, as identified by electrode-level analysis, further underscores the distributed nature of depression pathophysiology [46].
Experimental Protocols for CFC Research
EEG Data Acquisition and Preprocessing
Standardized protocols for EEG data acquisition and preprocessing are fundamental for reproducible CFC analysis. The following methodology, derived from current research practices, provides a robust framework for CFC investigation [2] [48]:
Equipment and Setup: 19-channel EEG systems configured according to the international 10-20 system, with recordings conducted in electromagnetically shielded chambers under controlled conditions [2]. Active electrodes with FPz as reference and left earlobe as ground are recommended [2].
Recording Parameters: Sampling rate of 300 Hz or higher (1000 Hz used in some studies) to adequately capture gamma oscillations [2] [49]. Electrode impedance should be maintained below 5 kΩ [49].
Experimental Conditions: Five-minute resting-state recordings under both eyes-open and eyes-closed conditions, as CFC alterations may be state-dependent [2] [48].
Preprocessing Pipeline:
- Band-pass filtering (1-90 Hz or 0.5-95 Hz) with notch filtering at 50 Hz (and 100 Hz if needed) to remove line noise [2] [49].
- Segmentation into 2-second epochs [2].
- Automated and manual artifact rejection (±100 μV threshold) [2] [49].
- Bad channel interpolation using spherical spline interpolation [2].
- Independent Component Analysis (ICA) for artifact removal (ocular, cardiac, muscle) [2] [49].
- Re-referencing to average reference [2].
CFC Computational Analysis Methods
The computational pipeline for CFC analysis involves several methodological steps to extract reliable coupling metrics:
Phase-Amplitude Coupling (PAC) Calculation:
- Bandpass filtering of continuous EEG data into low-frequency (1-29 Hz in 1 Hz steps) and gamma-frequency (30-45 Hz for low-gamma, 55-90 Hz for high-gamma) bands [2] [48].
- Hilbert transform application to extract instantaneous phase from low-frequency bands and amplitude envelope from gamma bands [2].
- Computation of Modulation Index (MI) using Kullback-Leibler divergence to quantify phase-amplitude relationships [2].
- Statistical validation using surrogate data approaches (z-scoring of MIs) to account for spurious coupling [2].
Multi-modal CFC Analysis: For comprehensive assessment, additional CFC measures can be computed:
Statistical Analysis and Multiple Comparisons Correction:
- Group comparisons using independent-sample t-tests or non-parametric equivalents for non-normal distributions [2] [46].
- False discovery rate (FDR) correction for multiple comparisons across electrodes and frequency pairs [2].
- Correlation analysis (Pearson or Spearman) between CFC metrics and cognitive/clinical measures [2].
The Scientist's Toolkit: Essential Research Reagents and Materials
Table 3: Essential Materials and Tools for CFC Research
| Item | Specification/Example | Primary Function |
|---|---|---|
| EEG Acquisition System | DSI-24 (Wearable Sensing); Neuracle; Brain Products | Multi-channel neural signal acquisition with appropriate sampling rates for gamma oscillations [2] [49]. |
| Electrode Caps | International 10-20 system placement | Standardized electrode positioning for reproducible recordings across studies [2] [49]. |
| Electromagnetic Shielding | Electromagnetically shielded chamber | Minimization of environmental noise interference during signal acquisition [2]. |
| Signal Processing Software | EEGLAB (MATLAB-based); Custom Python scripts | Data preprocessing, filtering, ICA, and CFC computation [2] [49]. |
| Cognitive Assessment Tools | MATRICS Consensus Cognitive Battery (MCCB) | Standardized cognitive profiling for biotype identification [2] [48]. |
| Clinical Rating Scales | HAM-D, BDI-II | Clinical assessment of depression severity for correlation with CFC metrics [46]. |
| Statistical Analysis Tools | SPSS; MATLAB; Python (scipy, statsmodels) | Statistical testing, multiple comparisons correction, and data visualization [2] [46]. |
Neurophysiological Mechanisms and Pathways
The alterations in CFC observed in depression and cognitive biotypes reflect disruptions in fundamental neural communication mechanisms. Gamma oscillations are generated through the interplay between pyramidal neurons and fast-spiking interneurons, particularly those expressing parvalbumin [48]. These high-frequency rhythms facilitate local information processing and are modulated by lower-frequency oscillations that coordinate long-range neural communication [2] [48].
Theta-gamma coupling supports working memory processes by organizing the timing of gamma bursts within theta cycles, creating a framework for multi-item maintenance [2]. Alpha-gamma coupling is thought to implement inhibitory control mechanisms that suppress irrelevant information during cognitive tasks [49]. In the cognitive biotype of depression, the observed reduction in theta/alpha/beta-gamma coupling in parietal regions may reflect impaired coordination between top-down control signals (carried by low-frequency oscillations) and local information processing (implemented by gamma rhythms) [2].
The parietal focus of these alterations is particularly significant, as this region serves as an integration hub for cognitive processes including attention, working memory, and executive function—domains frequently impaired in the cognitive biotype [2] [48]. The increased delta-gamma coupling observed in some patients may represent a compensatory mechanism or alternatively, a distinct pathophysiological process related to thalamocortical dysrhythmia [2].
CFC analysis represents a powerful methodology for deconstructing the neurophysiological underpinnings of depression and its cognitive biotype. The consistent findings of altered theta-gamma, alpha-gamma, and beta-gamma coupling in parietal regions provide compelling evidence for disrupted cross-frequency communication as a core mechanism underlying cognitive dysfunction in depression. The state-dependency of these effects (observed during eyes-closed but not eyes-open conditions) highlights the importance of experimental paradigm design in CFC research.
Future research directions should include:
- Longitudinal Studies: Tracking CFC changes throughout treatment to establish causal relationships between oscillatory alterations and clinical outcomes.
- Multi-modal Integration: Combining EEG with fMRI, MEG, and PET to spatialize CFC findings and link them to neurotransmitter systems.
- Intervention Development: Utilizing CFC biomarkers as targets for neuromodulation approaches including rTMS and neurofeedback [49].
- Standardization Efforts: Establishing consensus methodologies for CFC computation to enhance reproducibility across research sites.
- Drug Development Applications: Implementing CFC metrics as pharmacodynamic biomarkers in clinical trials to demonstrate target engagement and guide dose selection [45].
As the field moves toward precision psychiatry approaches, CFC biomarkers offer promising tools for patient stratification, treatment selection, and clinical trial enrichment in depression and related neuropsychiatric disorders [45]. The continued refinement of CFC analysis methodologies will enhance their utility in both basic research and clinical applications.
Cross-frequency coupling (CFC) represents a fundamental mechanism by which the brain coordinates complex cognitive processes through the interaction of distinct neural oscillations. In electroencephalography (EEG) research, CFC refers to the phenomenon where two or more different neuronal frequencies synchronize, enabling efficient spatiotemporal information transfer between distributed neuronal populations [50] [51]. This functional locking allows brain networks operating at various frequencies to work in concert, supporting higher-order functions that single oscillatory bands cannot achieve in isolation [50]. The primary forms of CFC include phase-amplitude coupling (PAC), where the amplitude of a higher frequency is modulated by the phase of a lower frequency, and amplitude-amplitude coupling (AAC), where the amplitudes of different frequencies correlate [50] [52]. These coupling mechanisms have been implicated in numerous brain functions, including working memory, sleep regulation, emotional processing, and conscious awareness [50] [13] [52].
The study of CFC provides a more nuanced understanding of brain network dynamics than traditional single-frequency analyses. Research has established that specific CFC patterns are associated with optimal cognitive performance and physiological brain states, while altered CFC is observed in various neurological and psychiatric conditions [50] [13]. For instance, the theta-gamma neural code, where gamma amplitude couples to theta phase, is considered crucial for working memory capacity, potentially determining how many items can be simultaneously maintained [52] [53]. Similarly, disruptions in delta-theta and theta-beta CFC have been correlated with impaired consciousness levels in patients with disorders of consciousness [13]. This foundational understanding of CFC's functional significance has driven interest in developing neuromodulation techniques capable of selectively targeting and modulating these cross-frequency interactions for both research and therapeutic purposes.
Technical Foundations of Neuromodulation Approaches
Transcranial Alternating Current Stimulation (tACS)
Transcranial Alternating Current Stimulation (tACS) is a non-invasive brain stimulation technique that applies low-intensity alternating currents through scalp electrodes to modulate ongoing brain oscillations [50] [52]. The primary mechanism of tACS is entrainment, whereby externally applied rhythmic currents synchronize with and enhance the phase alignment of endogenous neuronal oscillations [50]. This process results in increased amplitude and/or coherence of the targeted EEG frequency bands [50]. tACS exerts both immediate online effects during stimulation and long-lasting offline aftereffects, with the latter attributed to spike-timing-dependent plasticity mechanisms that reinforce the entrained patterns [50] [52].
The technical application of tACS requires careful consideration of several parameters. Electrode montage determines which brain networks are targeted, with multi-electrode setups enabling network-specific stimulation [53]. Stimulation frequency is typically selected to match endogenous rhythms (e.g., individual alpha peak) or to target specific cross-frequency interactions [52] [53]. Intensity generally ranges from 1-2 mA, balancing efficacy with sensory side effects [52]. Advanced tACS protocols have evolved beyond single-frequency stimulation to incorporate cross-frequency coupled patterns, such as delivering gamma bursts synchronized to the peaks of theta waves (theta-gamma peak-coupled tACS) to mimic natural neurophysiological interactions [52] [53].
Neurofeedback (NFB)
Neurofeedback (NFB) is a non-invasive neuromodulation approach based on operant conditioning principles, where individuals learn to self-regulate their brain activity [50] [51]. The NFB system operates through a closed-loop architecture consisting of four key stages: (1) Signal acquisition of EEG activity via scalp electrodes; (2) Feature extraction of target oscillatory components (e.g., alpha power); (3) Feature conversion into audible or visual feedback signals; and (4) Feedback learning where the brain associates reward signals with desired brain states [51]. Through repetitive practice, neural plasticity mechanisms enable increasingly precise volitional control over specific oscillatory patterns [50] [51].
Unlike the external driving force of tACS, NFB leverages the brain's inherent capacity for self-regulation, potentially leading to more naturalistic and individualized modulation of brain networks [50]. NFB protocols can target single frequencies (e.g., sensorimotor rhythm up-regulation) or more complex cross-frequency relationships by providing feedback based on coupling metrics such as phase-amplitude coupling [50]. The learning process in NFB depends on multiple factors including feedback modality, reward threshold setting, session frequency, and individual learning capacity [50] [51].
Experimental Protocols and Methodologies
Theta-Gamma Coupled tACS for Working Memory Enhancement
A sophisticated tACS approach for modulating cross-frequency coupling involves theta-gamma peak-coupled stimulation (TGCp-tACS) to enhance working memory performance. This protocol specifically targets the natural theta-gamma phase-amplitude coupling observed during cognitive control processes [52].
Table 1: TGCp-tACS Protocol Parameters for Working Memory Enhancement
| Parameter | Specification | Rationale |
|---|---|---|
| Stimulation Site | Left frontal cortex (F3) | Targeting working memory networks |
| Theta Frequency | ~6 Hz | Individualized to peak theta frequency |
| Gamma Frequency | 80-100 Hz | Aligns with natural high-gamma activity |
| Coupling Pattern | Gamma bursts at theta peaks | Mimics natural phase-amplitude coupling |
| Stimulation Intensity | 1-2 mA | Balance between efficacy and comfort |
| Session Duration | 20 minutes | Optimal plasticity induction |
| Electrode Montage | Central electrode at F3 with four return electrodes | Focal stimulation of target region |
The experimental workflow for TGCp-tACS studies typically follows a randomized, sham-controlled, crossover design [52]. Participants complete pre-stimulation resting-state EEG recordings (eyes-open and eyes-closed), followed by verum or sham stimulation during working memory task performance. Post-stimulation EEG recordings assess neurophysiological aftereffects. Behavioral assessment typically incorporates multiple working memory tasks targeting different components (e.g., phonological loop, visuospatial sketchpad) to comprehensively evaluate stimulation effects [52].
Network-Targeted Phase-Lagged tACS
Advanced tACS protocols have been developed to modulate interactions between large-scale brain networks by applying phase-lagged stimulation between network nodes [53]. This approach specifically targets the anti-correlated relationship between the Central Executive Network (CEN) and Default Mode Network (DMN), which plays a critical role in cognitive control [53].
Diagram 1: Network-Targeted Phase-Lagged tACS Experimental Design
The protocol involves individually customized theta/alpha-phase and high-gamma-amplitude coupled tACS applied to core nodes of the CEN (dorsolateral prefrontal cortex and posterior parietal cortex) and DMN (medial prefrontal cortex and posterior cingulate cortex) [53]. The critical manipulation is the phase relationship between networks, with 45° phase lag designed to facilitate synchronization and 180° phase lag designed to disrupt inter-network communication [53]. Stimulation is typically applied during specific task phases (e.g., retention period in working memory tasks), with fMRI acquired simultaneously to assess network-level effects [53].
Neurofeedback Protocols for Cross-Frequency Coupling
While neurofeedback has traditionally targeted amplitude-based features of single frequency bands, advanced protocols now incorporate cross-frequency coupling metrics as feedback signals [50]. These protocols require specialized signal processing to compute real-time CFC measures such as phase-amplitude coupling between theta and gamma rhythms [50].
The implementation involves continuous calculation of the modulation index between phase and amplitude signals from different frequency bands, which is then converted to visual or auditory feedback [50]. Participants receive positive reinforcement when their brain produces the desired coupling pattern (e.g., increased theta-gamma PAC during working memory maintenance) [50]. Training typically occurs over multiple sessions to enable stable learning of CFC self-regulation, with transfer tests assessing generalization to cognitive tasks without feedback [50].
Key Research Findings and Quantitative Outcomes
Behavioral and Cognitive Effects
Neuromodulation of cross-frequency coupling demonstrates significant, though parameter-dependent, effects on cognitive performance. The most consistent benefits have been observed in working memory tasks, particularly with theta-gamma coupled protocols.
Table 2: Behavioral Outcomes of CFC-Targeted Neuromodulation
| Protocol | Cognitive Domain | Key Findings | Effect Size/Magnitude |
|---|---|---|---|
| TGCp-tACS [52] | Phonological Working Memory | Significant accuracy improvement in 14-item Sternberg task | Increased accuracy with verum vs. sham stimulation |
| Network tACS (45° lag) [53] | Working Memory Reaction Time | Improved reaction times in fast-performing group | 691.88 ms (no-tACS) vs 690.80 ms (45° tACS) |
| Network tACS (180° lag) [53] | Working Memory Reaction Time | Impaired reaction times in fast-performing group | 691.88 ms (no-tACS) vs 758.36 ms (180° tACS) |
| tACS (Various) [50] | Multiple Domains | Performance improvements most pronounced in low baseline performers | Individual differences mediate effects |
The efficacy of CFC-targeted neuromodulation appears strongly influenced by individual factors, particularly baseline performance levels [52] [53]. Network-targeted tACS with 180° phase lag significantly increased reaction times in fast-performing individuals (758.36 ms vs 691.88 ms in no-tACS conditions), while 45° phase lag maintained baseline performance levels [53]. This pattern suggests that optimal phase relationships between anti-correlated networks may be crucial for efficient cognitive processing, and that disruption of these temporal dynamics impairs performance in otherwise high-functioning individuals [53].
Neurophysiological Effects
CFC-targeted neuromodulation produces measurable changes in brain activity patterns, reflecting the neurophysiological mechanisms underlying behavioral effects.
Table 3: Neurophysiological Outcomes of CFC-Targeted Neuromodulation
| Protocol | Neural Measures | Key Findings | Interpretation |
|---|---|---|---|
| TGCp-tACS [52] | Power Spectral Density | Increased high-gamma power at stimulation site; decreased theta/delta power globally | Local enhancement and distributed inhibition |
| Network tACS [53] | fMRI Connectivity | Phase-dependent modulation of hippocampal activation and task-related functional connectivity | Deep structure engagement via network stimulation |
| CFC Analysis [13] | Delta-Theta & Theta-Beta CFC | Reduced delta-theta and theta-beta CFC in patients with favorable DOC prognosis | CFC as biomarker of consciousness integrity |
| Microstate CFC [21] | Microstate-Specific CFC | Reduced delta/theta to alpha/beta coupling in SC-exposed individuals | Network integration deficits |
Theta-gamma coupled tACS produces distinctive power spectral changes, enhancing high-gamma activity at the stimulation site while reducing lower-frequency (theta/delta) oscillations throughout the cortex [52]. This pattern suggests a mechanism involving local high-frequency enhancement coupled with distributed inhibition of slower rhythms [52]. In disorders of consciousness, CFC patterns show clinical prognostic value, with patients transitioning to minimally conscious states exhibiting stronger alpha-band within-frequency coupling but reduced delta-theta and theta-beta CFC compared to those remaining in vegetative states [13]. Microstate-specific CFC analysis reveals network-level disruptions in populations with repetitive subconcussive impacts, including reduced cross-frequency coupling between emotional-motor integration and attentional control networks [21].
The Scientist's Toolkit: Research Reagent Solutions
Table 4: Essential Research Tools for CFC Neuromodulation Studies
| Tool Category | Specific Examples | Function/Application |
|---|---|---|
| Stimulation Systems | Starstim wireless hybrid tES-EEG system (Neuroelectrics) [52] | Integrated stimulation and recording with real-time impedance monitoring |
| Electrode Types | NG-Pistim electrodes (1 cm radius) [52] | Hybrid electrodes for simultaneous stimulation and EEG monitoring |
| Conductive Media | Conductive EEG gel [52] | Ensures proper electrode-scalp interface for current flow |
| EEG Cap Systems | 64-channel Ag/AgCl electrode caps (eego amplifier) [21] | High-density recording for spatial precision and microstate analysis |
| Signal Processing Tools | n:m Phase Synchronization Index (PSI) [13] [21] | Quantifies cross-frequency phase synchronization between distinct rhythms |
| Analytical Frameworks | Microstate-specific CFC analysis [21] | Links transient brain states to cross-frequency interactions |
| Experimental Paradigms | Modified Sternberg task [53], Auditory name-calling stimulation [13] | Standardized cognitive challenges for CFC assessment |
The implementation of CFC-targeted neuromodulation research requires specialized equipment and analytical tools. Integrated tES-EEG systems enable simultaneous stimulation and recording, allowing researchers to monitor immediate neurophysiological effects during intervention [52]. High-density EEG systems (64+ channels) facilitate microstate analysis and source localization, providing spatial precision for network-level investigations [21]. Advanced analytical metrics such as the n:m Phase Synchronization Index enable quantification of complex cross-frequency relationships beyond standard phase-amplitude coupling [13] [21]. These tools collectively support the design, application, and assessment of targeted neuromodulation protocols aimed at specific CFC patterns.
The targeted modulation of cross-frequency coupling through tACS and neurofeedback represents a promising frontier in cognitive neuroscience and neurotherapy. The evidence reviewed demonstrates that these techniques can selectively influence specific CFC patterns, resulting in measurable behavioral and neurophysiological changes [50] [52] [53]. The most consistent effects have been observed in working memory domains, particularly when stimulation parameters align with endogenous oscillatory properties and network architecture [52] [53].
Future research directions should address several critical challenges. Individual difference factors including health status, age, fatigue, personality traits, and baseline performance significantly influence CFC responsiveness, necessitating personalized parameter selection [50] [53]. Protocol optimization requires systematic investigation of stimulation parameters (duration, intensity, frequency specificity) and their interactions with individual neuroanatomical and neurophysiological characteristics [50] [52]. Advanced analytical approaches combining microstate analysis with CFC metrics may enhance spatial and temporal precision in identifying target networks [21]. Finally, the development of closed-loop systems that dynamically adjust stimulation parameters based on real-time CFC measures could maximize efficacy by matching brain state dynamics [50].
The integration of CFC-targeted neuromodulation with other neuroscientific methods, including fMRI and advanced EEG analytics, will further elucidate the mechanisms underlying these techniques and their potential applications in both enhancing cognitive function and addressing clinical disorders marked by disrupted cross-frequency coupling [13] [53] [21].
Addressing Methodological Challenges in CFC Research: Pitfalls and Solutions
In the analysis of cross-frequency coupling (CFC) in electroencephalography (EEG), the accurate measurement of phase-amplitude coupling (PAC) is paramount. This technical guide elucidates the critical confounding effects introduced by low-frequency power fluctuations and variable signal quality on PAC estimation. We detail a robust statistical framework that controls for these confounds, present experimental protocols for its implementation, and provide a curated toolkit of essential research reagents and analytical solutions. Adherence to these methodologies is crucial for generating reliable, interpretable CFC metrics in basic neuroscience research and clinical drug development.
Cross-frequency coupling (CFC), particularly phase-amplitude coupling (PAC), has emerged as a fundamental mechanism for neuronal coordination and information transfer in the brain. It is extensively studied in cognitive processes and is increasingly recognized as a potential biomarker for neurological and psychiatric disorders, including major depressive disorder (MDD) and epilepsy [54] [22]. The quantification of PAC aims to measure the relationship between the phase of a low-frequency rhythm and the amplitude of a high-frequency oscillation.
However, standard PAC metrics, such as the modulation index, are susceptible to significant confounding factors. A primary confounder is the power of the low-frequency rhythm itself. Fluctuations in low-frequency power can artificially inflate or obscure genuine phase-amplitude coupling, leading to both false positives and false negatives [22]. Furthermore, the overall quality of the EEG signal, influenced by artifacts and noise, introduces additional variability that can compromise CFC analysis. This whitepaper, framed within a broader thesis on CFC methodology, addresses these critical challenges by presenting a confounder-adjusted statistical framework and the requisite experimental protocols for obtaining robust CFC measures.
Core Challenge: Low-Frequency Power as a Confounder
The central challenge in accurate PAC quantification is that the amplitude of the high-frequency signal ((A{high})) can be correlated with both the phase ((\phi{low})) and the power ((A{low})) of the low-frequency signal. Traditional methods that only consider the (\phi{low})-(A{high}) relationship are blind to the influence of (A{low}).
- Mechanism of Confounding: Increases in low-frequency power can improve the signal-to-noise ratio (SNR) of the phase and amplitude estimates. This can lead to an increased PAC measure even when the underlying coupling strength between phase and amplitude has not changed [22]. Consequently, observed differences in PAC between experimental groups or conditions could be driven by differences in low-frequency power rather than true coupling.
- Biological Relevance: Altered power in low-frequency bands (e.g., delta, theta) is a common feature in various neuropsychiatric conditions. For instance, studies of Major Depressive Disorder (MDD) and the cognitive biotype of depression have reported significant changes in theta and alpha power [54] [47]. Therefore, failing to account for low-frequency power when comparing PAC across such groups can lead to severely biased conclusions.
The diagram below illustrates the statistical relationships that must be disentangled to obtain a pure measure of PAC.
Quantitative Data and Experimental Evidence
Empirical evidence from multiple studies underscores the prevalence and impact of these confounding factors. The following tables summarize key quantitative findings on CFC alterations and the spectral changes that can confound them.
Table 1: Altered Cross-Frequency Coupling in Clinical Populations
| Study Population | CFC Type | Change | Key Findings | Citation |
|---|---|---|---|---|
| Cognitive Biotype of Depression | Theta/Alpha/Beta - Gamma PAC | Decreased | Significant reduction in theta/alpha/beta-low gamma PAC at parietal sites (Pz, P3) during eyes-closed state. | [47] |
| Atrial Fibrillation (with Cognitive Impairment) | Theta-Beta & Theta-Gamma PAC | Increased | Elevated θ-β and θ-γ phase-amplitude coupling correlated with lower MoCA scores. | [55] |
| Atrial Fibrillation (with Cognitive Impairment) | Beta-Gamma PAC | Decreased | Reduced β-γ PAC observed in patient groups. | [55] |
Table 2: Power Spectral Density (PSD) Changes as a Potential Confounding Factor
| Study Population | Delta Power | Theta Power | Alpha Power | Beta Power | Citation |
|---|---|---|---|---|---|
| Atrial Fibrillation (with Cognitive Impairment) | Increased | Increased | Decreased | Decreased | [55] |
| Major Depressive Disorder (MDD) | - | - | Hyperconnectivity in alpha/beta bands | Hyperconnectivity in alpha/beta bands | [54] |
The data in Table 2 highlights that the very oscillations whose power is altered (e.g., theta in depression and atrial fibrillation) are also involved in the CFC changes reported in Table 1. This co-occurrence makes it imperative to control for power when interpreting PAC differences.
A Statistical Framework for Deconfounding CFC
To address the limitation of traditional methods, a Generalized Linear Model (GLM) framework has been developed to dissect the distinct contributions of low-frequency phase and power to high-frequency amplitude [22].
Core Model Specification
This framework involves comparing a set of nested models to assess the unique contribution of phase to amplitude, after accounting for the effect of low-frequency power.
The (A{low}) Model (Null Model): This model tests for Amplitude-Amplitude Coupling (AAC) by regressing the high-frequency amplitude against the low-frequency amplitude. ( \log(\mu) = \sum{k=1}^{n} \betak fk(A{low}) ) where (A{high} | A{low} \sim \text{Gamma}(\mu, \nu)), and (fk) represents a spline basis.
The (\phi{low}) Model: This model tests for classic PAC by regressing the high-frequency amplitude against the low-frequency phase. ( \log(\mu) = \sum{k=1}^{n} \betak fk(\phi_{low}) )
The Full Model ((\phi{low} + A{low})): This combined model assesses the unique contribution of phase to amplitude, after controlling for the effect of low-frequency amplitude. ( \log(\mu) = \sum{k=1}^{n} \betak fk(\phi{low}) + \sum{j=1}^{m} \gammaj gj(A{low}) )
The significance of true PAC is determined by comparing the full model against the (A_{low}) model using a likelihood ratio test. A significant improvement in model fit indicates that phase provides unique information about the high-frequency amplitude beyond what is explained by low-frequency power alone.
Experimental Workflow for Robust CFC Analysis
The following diagram outlines the end-to-end experimental protocol, from data acquisition to statistical inference, for conducting confounder-adjusted CFC analysis.
Detailed Experimental Protocol
EEG Data Acquisition:
- Equipment: Use a high-density EEG system (e.g., 64+ channels) with a high sampling rate (≥512 Hz recommended for high-gamma analysis).
- Setting: Recordings should be conducted in a quiet, electromagnetically shielded room. Both resting-state (eyes-open/eyes-closed) and task-based paradigms are applicable.
- Parameters: Maintain a bandpass filter during acquisition (e.g., 0.1-100 Hz) and use a common reference (e.g., Cz or average reference).
Preprocessing (using EEGLAB/FieldTrip in MATLAB or MNE-Python):
- Resampling: Downsample data to a suitable rate (e.g., 256 Hz) to reduce computational load.
- Filtering: Apply a notch filter (e.g., 48-52 Hz for line noise) and a bandpass filter (e.g., 1-45 Hz) using zero-phase filters to avoid distorting the signal phase [54] [55].
- Bad Channel/epoch Removal: Identify and interpolate or remove channels with excessive noise. Reject epochs containing high-amplitude artifacts (e.g., exceeding ±100 µV) [54].
- Artifact Correction: Apply Independent Component Analysis (ICA) to identify and remove components corresponding to ocular, cardiac, and muscular artifacts [54] [55].
- Re-referencing: Re-reference the data to the average of all channels.
CFC Analysis using the GLM Framework:
- Band Selection: Define the low-frequency (e.g., Theta: 4-8 Hz) and high-frequency (e.g., Gamma: 30-45 Hz or 60-120 Hz) bands of interest.
- Hilbert Transform: Bandpass filter the preprocessed data into the selected bands and apply the Hilbert transform to extract the instantaneous phase ((\phi{low})) and amplitude envelopes ((A{low}), (A_{high})).
- Model Fitting: In a statistical software environment (e.g., R or Python with statsmodels), fit the three Gamma-distributed GLMs with a log-link function, as specified in Section 4.1. Use a spline basis (e.g., natural cubic splines with 5-10 degrees of freedom) to model the non-linear relationships.
- Hypothesis Testing: Perform a likelihood ratio test between the Full Model and the (A_{low}) model. A p-value below the corrected significance threshold (e.g., p < 0.05, FDR-corrected for multiple comparisons) indicates significant PAC after controlling for low-frequency power.
This section catalogs the key computational tools, software, and methodological resources required to implement the described CFC analysis.
Table 3: Research Reagent Solutions for CFC Analysis
| Item/Resource | Type | Primary Function | Implementation Notes |
|---|---|---|---|
| MATLAB | Software Platform | Core environment for data analysis and signal processing. | Requires Signal Processing Toolbox. [54] |
| EEGLAB | MATLAB Toolbox | Comprehensive GUI and script-based toolbox for EEG preprocessing (ICA, filtering, epoch rejection). | Essential for standardized preprocessing pipelines. [55] |
| FieldTrip | MATLAB Toolbox | Advanced toolbox for M/EEG analysis, including connectivity and time-frequency analysis. | Highly flexible for custom scripted analyses. |
| MNE-Python | Python Library | Open-source Python package for exploring, visualizing, and analyzing human neurophysiological data. | Preferred for integration into modern Python-based data science workflows. |
| R / Python (statsmodels) | Statistical Software | Environment for implementing the Generalized Linear Model (GLM) framework. | Crucial for performing the confounder-adjusted statistical testing. [22] |
| Generalized Linear Model (GLM) | Statistical Method | Deconfounds PAC by modeling high-frequency amplitude as a function of both low-frequency phase and power. | The core methodological advancement for robust CFC measurement. [22] |
| Weighted Phase Lag Index (wPLI) | Analytical Metric | Measures functional connectivity while reducing the impact of volume conduction and common sources. | Used in network-level analyses complementary to CFC. [54] |
| Phase Locking Value (PLV) | Analytical Metric | Quantifies phase synchrony between two signals from different brain regions. | A common metric in brain network analysis. [54] |
| Nicolet/V5.95 System | Hardware/Acquisition | Clinical-grade EEG recording system for high-quality data acquisition. | Example of professional equipment used in clinical studies. [55] |
The pursuit of physiologically meaningful and clinically applicable biomarkers based on cross-frequency coupling demands rigorous analytical standards. The confounding influence of low-frequency power is a fundamental methodological pitfall that, if unaddressed, can invalidate research findings and hinder translational progress. The adoption of the presented statistical framework, which explicitly controls for this confounder within a generalized linear modeling approach, provides a path toward more reliable and interpretable CFC metrics. Integrating these robust analytical practices with high-quality experimental protocols is essential for advancing our understanding of brain network dynamics and developing novel therapeutic interventions.
Statistical Frameworks for Reliable CFC Measurement
Cross-frequency coupling (CFC) is emerging as a fundamental feature of brain activity, correlated with both normal brain function and dysfunction [56]. This phenomenon describes the interaction between neuronal oscillations at different frequencies and is believed to play a critical role in coordinating brain networks by modulating neural excitability and controlling the timing of neuronal firing [56]. In general, lower frequency rhythms engage larger brain areas and modulate spatially localized fast activity [56]. The degree of CFC in various brain areas has been linked to working memory, neuronal computation, communication, learning, and emotion, as well as clinical disorders including epilepsy [56].
Analysis of CFC focuses on relationships between the amplitude, phase, and frequency of two rhythms from different frequency bands, encompassing several specific types of coupling: phase-phase coupling (PPC), phase-amplitude coupling (PAC), and amplitude-amplitude coupling (AAC) [56]. PAC has been particularly well-studied, observed in rodent striatum and hippocampus [56] and human cortex [57], where the phase of low frequency rhythms modulates and coordinates neural spiking via local circuit mechanisms that provide discrete windows of increased excitability [56]. This interaction carries behaviorally relevant information related to position, memory, and decision making [56].
Despite the fundamental importance of CFC, the field faces significant methodological challenges. Choosing an inappropriate measurement method weakens statistical power and introduces opportunities for confounding effects [56]. Many existing CFC measures focus on only one type of coupling, restricting the type of CFC detectable in data, and changes in low frequency power can affect measures of PAC independently of actual phase-amplitude coupling [56]. This technical guide examines advanced statistical frameworks designed to overcome these limitations and provide reliable CFC measurement.
Current Methodological Challenges in CFC Assessment
The accurate quantification of cross-frequency coupling presents several substantial methodological challenges that researchers must address to draw valid conclusions from neural data. First, the proliferation of analysis methods—including mean vector length/modulation index, phase-locking value, envelope-to-signal correlation, amplitude spectra analysis, and coherence measures—each developed with different principles and for different purposes, creates confusion regarding optimal approach selection [56]. This "methodological toolbox" limitation means that applying a method designed to detect only one type of CFC (e.g., PAC) to data containing multiple coupling types may either falsely report no coupling or miss significant aspects of the coupling present [56].
A second significant challenge involves confounding by low-frequency power. Increases in low frequency power can improve the signal-to-noise ratio of phase and amplitude variables, thereby increasing the measured PAC even when the actual phase-amplitude coupling remains constant [56]. This creates a fundamental interpretative problem, as CFC measures become contaminated by non-specific power changes. Additionally, many experimental and clinical factors (e.g., stimulation parameters, subject age or sex) can impact CFC in ways that are difficult to characterize with existing methods [56].
A third challenge concerns the complexity of neural signals, particularly when analyzing resting-state data where signals contain several frequency bands potentially interacting through multiple mechanisms simultaneously [57]. The broadband nature of neural signals means that iso-frequency and cross-frequency synchronizations may occur simultaneously, creating difficulties in disentangling distinct coupling mechanisms [57]. Furthermore, the non-linear nature of electrophysiological brain activity results in characteristics such as multistability, bifurcations, and multiscale behaviors that complicate analysis [58].
Table 1: Key Challenges in CFC Measurement and Their Implications
| Challenge | Description | Impact on Research |
|---|---|---|
| Method Proliferation | Numerous methods developed with different principles | Difficulty in method selection; incompatible results across studies |
| Power Confounding | Low-frequency power changes artificially affect PAC measures | Inability to distinguish true coupling from signal-to-noise ratio effects |
| Signal Complexity | Multiple simultaneous coupling types in broadband signals | Failure to detect all relevant interactions; simplified interpretations |
| A Priori Frequency Selection | Need to pre-specify frequency bands of interest | Potential missing of novel or unexpected cross-frequency interactions |
Advanced Statistical Frameworks for CFC Quantification
Generalized Linear Model Framework for CFC
To address limitations of existing CFC measures, a generalized linear model (GLM) framework has been proposed to assess CFC between high-frequency amplitude and, simultaneously, low-frequency phase and amplitude [56]. This formal statistical inference framework builds upon previous work to model the distribution of high-frequency amplitude (Ahigh) as a function of different predictors, including low-frequency phase (φlow) and low-frequency amplitude (A_low) [56].
The GLM approach employs three primary models to analyze different types of CFC. The fundamental logic involves modeling the distribution of Ahigh as a function of different predictors, fitting Ahigh as a function of φlow, Alow, and their combinations [56]. If these models fit the data sufficiently well, distances between the modeled surfaces can estimate the impact of each predictor. Specifically, the φlow model relates Ahigh to a linear combination of φlow expressed in a spline basis: Ahigh | φ_low ~ Gamma[μ,ν] [56].
This framework offers several advantages over traditional methods. First, it simultaneously accounts for multiple coupling types, preventing the omission of relevant interactions when multiple CFC types coexist. Second, it controls for confounding variables explicitly, including the power of low-frequency oscillations. Third, it provides a formal statistical inference framework for hypothesis testing about CFC presence and strength. Simulations have demonstrated that this method successfully detects CFC between low-frequency phase or amplitude and high-frequency amplitude, outperforming existing methods like the modulation index in biologically-motivated examples, particularly in signals with CFC dependent on low-frequency amplitude [56].
Cross-Frequency Phase Linearity Measurement
For phase-to-phase cross-frequency coupling between brain areas, an extension of phase linearity measurement (CF-PLM) has been developed to estimate n:m synchronization applied to broadband signals without a priori hypotheses about the frequency of synchronized components [57]. This approach is particularly valuable because n:m synchronization is the only form of cross-frequency synchronization that allows information exchange at the time resolution of the faster signal, likely playing a fundamental role in large-scale coordination of brain activity [57].
The CF-PLM method uses the shape of the interferometric spectrum of two signals to estimate cross-frequency coupling strength [57]. The process begins by defining the interferometric signal. For two time series x(t) and y(t) representing activity from two brain areas, the Hilbert transform yields their analytical expressions: xan(t) = Ax(t)e^(iφx(t)) and yan(t) = Ay(t)e^(iφy(t)), where A and φ represent the time-varying amplitude and phase [57]. The normalized interferometric component z(t) is then computed as: z(t) = [xan(t) y'an(t)] / [|xan(t)| |yan(t)|] = e^(iΔφ(t)) [57]. This complex interferometric function has amplitude equal to 1 (making it independent of signal amplitudes) and a phase term Δφ(t) = φx(t) - φy(t) ∈ [-π, π[, representing the time-varying phase difference between signals [57].
This phase-based approach offers significant advantages for resting-state data analysis, where signals contain multiple frequency bands potentially interacting simultaneously through various mechanisms [57]. Unlike methods requiring precise a priori frequency hypotheses, CF-PLM can identify coupling patterns directly from broadband signals, making it particularly valuable for exploratory research.
Table 2: Comparison of Advanced Statistical Frameworks for CFC Measurement
| Framework | Primary Coupling Type Addressed | Key Innovation | Advantages | Limitations |
|---|---|---|---|---|
| GLM Framework [56] | PAC, AAC | Simultaneous modeling of phase and amplitude effects | Controls for low-frequency power confounds; formal statistical inference | Complex implementation; computationally intensive |
| CF-PLM [57] | Phase-phase (n:m synchronization) | Interferometric spectrum analysis without a priori frequency hypotheses | Pure phase-based measure; detects unknown frequency ratios | Limited to phase-phase coupling; newer method with less validation |
| Bispectrum/Bicoherence [58] | Multiple CFC types | Higher-order spectral analysis | Detects non-linear interactions; established method | Not pure phase-based; ambiguous neurophysiological interpretation [57] |
Experimental Protocols and Methodologies
Signal Preprocessing and Feature Extraction
The initial critical step in CFC analysis involves proper estimation of phase and amplitude envelopes from raw neural signals. The standard protocol involves [56]:
Bandpass Filtering: Data is bandpass filtered into specific low-frequency (e.g., 4-7 Hz) and high-frequency (e.g., 100-140 Hz) signals, Vlow and Vhigh, using least-squares linear-phase FIR filters. Filter orders typically range from 50 for low frequencies to 375 for high frequencies to maintain precision [56].
Analytic Signal Extraction: The Hilbert transform is applied to both filtered signals to compute their analytic representations, from which the phase and amplitude of the low-frequency signal (Alow and φlow) and the amplitude of the high-frequency signal (A_high) are derived [56].
Frequency Band Selection: While specific ranges can be tailored to research questions, selection of a wide high-frequency band is consistent with recommendations from the literature and the mechanistic explanation that extracellular spikes produce broadband high-frequency activity [56].
It is crucial to address the unique characteristics of EEG signals during preprocessing, including their susceptibility to noise interference resulting in low signal-to-noise ratio, nonlinearity, non-normal distribution, and significant variations due to individual factors such as age, psychology, and testing environment [59].
Validation and Testing Protocols
Robust validation of CFC methodologies involves multiple approaches:
Simulation Testing: Both the GLM and CF-PLM frameworks have been validated using simulated data from coupled oscillators. The GLM framework was tested in simulations with CFC dependent on low-frequency amplitude [56], while CF-PLM was tested using Rössler oscillators (capturing brain non-linearities) and Kuramoto oscillators with introduced lags to simulate simultaneous iso- and cross-frequency synchronization [57].
Biological Plausibility Assessment: Methods should be applied to in vivo data from both human and animal models. For instance, the GLM framework has been applied to in vivo recordings during seizures and in response to electrical stimuli [56], while CF-PLM has been tested on source-reconstructed MEG data to identify brain areas with cross-frequency coupling spatially consistent across subjects [57].
Comparison with Established Measures: Performance should be compared against established methods like modulation index for PAC detection [56] and bicoherence for phase-phase coupling [58].
Figure 1: Comprehensive Workflow for Reliable CFC Measurement
Table 3: Essential Research Tools for CFC Analysis
| Tool/Resource | Function/Purpose | Implementation Considerations |
|---|---|---|
| Least-Squares Linear-Phase FIR Filters [56] | Bandpass filtering for frequency separation | Filter order selection critical: ~50 for low frequencies, ~375 for high frequencies |
| Hilbert Transform [56] [57] | Analytic signal extraction for phase/amplitude | Standard method; produces instantaneous phase and amplitude estimates |
| Generalized Linear Model Framework [56] | Simultaneous PAC and AAC assessment | Gamma distribution typically used for amplitude modeling; spline basis for phase |
| Interferometric Signal Computation [57] | Phase-phase coupling detection | Creates amplitude-independent measure: z(t) = e^(iΔφ(t)) |
| Bispectrum/Bicoherence Analysis [58] | Detection of nonlinear frequency interactions | Established method but not pure phase-based; interpretation challenges |
| Rössler/Kuramoto Oscillators [57] | Method validation through simulation | Tests detection performance under controlled coupling conditions |
The development of advanced statistical frameworks for CFC measurement represents significant progress in neuroscience methodology. The GLM approach provides a comprehensive solution to the confounding effects of low-frequency power, while CF-PLM enables detection of unknown phase-phase coupling patterns in broadband signals. These methods move beyond the limitations of traditional approaches that focus on single coupling types and require a priori frequency specifications.
Future methodological development should focus on several key areas. First, integration of multiple CFC types within unified frameworks would better capture the complexity of neural interactions. Second, improved computational efficiency would facilitate application to large-scale neural recordings and high-density electrode arrays. Third, standardization of reporting metrics would enhance reproducibility and comparison across studies. Finally, bridging CFC measures with underlying neurobiology through simultaneous physiological recording and computational modeling remains essential for meaningful biological interpretation.
As these statistical frameworks become more sophisticated and widely adopted, they promise to deepen our understanding of how cross-frequency interactions support brain function and how their disruption contributes to neurological and psychiatric disorders. The application of these advanced methods in basic research and drug development contexts may reveal novel biomarkers and therapeutic targets based on specific CFC patterns associated with disease states.
Figure 2: Future Development Directions for CFC Methodologies
Cross-frequency coupling (CFC) has emerged as a critical electrophysiological measure of oscillatory brain activity, believed to play a fundamental role in neuronal computation, learning, and communication [20]. As research into CFC expands, particularly in electroencephalography (EEG) studies of psychiatric and neurological disorders, a significant challenge has hampered progress: methodological heterogeneity. This variability in research methods complicates the synthesis and comparison of findings across studies, potentially obscuring genuine neurophysiological effects and undermining the reliability of CFC as a potential biomarker [20]. The pressing need for standardization is underscored by systematic reviews revealing "significant heterogeneity in methodology used" across CFC studies [20], which may lead to spurious analyses and contradictory findings.
Within the context of CFC research, heterogeneity manifests primarily in three forms, as defined by general research methodology frameworks [60]. Clinical heterogeneity reflects variations in participant characteristics, interventions, or measured outcomes. Methodological heterogeneity arises from differences in study designs, procedures, and analytical techniques. Statistical heterogeneity signifies variability in intervention effects among studies. For CFC research specifically, these forms of heterogeneity present distinct challenges that require systematic addressing through standardized frameworks and reporting guidelines.
Defining and Categorizing Heterogeneity in CFC Research
The measurement and interpretation of cross-frequency coupling are complicated by numerous methodological decision points throughout the research pipeline. A systematic review of CFC in psychiatric disorders highlighted that "there was heterogeneity in methodologies used, which may lead to spurious CFC analyses" [20]. This heterogeneity spans across multiple dimensions of the research process, from data acquisition to analytical techniques and interpretation frameworks.
Key sources of methodological heterogeneity in CFC research include:
Data Acquisition Variability: Differences in EEG equipment, electrode placement systems (64-electrode vs. 128-electrode caps), recording montages, and reference schemes create fundamental incompatibilities between datasets [61]. Sampling rates, filter settings, and impedance thresholds further contribute to this variability.
Experimental Paradigm Differences: Resting-state protocols vary in duration (e.g., six 1-minute recordings alternating eyes closed and open [61]), instruction sets, and environmental controls. Task-based studies employ diverse cognitive challenges with different timing parameters and performance measures.
Signal Processing Methodologies: Preprocessing approaches differ substantially in artifact handling (manual vs. automated rejection), filtering techniques, and epoch selection criteria. As noted in CFC studies, "due to excessive artifacts," significant data exclusion often occurs, but the criteria for such exclusion vary widely [62].
CFC Quantification Methods: Researchers employ different algorithms and statistical approaches to measure coupling, including modulation index (MI), which "has been shown to be less affected by noisy data compared to other techniques" [62], phase-locking value, and entropy-based measures. Each method has distinct assumptions and sensitivity profiles.
Table 1: Primary Sources of Methodological Heterogeneity in CFC Research
| Research Phase | Sources of Heterogeneity | Impact on Results |
|---|---|---|
| Study Design | Participant inclusion criteria, diagnostic thresholds, sample sizes | Affects generalizability and statistical power |
| Data Acquisition | EEG equipment, electrode placement, reference schemes, sampling rates | Creates fundamental incompatibilities between datasets |
| Signal Processing | Artifact handling, filtering techniques, epoch selection | Introduces variability in signal-to-noise ratio and data quality |
| CFC Quantification | Algorithm choice (MI, PLV, etc.), statistical thresholds, software implementations | Affects coupling strength measurements and detection sensitivity |
| Interpretation | Statistical correction methods, visualization techniques, reporting practices | Influences result interpretation and comparison across studies |
Documented Impacts of Heterogeneity on CFC Findings
The consequences of methodological heterogeneity are evident in the contradictory findings within the CFC literature. For instance, studies investigating Alzheimer's disease (AD) have reported diverging CFC patterns, with "one study found a decrease in CFC... while another found an increased CFC in AD compared to healthy controls (HC)" [62]. The authors suggest that "the underlying reason for the diverging results may be due to differences in the methods applied to calculate CFC" [62], highlighting how methodological choices can directly impact research outcomes and theoretical conclusions.
This methodological variability is particularly problematic for emerging clinical applications of CFC, where the measure shows promise as a potential biomarker for disease progression. Research in Mild Cognitive Impairment (MCI) has found that "patients with pMCI showed a significantly lower global gamma/theta CFC compared to patients with sMCI" [62], suggesting CFC's potential utility in predicting clinical progression. However, without standardized methodologies, translating such findings to clinical practice remains challenging. The systematic review of CFC in psychiatric disorders similarly concluded that "going forward, standardized methodologies need to be established and utilized in further research to understand the neuropathophysiology associated with psychiatric disorders" [20].
Standardization Frameworks for CFC Research
Standardized Experimental Protocols
Establishing standardized experimental protocols is fundamental to reducing methodological heterogeneity in CFC research. Based on current literature, the following framework addresses key sources of variability:
Participant Characterization and Recruitment: Implement stratified sampling based on age, clinical status, and medication use. Developmental studies demonstrate that CFC measures "demonstrated good test-retest stability and proved to be higher in adults in cortical areas participating in sensory-motor integration, response inhibition, and attentional control" [61], highlighting the importance of age matching. Comprehensive reporting should include demographic characteristics, clinical history, and inclusion/exclusion criteria.
EEG Data Acquisition Standards: Standardize electrode placement using international systems (10-20, 10-10, or 10-5), impedance thresholds (<5-10 kΩ), sampling rates (≥500 Hz), and filter settings. Studies should specify equipment details including amplifier specifications and electrode types. For resting-state recordings, adopt standardized paradigms similar to those used in developmental research: "Six 1-min recordings with eyes closed and six 1-min recordings with eyes open alternated sequentially" [61].
Task-Based Paradigm Selection: When employing cognitive tasks, select validated paradigms with established neural correlates. For memory assessment, utilize protocols known to engage hippocampal-cortical networks where theta-gamma coupling is prominent. Task instructions, timing parameters, and practice sessions should be standardized across sites in multi-center studies.
Table 2: Minimum Reporting Standards for CFC Studies
| Category | Essential Reporting Elements | Examples from Literature |
|---|---|---|
| Participants | Sample size, age, sex, clinical characteristics, inclusion/exclusion criteria, medication status | "15 patients with AD, 25 patients with MCI, and 36 older HC" [62] |
| EEG Acquisition | Equipment specifications, electrode montage, reference scheme, sampling rate, filter settings, impedance thresholds | "EEG was recorded by means of 64 electrodes mounted in an Easycap...referenced to vertex" [61] |
| Experimental Conditions | Resting-state duration/conditions, task parameters, stimulus presentation details | "Six 1-min recordings with eyes closed and six 1-min recordings with eyes open alternated sequentially" [61] |
| Preprocessing | Artifact handling methods, filtering approaches, epoch selection, data exclusion criteria | "Due to excessive artifacts, we excluded the following number of EEGs: two from patients with AD, two from patients with MCI, and one from HC" [62] |
| CFC Quantification | Algorithm specification, parameter choices, statistical thresholds, software tools | "We calculated the modulation index (MI), which has been shown to be less affected by noisy data compared to other techniques" [62] |
Analytical Standardization Approaches
Standardizing analytical approaches is crucial for enhancing the comparability of CFC findings across studies. The following methodologies address key aspects of the analytical pipeline:
Signal Preprocessing Protocols: Implement standardized artifact removal techniques combining automated algorithms and manual inspection. Establish clear criteria for epoch rejection and data exclusion, reporting the percentage of data retained. Utilize consistent referencing schemes (e.g., average reference, source derivation) appropriate for the research question.
CFC Quantification Methods: Select measurement approaches based on theoretical considerations and computational properties. The modulation index (MI) offers advantages as it "has been shown to be less affected by noisy data compared to other techniques" [62]. Standardize parameter choices for frequency bands (delta: 1-4 Hz, theta: 4-8 Hz, alpha: 8-12 Hz, beta: 12-30 Hz, gamma: >30 Hz) [20] and computational parameters across studies.
Statistical Analysis and Multiple Comparisons: Adopt consistent statistical approaches for group comparisons and correlation analyses. Implement appropriate multiple comparison corrections for mass univariate testing across channels and frequency pairs. Report effect sizes alongside p-values to facilitate meta-analytic approaches.
The following diagram illustrates a standardized workflow for CFC analysis from data acquisition to interpretation:
Experimental Protocols for CFC Assessment
Standardized Resting-State CFC Protocol
Resting-state CFC assessment provides a baseline measure of intrinsic brain network interactions without the confounding effects of task performance. The following protocol details a standardized approach:
Equipment Setup and Preparation: Utilize high-density EEG systems (minimum 64 channels) with sampling rates ≥1000 Hz to adequately capture gamma activity. Employ electrode caps with integrated preamplifiers to enhance signal quality. Implement impedance checks ensuring all electrodes maintain impedance below 10 kΩ. Standardize laboratory conditions including lighting, sound attenuation, and temperature.
Recording Parameters and Paradigm: Adopt a balanced alternating blocks design: "Six 1-min recordings with eyes closed and six 1-min recordings with eyes open alternated sequentially" [61]. For eyes open condition, instruct participants to "look at an empty monitor screen situated at a distance of 120 cm" [61] to minimize ocular artifacts. Include brief practice trials to familiarize participants with the procedure.
Preprocessing Pipeline: Apply bandpass filtering (0.5-70 Hz) and notch filtering (50/60 Hz) to remove line noise. Implement independent component analysis (ICA) for ocular and muscular artifact removal. Segment data into 2-second epochs with 50% overlap. Apply automatic and manual artifact rejection criteria (amplitude thresholds ±100μV, gradient threshold 50μV). Report the percentage of retained epochs for transparency.
Task-Based CFC Assessment Protocol
Task-based CFC protocols enable investigation of cognitive process-specific neural coupling. The following framework standardizes this approach:
Memory Task Paradigm: Implement a working memory task known to engage hippocampal-prefrontal circuits where theta-gamma coupling is prominent. Use a modified N-back task (1-back vs. 2-back conditions) with interstimulus intervals optimized for oscillatory analysis (2-3 seconds). Include sufficient trials (minimum 40 per condition) to ensure statistical power for CFC measures.
Control Condition Design: Incorporate matched control conditions that account for sensory processing and motor responses without engaging the cognitive process of interest. For memory tasks, use passive viewing or simple detection tasks with identical stimulus properties. Counterbalance task order across participants to control for sequence effects.
Trial Structure and Timing: Standardize trial structure with fixed intervals for stimulus presentation, response windows, and intertrial intervals. Include jittered fixation periods to allow for baseline CFC measurement. Synchronize EEG recording with stimulus presentation software to ensure precise timing alignment for phase analysis.
The Scientist's Toolkit: Essential Research Reagents and Materials
Table 3: Essential Research Materials for Standardized CFC Studies
| Item Category | Specific Products/Specifications | Function in CFC Research |
|---|---|---|
| EEG Acquisition Systems | 64+ channel systems (BrainAmp, BioSemi, EGI) with active electrodes | High-quality signal acquisition essential for detecting low-amplitude oscillations, particularly in gamma range |
| Electrode Caps & Montages | Standardized positioning (10-5 system), multiple cap sizes for fit | Ensures consistent spatial sampling across studies and appropriate head coverage for region-specific CFC analysis |
| Conductive Electrolyte Gels | High-chloride, low-impedance gels (SuperVisc, SignaGel) | Maintains stable electrode-skin interface with impedance <10 kΩ, crucial for signal quality and noise reduction |
| Stimulus Presentation Software | E-Prime, PsychoPy, Presentation with precise timing | Controls experimental paradigms with millisecond precision required for time-frequency and phase-based analyses |
| CFC Analysis Toolboxes | Custom MATLAB scripts, HERMES, Brainstorm, FieldTrip | Implements standardized CFC algorithms (Modulation Index) with validated parameters for reproducible analysis |
| Reference Atlases & Templates | MNI coordinates, AAL/Desikan-Killiany parcellations | Enables standardized region-of-interest definitions and spatial normalization for cross-study comparisons |
Visualization and Reporting Standards
Data Visualization Guidelines
Effective visualization of CFC results enhances interpretability and facilitates cross-study comparisons. The following guidelines establish standards for CFC data presentation:
Color Scheme Selection for CFC Plots: Implement accessible color palettes with sufficient contrast following WCAG guidelines, where "the visual presentation...have a contrast ratio of at least 3:1 against adjacent color(s)" [63]. For circular phase plots, use perceptually uniform colormaps (viridis, plasma) with clearly labeled color bars indicating coupling strength. Avoid red-green combinations that are problematic for color-blind users.
Spatial Topography Displays: When presenting CFC results across electrode locations, use standardized head plot templates with consistent viewing angles and scaling. Include clear labels for anatomical regions and significance markers. Maintain consistent color scaling across comparable plots to enable visual comparison.
Statistical Visualization: For group comparisons, utilize visualization methods that represent both effect sizes and variability. Raincloud plots combining distribution shapes, boxplots, and individual data points provide comprehensive representation. For correlation analyses, include scatter plots with confidence intervals and correlation coefficients.
The following diagram illustrates the relationship between different CFC types and their neural correlates:
Standardized Reporting Framework
Comprehensive reporting is essential for research transparency and reproducibility. The following framework specifies minimum reporting standards for CFC studies:
Methodological Transparency: Report complete details of data acquisition parameters including equipment specifications, sampling rates, filter settings, and electrode locations. Document all preprocessing steps including artifact handling methods, data exclusion criteria, and the proportion of data retained. Specify CFC computation algorithms with exact parameter values and statistical approaches.
Result Documentation: For significant CFC findings, report effect sizes and confidence intervals alongside statistical significance values. Provide complete demographic and clinical characteristics of participant groups. Document any deviations from pre-registered analysis plans with justification.
Data Sharing and Accessibility: Where possible, share processed data and analysis code in standardized formats (EEG-BIDS) to facilitate reanalysis and meta-analytic approaches. Provide sufficient metadata to enable interpretation of shared data. Utilize public repositories with persistent identifiers for archived data and code.
Addressing methodological heterogeneity in CFC research requires concerted effort across the scientific community to implement standardized protocols, analytical approaches, and reporting frameworks. As summarized in a systematic review of CFC in psychiatric disorders, "standardized methodologies need to be established and utilized in further research to understand the neuropathophysiology associated with psychiatric disorders" [20]. The frameworks presented in this article provide a foundation for such standardization, encompassing experimental design, data processing, analytical techniques, and reporting standards.
The potential clinical applications of CFC as a biomarker for disease progression and treatment response [62] depend heavily on resolving current methodological challenges. By adopting standardized approaches, researchers can enhance the reliability, reproducibility, and translational impact of CFC findings, ultimately advancing our understanding of brain function in health and disease. Future efforts should focus on community-wide adoption of these standards, development of validated reference databases, and establishment of reporting guidelines specific to CFC research methodologies.
Cross-frequency coupling (CFC) has emerged as a fundamental mechanism for neural coordination across different spatiotemporal scales in the brain, with phase-amplitude coupling (PAC) representing the most extensively studied form [64] [34]. In electroencephalography (EEG) research, CFC analysis provides critical insights into brain function and dysfunction, with applications ranging from basic neuroscience to clinical drug development [56]. The reliability of CFC measurements, however, is highly dependent on appropriate parameter selection throughout the analytical pipeline. Even with advanced statistical methods, improperly chosen filter parameters, frequency bands, or statistical thresholds can lead to false positives or obscured biological signals [56] [64]. This technical guide provides a comprehensive framework for optimizing these core parameters, enabling researchers to generate more robust, reproducible, and biologically meaningful CFC findings within the context of EEG signal analysis.
Optimizing CFC parameters is particularly crucial in drug development, where accurate biomarker quantification can determine trial success. For instance, in neurological and psychiatric disorders such as Parkinson's disease and Fragile X Syndrome (FXS), specific CFC patterns have been identified as promising biomarkers for diagnosis and treatment response monitoring [64] [65]. A standardized approach to parameter selection ensures that these biomarkers can be reliably tracked across multiple research sites and over time, facilitating more confident go/no-go decisions in clinical development pipelines.
Core Methodologies and Quantitative Parameters
Filter Selection and Configuration
Filter choices represent the foundational step in CFC analysis, directly impacting signal quality and subsequent coupling measurements. The selection of appropriate filter types and parameters is essential for accurate isolation of frequency components while minimizing phase distortion and artifacts.
Table 1: Filter Parameters for CFC Analysis
| Filter Type | Typical Application | Key Parameters | Rationale | Considerations |
|---|---|---|---|---|
| Zero-phase FIR filter | General preprocessing; notch filtering [54] | Order: application-dependent; 50 Hz for line noise removal [54] | Preserves signal phase; essential for accurate phase estimation | Higher orders provide sharper cutoffs but increase computational load |
| Bandpass FIR filter | Frequency band decomposition [54] | 0.5–100 Hz for broadband; band-specific for rhythms [54] | Removes low-frequency drift and high-frequency noise | Zero-phase implementation prevents phase distortion |
| Butterworth filter | Connectivity analysis [54] | 4th-order; frequency-specific to targeted bands | Smooth frequency response; minimal passband ripple | Can introduce phase distortion if not zero-phase |
| Dual-bandpass approach | Phase and amplitude extraction [64] | Narrow for phase (e.g., 1-2 Hz bandwidth); broad for amplitude (center frequency ± phase frequency) [64] | Optimizes phase estimation precision while capturing amplitude fluctuations | Requires two filtering steps for the same frequency component |
The dual-filter approach deserves particular emphasis for PAC analysis. As highlighted in [64], extracting the phase of a low-frequency rhythm requires a narrow bandpass filter to obtain an accurate phase estimate, while extracting the amplitude of a high-frequency rhythm necessitates a broader bandpass filter that must at least include the center frequency ± the phase frequency to detect amplitude fluctuations at the phase frequency. For example, when testing for PAC between 10 Hz and 65 Hz, the bandpass filter for the amplitude should be at least 55–75 Hz to detect this coupling [64].
Frequency Band Specification
Defining appropriate frequency bands for CFC analysis requires balancing established neurophysiological conventions with data-driven approaches tailored to specific research questions and populations.
Table 2: Standard and Optimized Frequency Bands for CFC Research
| Frequency Band | Standard Range (Hz) | Research Context | CFC Partner | Functional Association |
|---|---|---|---|---|
| Delta | 1–4 [54] | MDD; Cognitive enhancement [54] [65] | Gamma | Deep sleep; unconscious processes [65] |
| Theta | 4–8 [54] | Working memory; FXS [66] [65] | Gamma | Light sleep, REM, creativity, meditation [65] |
| Alpha | 8–13 [54] | MDD; FXS; Cognitive readiness [54] [65] | Gamma, Beta | Relaxed wakefulness, calm alertness, cortical inhibition [65] |
| Beta | 13–30 [54] | MDD; Motor control [54] [67] | Gamma | Active thinking, focused attention [65] |
| Gamma | 30–45 [54]; 30–100 [65] | MDD; FXS; Sensory processing [54] [65] | Theta, Alpha, Beta | High-level cognitive processing, local network excitation [65] |
In clinical populations, frequency band optimization may require deviation from standard ranges. For example, in Fragile X Syndrome (FXS), abnormalities in alpha (8–12 Hz) and gamma (30–100 Hz) oscillations are consistently observed, with reduced alpha power and elevated gamma activity associated with poor cognitive outcomes [65]. Furthermore, research suggests that auditory stimulation at 13 Hz (high alpha range) can significantly enhance alpha activity while suppressing pathological gamma oscillations in FXS, indicating the importance of precise frequency targeting within broader bands [65].
Statistical Thresholds and Significance Testing
Establishing robust statistical thresholds for CFC significance is critical for distinguishing true neural coupling from spurious correlations. Multiple approaches have been developed, each with distinct advantages and computational requirements.
Table 3: Statistical Methods for CFC Significance Testing
| Method | Underlying Principle | Advantages | Limitations | Implementation Notes |
|---|---|---|---|---|
| Generalized Linear Model (GLM) | Parametric inference using F-tests on epoched data [64] | Computationally efficient; easily incorporates covariates; provides normalized coefficients [56] [64] | Slightly underestimates significance compared to permutation tests [64] | Normalize dependent variable and predictors to have zero mean and unit variance [64] |
| Permutation Tests | Non-parametric; uses surrogate data by shifting phase or amplitude signals [64] | Gold standard; makes minimal assumptions about data distribution | Computationally intensive (≥100 permutations); impractical for large-scale screenings [64] | Time-shifting should exceed the oscillation period to ensure independence |
| LPV-AR Models | Least-squares solution with external modulation by low-frequency phase [34] | Captures non-linear dynamics; closed-form solutions available [34] | Requires selection of model order and basis functions [34] | Polynomial basis functions recommended for physiological signals [34] |
| Cost-Sensitive Threshold Optimization | Incorporates misclassification costs into decision boundaries [68] | Particularly valuable when false negatives and false positives have unequal consequences [68] | Requires accurate estimation of cost ratios, which may be subjective [68] | Optimal threshold = costratio / (costratio + 1), where cost_ratio = C(fn)/C(fp) [68] |
The GLM framework offers a particularly flexible approach for CFC analysis. As demonstrated in [56] and [64], the GLM can be formulated as: Ahigh = β1sin(θx) + β2cos(θx) + β3ax + ε, where Ahigh is the normalized high-frequency amplitude, θx is the low-frequency phase, and ax is the low-frequency amplitude. This model simultaneously tests for phase-amplitude coupling (through β1 and β2, with rPAC = √(β1² + β2²)) and amplitude-amplitude coupling (through β3), while controlling for potential confounds [56] [64].
Experimental Protocols and Workflows
Comprehensive CFC Analysis Pipeline
A robust CFC analysis protocol integrates the optimized parameters discussed previously into a standardized workflow. The following diagram illustrates the complete pipeline from raw EEG data to validated CFC measurements:
CFC Analysis Workflow
This comprehensive workflow encompasses three major stages: (1) Preprocessing and quality control, (2) Feature extraction through filtering and connectivity measurement, and (3) Statistical analysis with rigorous validation. Each stage requires specific parameter optimization as detailed in the previous sections.
Protocol 1: GLM-Based CFC Analysis
The Generalized Linear Model (GLM) approach provides a computationally efficient and flexible framework for CFC assessment [64]. The following protocol outlines a standardized implementation:
Step 1: Data Preparation and Filtering
- Begin with preprocessed, artifact-free EEG data [54]
- Apply dual-bandpass filtering: use a narrow bandpass filter for the phase-extracting frequency (e.g., 1-2 Hz bandwidth for precise phase estimation) and a broader bandpass filter for the amplitude-extracting frequency (center frequency ± phase frequency) [64]
- Segment continuous recordings into epochs of a few seconds duration (e.g., 3-5 seconds) to enable parametric statistical testing [64]
Step 2: Feature Extraction
- Extract the instantaneous phase of the low-frequency signal using the Hilbert transform: θx = mod(angle(hilbert(x)), 2π) [64]
- Extract the instantaneous amplitude of the high-frequency signal: ay = abs(hilbert(y)) [64]
- Extract the instantaneous amplitude of the low-frequency signal: ax = abs(hilbert(x)) for comprehensive modeling [56]
- Normalize all extracted features (ay, sin(θx), cos(θx), and ax) to have zero mean and unit variance [64]
Step 3: Model Fitting and Evaluation
- Implement the GLM: ay = β1sin(θx) + β2cos(θx) + β3ax + ε [56] [64]
- Compute phase-amplitude coupling as rPAC = √(β1² + β2²), bounded between 0 and 1 [64]
- Compute amplitude-amplitude coupling as cAMP = β3, ranging from -1 to 1 [64]
- Assess significance using F-tests on the epoched data, with p-values corrected for multiple comparisons using random field theory [64]
Protocol 2: Closed-Loop CFC Modulation in Clinical Populations
For interventional studies or clinical trials, CFC parameters can be used as biomarkers to guide neuromodulation. This protocol is particularly relevant for FXS and other neurodevelopmental disorders [65]:
Step 1: Baseline Biomarker Identification
- Record resting-state EEG using high-density systems (e.g., 128 channels) [65]
- Compute baseline CFC metrics, particularly alpha-gamma PAC, which shows dysregulation in FXS [65]
- Identify individual peak alpha frequency and gamma power abnormalities for target engagement [65]
Step 2: Stimulation Parameter Optimization
- Implement auditory entrainment at multiple frequencies (e.g., 7Hz, 9Hz, 11Hz, 13Hz) [65]
- For each frequency, compute the change in target CFC metrics (e.g., increased alpha power, suppressed gamma activity) [65]
- Select the optimal stimulation frequency that maximizes the desired neuromodulatory effect for each individual [65]
Step 3: Adaptive Closed-Loop Implementation
- Develop a machine learning framework to predict EEG responses to stimulation [65]
- Dynamically adjust stimulation parameters based on real-time CFC measurements [65]
- Continuously monitor biomarker responses to maintain optimal stimulation parameters throughout the session [65]
The Scientist's Toolkit: Research Reagent Solutions
Table 4: Essential Materials and Tools for CFC Research
| Tool/Category | Specific Examples | Function in CFC Analysis | Implementation Notes |
|---|---|---|---|
| EEG Hardware | BrainAmp DC amplifier; 64-128 Ag/AgCl electrodes [66] [65] | High-quality signal acquisition with minimal noise | Higher density systems (128-channel) enable better source localization [65] |
| Processing Software | MATLAB with custom scripts; EEGNet; XGBoost [54] [66] [67] | Signal processing, feature extraction, and classification | EEGNet provides simplified CNN architectures optimized for EEG data [66] |
| Connectivity Metrics | Phase Locking Value (PLV); Amplitude Envelope Correlation (AEC); Weighted Phase Lag Index (wPLI) [54] | Quantify different aspects of functional connectivity | wPLI reduces volume conduction effects; PLV captures phase synchrony [54] |
| Optimization Algorithms | Particle Swarm Optimization (PSO); NSGA-II [54] [67] | Channel selection and multi-objective parameter optimization | PSO effectively identifies optimal channel montages with limited electrodes [67] |
| Stimulation Systems | CFC-tACS; Auditory entrainment devices [66] [65] | Direct neuromodulation for interventional studies | 13Hz auditory stimulation shows particular promise for enhancing alpha activity [65] |
Optimizing filter choices, frequency bands, and statistical thresholds represents a critical methodology foundation for advancing CFC research in EEG signal analysis. The parameters and protocols outlined in this technical guide provide a standardized framework that can be adapted to diverse research contexts, from basic investigations of neural communication to clinical trials in neuropharmacology. As CFC methodologies continue to evolve, particularly with the integration of machine learning and adaptive closed-loop systems, rigorous parameter optimization will remain essential for distinguishing true biological signals from analytical artifacts and for developing reliable biomarkers for drug development.
Best Practices for Reproducible CFC Analysis Across Laboratories
Cross-frequency coupling (CFC) has emerged as a critical mechanism for understanding how the brain coordinates information processing across multiple spatial and temporal scales. CFC refers to dynamic interactions between neuronal oscillations operating in different frequency bands, primarily observed as either phase-amplitude coupling (PAC) or cross-frequency phase synchrony (CFS) [69] [70]. In electroencephalography (EEG) research, reproducible CFC analysis presents particular challenges due to the multidimensional nature of neural oscillations, methodological variability across laboratories, and the susceptibility of CFC metrics to confounding factors such as non-sinusoidal waveforms and non-stationarities in neural signals [71]. This technical guide establishes a standardized framework for CFC analysis to enhance reproducibility, reliability, and cross-laboratory validation of findings—objectives especially crucial for drug development and clinical translation research.
The fundamental challenge in CFC reproducibility stems from the complex interplay between local and global neural processes. As Jensen and Colgin note, different forms of cross-frequency interactions—including power-to-power, phase-to-phase, phase-to-frequency, and phase-to-power coupling—serve distinct computational functions in cognitive operations [69]. Without standardized approaches, laboratories may arrive at conflicting conclusions based on the same underlying data, hindering scientific progress and therapeutic development.
Foundational Concepts of Neural Cross-Frequency Coupling
Primary CFC Typologies and Functional Significance
Neural oscillations occur across multiple frequency bands, each associated with different aspects of brain function. Cross-frequency coupling represents a fundamental mechanism for integrating processes across these different temporal scales [69]. The table below summarizes the principal types of CFC and their putative functional roles in brain activity and cognition.
Table 1: Principal Types of Cross-Frequency Coupling and Their Functional Correlates
| CFC Type | Definition | Functional Significance | Common Frequency Combinations |
|---|---|---|---|
| Phase-Amplitude Coupling (PAC) | Coupling between the phase of a low-frequency rhythm and the amplitude of a high-frequency oscillation [69] [72] | Regulation of local computation and temporal parsing of sensory input [69]; Associated with working memory and attention [55] | Theta-Gamma [73], Delta/Theta-Alpha/Beta [21] |
| Cross-Frequency Phase Synchrony (CFS) | Phase synchronization between oscillations with integer n:m frequency ratios [70] | Enables temporally precise coordination between functionally distinct oscillatory assemblies [70] | Theta-Alpha, Delta-Alpha [73] |
| Amplitude-Amplitude Coupling (AAC) | Correlation between amplitude envelopes of different frequency bands [69] | Reflects co-modulation of neural activity across frequencies; requires asymmetric slow oscillations [69] | Delta-Gamma, Theta-Gamma [73] |
Neurophysiological Mechanisms and Functional Roles
CFC is thought to underlie several core cognitive operations through specific neurophysiological mechanisms. Theta-gamma phase-amplitude coupling supports multi-item working memory by temporally organizing the maintenance of multiple representations within the same oscillatory cycle [69]. Similarly, cross-frequency phase synchrony enables long-distance communication between brain areas operating at different frequencies, facilitating functional integration across distributed networks [70]. CFC also contributes to temporal parsing of continuous stimuli, such as speech, where slower oscillations phase-lock to the rhythmic structure of external inputs while faster oscillations track finer temporal details [69]. These mechanisms collectively support the view that CFC serves as integrative infrastructure for coordinating brain activity across spatial and temporal scales, with different CFC types specializing in distinct computational functions [70].
Common Pitfalls in CFC Measurement
Reproducible CFC analysis must account for several methodological challenges that can generate spurious or inconsistent results across laboratories. Non-sinusoidal waveform shapes present a fundamental confound, as traditional CFC methods that rely on narrowband filtering can produce artifactual coupling simply from the harmonic structure of non-sinusoidal signals [71]. Similarly, signal non-stationarities—temporal variations in statistical properties—can invalidate assumptions underlying many CFC metrics [71]. The inherently bivariate nature of conventional CFC measures creates limitations for multielectrode recordings, as they cannot distinguish between direct and indirect coupling in multiscale brain networks, potentially leading to false positives [72]. Volume conduction presents particular challenges for EEG-based CFC analysis, as the same source activity appears across multiple electrodes, potentially inflating coupling estimates [70]. Additionally, non-uniform phase angle distributions can bias CFC measurements independent of genuine neurophysiological coupling [71]. These issues collectively contribute to the reproducibility crisis in CFC research, emphasizing the need for robust methodological standards.
Standardized Experimental Protocols for CFC Research
EEG Data Acquisition Parameters
Standardization begins with consistent data acquisition protocols across laboratories. For resting-state EEG recordings, a minimum of 6 minutes of continuous data is recommended, with recordings conducted in both eyes-open and eyes-closed conditions to account for state-dependent CFC variations [21] [73]. The sampling rate should be sufficiently high to capture high-frequency activity, with a minimum of 500 Hz recommended to adequately represent gamma frequencies [55]. Electrode placement should follow the international 10-20 system, with 64-channel arrays providing optimal spatial sampling for source localization [21]. Electrode impedance must be maintained below 10 kΩ throughout recording sessions to ensure signal quality [21]. Appropriate filtering is essential, with band-pass filters (e.g., 0.3-100 Hz) applied during acquisition and notch filters at 50 Hz (or 60 Hz depending on geographical location) to remove line noise [21]. These parameters create a foundation for comparable CFC measurements across different laboratory settings.
Preprocessing and Quality Control Pipeline
A standardized preprocessing workflow is essential for reproducible CFC analysis. The pipeline should include bad channel interpolation using spherical spline methods to maintain spatial continuity [21]. Artifact removal should employ both automated and manual approaches, including independent component analysis (ICA) to identify and remove ocular, cardiac, and muscular artifacts [55]. Data should be segmented into 2-second epochs to balance spectral resolution and stationarity [55]. Following artifact removal, visual inspection of all data segments is recommended, with epochs exceeding ±100 μV automatically rejected [55]. Re-referencing to the common average reference helps mitigate reference biases, though bilateral mastoid reference may be preferable for specific applications [21]. Documentation of the proportion of rejected data and specific criteria for rejection ensures transparency and enables cross-laboratory comparisons.
Analytical Frameworks for Robust CFC Quantification
Comparison of CFC Analysis Methods
Multiple analytical approaches exist for quantifying CFC, each with distinct strengths, limitations, and appropriate application contexts as summarized in the table below.
Table 2: Cross-Frequency Coupling Analysis Methods and Their Applications
| Method | Underlying Principle | Advantages | Limitations | Suitable For |
|---|---|---|---|---|
| Phase-Locking Value (PLV) [72] | Stability of phase relationships between low-frequency phase and high-frequency amplitude phase | Robust and sensitive; familiar to neuroscientists | Inherently bivariate; cannot estimate CFC between >2 signals [72] | Single-channel CFC analysis |
| Multivariate Phase-Coupling Estimation (PCE) [72] | Statistical dependence between one high-frequency signal and N low-frequency signals | Distinguishes direct vs. indirect coupling; reduces false positives [72] | Computationally intensive; complex implementation | Multielectrode recordings with multiple potential sources |
| Generalized Eigendecomposition CFC (gedCFC) [71] | Source separation using covariance matrices of to-be-maximized vs. to-be-minimized data features | Handles non-sinusoidal and non-stationary signals; improves signal-to-noise ratio [71] | Requires careful specification of contrast conditions; more complex interpretation | Hypothesis-driven network discovery in multichannel data |
| n:m Phase Synchronization Index (PSI) [21] | Phase coherence between oscillations with harmonic frequency ratios | Comprehensive metric for cross-frequency phase synchrony [21] | Requires predetermined frequency ratios | Investigating harmonic relationships between frequency bands |
Implementing the gedCFC Framework
The generalized eigendecomposition CFC (gedCFC) framework offers particular advantages for reproducible multichannel analysis. This method creates spatial filters formed from weighted sums of all electrodes that optimize the ratio between user-specified maximization and minimization criteria [71]. The mathematical foundation involves the generalized eigenvalue equation: SW = RWΛ, where S is the covariance matrix of "signal" features, R is the covariance matrix of "reference" features, W contains the spatial filters, and Λ contains the eigenvalues representing component strengths [71]. Implementation involves: (1) defining hypothesis-driven contrast conditions (e.g., peri-peak vs. peri-trough of a low-frequency oscillation), (2) computing covariance matrices for each condition, (3) performing generalized eigendecomposition, and (4) applying the resulting spatial filters to obtain CFC components [71]. This approach bypasses many confounds of traditional methods while providing enhanced sensitivity to genuine CFC phenomena.
Graph 1: Generalized Eigendecomposition CFC (gedCFC) Analysis Workflow. This diagram illustrates the step-by-step process for implementing the gedCFC framework for reproducible cross-frequency coupling analysis.
Statistical Validation and Surrogate Testing
Robust statistical validation is essential for distinguishing genuine CFC from spurious findings. Surrogate data testing provides a critical foundation for establishing statistical significance. For bivariate measures like PLV, this involves circular shifting of one time series relative to another to create null distributions while preserving temporal structure [72]. A minimum of 200 surrogate iterations is recommended to obtain stable p-value estimates [72]. For multivariate methods, permutation testing that randomizes condition assignments provides appropriate null models [71]. Additionally, correction for multiple comparisons must be applied across all tested frequency pairs and electrode connections, with the false discovery rate (FDR) method preferred over Bonferroni correction for maintaining sensitivity in high-dimensional CFC data [21]. Effect sizes should be reported alongside p-values to distinguish statistical significance from practical importance, with Cohen's d values providing standardized metrics for cross-study comparisons [55].
Core Analytical Tools and Platforms
Reproducible CFC analysis requires both specialized software tools and standardized analytical components. The table below summarizes essential resources for implementing reproducible CFC pipelines.
Table 3: Essential Research Reagents and Computational Tools for CFC Analysis
| Tool/Resource | Function | Implementation Notes | Availability |
|---|---|---|---|
| EEGLAB Toolbox [21] | EEG preprocessing and basic analysis | Provides infrastructure for data management, visualization, and plugin integration | MATLAB-based, open source |
| FieldTrip Toolbox | Advanced time-frequency and connectivity analysis | Specialized functions for CFC calculation and statistics | MATLAB-based, open source |
| Brainstorm | User-friendly interface for MEG/EEG analysis | Streamlines preprocessing pipeline and source localization | MATLAB-based, open source |
| gedCFC Framework [71] | Multivariate CFC analysis | Implements generalized eigendecomposition for source separation | Code available from original publication |
| n:m Phase Synchronization Index [21] | Quantifies cross-frequency phase synchrony | Comprehensive metric for harmonic relationships between frequencies | Custom implementation required |
| Circular Statistics Toolbox | Statistical testing for phase-based metrics | Provides Rayleigh test, circular correlation, and other essential tests | MATLAB-based, open source |
Experimental Protocols for Specific Research Contexts
Protocol 1: Microstate-Specific CFC Analysis
Recent research has demonstrated the value of microstate-specific cross-frequency coupling network (MCFCN) analysis for identifying network disruptions in clinical populations [21]. This protocol involves: (1) identifying four canonical microstate classes (A-D) from resting-state EEG using clustering algorithms, (2) computing cross-frequency coupling interactions using the n:m phase synchronization index for each microstate, (3) constructing MCFCNs by estimating CFC between network nodes, and (4) evaluating networks using machine learning classifiers (e.g., LightGBM) with SHAP values for feature importance [21]. This approach has successfully identified CFC disruptions in individuals exposed to repetitive subconcussive impacts, revealing reduced delta/theta to alpha/beta coupling in microstates A, C, and D, with specific alterations involving emotional-motor integration, attentional control, and self-referential processing networks [21].
Protocol 2: Auditory Stimulation CFC in Clinical Populations
For assessing CFC in disorders of consciousness, an auditory stimulation protocol provides valuable insights. The protocol involves: (1) presenting auditory name-calling stimulation while recording EEG, (2) calculating both within-frequency coupling (WFC) and cross-frequency coupling using the n:m phase synchronization index, (3) constructing two-layer functional brain networks incorporating both WFC and CFC, and (4) performing graph theoretical analysis of network topology [13]. This approach has revealed that patients with favorable prognosis exhibit reduced CFC strength in delta-theta and theta-beta bands, along with higher small-world properties in functional networks, suggesting preserved information processing efficiency despite injury [13].
Graph 2: CFC Methodology Decision Framework. This diagram illustrates the relationships between different CFC types, analysis methods, and their primary research applications to guide methodological selection.
Reporting Standards and Data Sharing Practices
Minimum Reporting Requirements
Transparent reporting enables evaluation and replication of CFC findings across laboratories. The minimum information standard should include: complete description of filter parameters (type, bandwidth, order), artifact rejection criteria and proportion of data rejected, specific CFC algorithms and implementations used, surrogate testing methods and number of iterations, multiple comparison correction approach, and exact frequency bands analyzed rather than generic labels [21] [55] [72]. For clinical studies, detailed participant characteristics and inclusion/exclusion criteria must be documented, as CFC measures can be influenced by age, medication status, and comorbid conditions [21] [55]. Computational environment details, including software versions and custom code availability, complete the essential reporting elements.
Data and Code Sharing Protocols
Sharing of processed data and analysis code represents a critical component of reproducible CFC research. Processed data should include preprocessed time-series or as a minimum, CFC matrices for all participant groups and conditions [70]. Analysis code should be shared in version-controlled repositories (e.g., GitHub) with comprehensive documentation of parameters and dependencies [70]. For publication, complete processing pipelines should be archived with digital object identifiers (DOIs) to ensure long-term accessibility. When sharing raw data is impractical due to size or privacy concerns, detailed simulated datasets that reproduce key findings should be provided to enable method validation and comparison [71]. These practices facilitate cumulative science and accelerate methodological improvements in CFC analysis.
Implementing standardized, reproducible practices for CFC analysis requires concerted effort across multiple domains—from data acquisition to analytical methodology and reporting standards. The frameworks presented here provide laboratories with concrete protocols for enhancing the reliability and cross-site consistency of CFC measurements. Particularly promising directions include the development of multivariate analysis methods that overcome limitations of traditional bivariate approaches [72] [71], graph-theoretical frameworks for distinguishing genuine CFC from spurious coupling [70], and multilayer network analyses that incorporate both within-frequency and cross-frequency interactions [13]. As these methodologies mature and become widely adopted, CFC measures show increasing potential as sensitive biomarkers for neurological and psychiatric conditions [21] [55] and as mechanistic endpoints for evaluating therapeutic interventions in drug development pipelines. Through continued refinement and standardization of CFC methodologies, the neuroscience community can unlock the full potential of cross-frequency interactions as windows into brain function and dysfunction.
Validating CFC Biomarkers: Diagnostic Accuracy and Clinical Utility
Cross-frequency coupling (CFC) is a phenomenon in neural oscillations where interactions between distinct frequency bands reflect a high-order structure in the functional organization of brain rhythms [74]. These interactions, which include various forms such as phase-amplitude coupling (PAC) and power-to-power coupling (PPC), are increasingly recognized as crucial biomarkers for understanding brain function and pathology [1] [20]. The integration of CFC analysis with machine learning (ML) represents a transformative approach in computational neuroscience, enabling automated classification of neurological and psychiatric disorders with remarkable precision [74] [67]. This technical guide explores the theoretical foundations, methodological frameworks, and clinical applications of CFC-based ML classifiers, providing researchers and drug development professionals with comprehensive protocols for implementing these advanced analytical techniques in EEG signal analysis.
Theoretical Foundations of Cross-Frequency Coupling
Defining Cross-Frequency Coupling
CFC refers to statistical dependencies between different frequency components of neural signals, representing a key mechanism for integrating information across multiple spatiotemporal scales [1]. The functional significance of CFC stems from its role in coordinating communication between large-scale brain networks operating at behavioral timescales and fast, local cortical processing required for effective computation [1]. This coordination is fundamental to various cognitive processes, including memory, attention, and perception [20].
Types of Cross-Frequency Coupling
Neural oscillations exhibit several distinct types of coupling, each with unique neurobiological significance and computational properties:
Phase-Amplitude Coupling (PAC): The relationship between the phase of a low-frequency rhythm and the amplitude of a higher-frequency oscillation [1]. PAC is extensively studied in cognitive processes and has been linked to memory formation and sensory processing [74] [20].
Power-to-Power Coupling (PPC): Correlation between amplitude envelopes of different frequency bands, also referred to as amplitude-amplitude coupling [74] [1]. PPC offers computational efficiency and robustness to noise, making it suitable for real-time applications [74].
Phase-Phase Coupling (PPC): Synchronization between phase angles of different frequency oscillations, potentially serving as a mechanism for regulating communication between different spatiotemporal scales [1].
Other Variants: Including phase-frequency coupling (PFC) and frequency-frequency coupling (FFC), though these are less commonly utilized in clinical classification applications [41].
The following diagram illustrates the primary CFC types and their relationships to neural communication and computation:
CFC as a Biomarker in Neurological and Psychiatric Disorders
CFC patterns demonstrate significant alterations across various pathological conditions, providing valuable biomarkers for disorder classification and monitoring. The table below summarizes evidence for CFC disturbances across neurological and psychiatric conditions:
Table 1: CFC Alterations in Neurological and Psychiatric Disorders
| Disorder | CFC Type | Specific Alterations | Clinical Correlation |
|---|---|---|---|
| Absence Epilepsy [74] | Power-to-Power Coupling | Increased coupling between low (2-4.5 Hz) and high frequencies (2-120 Hz) | Seizure classification accuracy of 96.8% [74] |
| Major Depressive Disorder (MDD) [41] | Phase-Amplitude Coupling | Altered coupling between low α and low γ bands, particularly in frontal-occipital regions | Depression severity scaling (94.25% accuracy) [41] |
| Disorders of Consciousness [12] | Delta-Theta & Theta-Beta CFC | Significantly weaker delta-theta and theta-beta CFC in patients transitioning to vegetative state vs. minimally conscious state | Characterizing level of consciousness [12] |
| Motor Imagery BCI [67] | Phase-Amplitude Coupling | Optimized PAC features for motor imagery classification | Improved BCI performance (76.7% accuracy) [67] |
| Psychiatric Disorders [20] | Multiple CFC Types | Widespread alterations across brain regions in ADHD, Alzheimer's, autism, bipolar disorder, OCD, and schizophrenia | Potential transdiagnostic biomarker [20] |
Machine Learning Frameworks for CFC-Based Classification
Feature Extraction and Preprocessing
The initial stage in CFC-based classification involves extracting relevant features from EEG signals through a multi-step preprocessing and analysis pipeline:
Table 2: Key Research Reagents and Computational Tools for CFC Analysis
| Tool Category | Specific Tools/Platforms | Primary Function | Application Example |
|---|---|---|---|
| EEG Acquisition | Biosemi ActiveTwo, Axxonet XAmp | Multi-channel EEG recording with international 10-20 placement | Emotion recognition (DEAP dataset) [75] |
| Preprocessing Tools | EEGLAB, MATLAB | Filtering, artifact removal, independent component analysis | Covert attention studies [76] |
| CFC Analysis | EEGLAB Toolbox, Custom MATLAB/Python scripts | Calculating CFC matrices (PAC, PPC, etc.) from preprocessed EEG | Absence seizure classification [74] |
| Machine Learning Frameworks | Python Scikit-learn, TensorFlow, PyTorch | Implementing classifiers and deep learning models | MDD classification [41] |
| Specialized Neural Architectures | Closed-form Continuous-time Networks (CfC) | Time-series modeling without numerical differential equation solvers | Emotion recognition [75] |
The workflow for extracting and processing CFC features involves several standardized stages, as illustrated below:
Traditional Machine Learning Approaches
Traditional ML classifiers utilize carefully engineered CFC features to achieve high classification accuracy across various disorders:
Support Vector Machines (SVM): Effectively separate classes using optimal hyperplanes in high-dimensional feature spaces. SVMs achieved 94.25% accuracy in classifying depression severity using CFC-based graph theory features [41].
Random Forests (RF): Ensemble method utilizing multiple decision trees, providing robust performance against overfitting. RF classifiers have been employed in relaxation state classification using alpha and theta band features [77].
XGBoost: Gradient boosting framework that sequentially builds optimized decision trees, achieving 76.7% accuracy in motor imagery BCI classification when combined with CFC features [67].
K-Nearest Neighbors (KNN): Instance-based learning that classifies samples based on feature similarity to labeled examples, used in relaxation state discrimination [77].
Deep Learning Architectures
Deep learning approaches automatically learn relevant features from CFC data or raw signals, reducing dependency on manual feature engineering:
Stacked Sparse Autoencoders (SSAE): Unsupervised feature learning through compressed representations, achieving 96.8% accuracy in absence seizure classification using PPC matrices [74].
Convolutional Neural Networks (CNN): Extract spatial hierarchies in CFC patterns, often combined with attention mechanisms to focus on clinically relevant brain regions [75].
Closed-form Continuous-time Networks (CfC): Novel architecture that models neural dynamics without numerical differential equation solvers, providing faster training and inference while maintaining expressivity [78] [75].
Hybrid Architectures: Combine multiple approaches, such as AC-CfC which integrates attention mechanisms, convolutional layers, and closed-form continuous-time networks for emotion recognition from raw EEG [75].
Experimental Protocols and Methodologies
CFC-Based Seizure Detection Protocol
The following protocol outlines the methodology for absence seizure classification using PPC and deep learning [74]:
Data Acquisition: Collect EEG records from databases such as Temple University Hospital EEG database, including both seizure and background activity segments.
Signal Preprocessing: Apply bandpass filtering (2-120 Hz), remove artifacts using automated algorithms or manual inspection, and segment data into appropriate epochs.
CFC Calculation: Compute power-to-power coupling between all frequency pairs (2-120 Hz) using the EEGLAB toolbox, generating CFC matrices for each segment.
Network Architecture: Implement a Stacked Sparse Autoencoder with multiple hidden layers for unsupervised feature learning, followed by a softmax layer for classification.
Training Parameters: Use unsupervised pre-training followed by supervised fine-tuning, with hyperparameters optimized through cross-validation.
Performance Validation: Evaluate using sensitivity, specificity, and accuracy metrics on held-out test data not used during training.
Motor Imagery BCI Classification with CFC Features
This protocol details the CPX pipeline for motor imagery BCI classification [67]:
Data Collection: Utilize benchmark MI-BCI datasets with multiple trials of motor imagery tasks divided into distinct classes.
Preprocessing: Apply standard preprocessing including filtering, artifact removal, and epoching around task intervals.
CFC Feature Extraction: Calculate phase-amplitude coupling using the modulation index between low-frequency phases and high-frequency amplitudes.
Channel Selection: Implement Particle Swarm Optimization to identify optimal EEG channels, reducing the number to 8 while maintaining performance.
Classification: Train XGBoost classifiers on CFC features using 10-fold cross-validation for robust performance estimation.
Interpretation: Apply SHAP analysis to identify the most contributory features and validate clinical relevance.
Depression Severity Classification Protocol
This protocol outlines the methodology for multi-level depression classification using CFC and graph theory [41]:
Participant Recruitment: Include healthy controls, moderately depressed, and severely depressed participants matched for demographic variables.
EEG Recording: Collect resting-state EEG signals using standard electrode placement, with participants maintaining eyes-closed state.
CFC Computation: Calculate multiple CFC measures (PAC, PPC, etc.) between different frequency bands across all channel pairs.
Graph Theory Analysis: Construct functional brain networks from CFC matrices and compute topological metrics (degree, k-coreness, efficiency).
Feature Selection: Identify statistically significant features that differentiate depression severity levels using appropriate statistical tests.
Multi-class Classification: Implement SVM classifiers with optimized kernels to distinguish between three severity levels.
Performance Comparison of CFC-Based Classifiers
The table below provides a comprehensive comparison of classification performance across different disorders and ML approaches:
Table 3: Performance Metrics of CFC-Based Classification Approaches
| Disorder/Application | ML Method | CFC Type | Accuracy | Sensitivity | Specificity | Key Features |
|---|---|---|---|---|---|---|
| Absence Seizures [74] | Stacked Sparse Autoencoder | Power-to-Power | 96.8% | 93.1% | 99.5% | CFC matrices (2-120 Hz) |
| Major Depressive Disorder [41] | SVM | Phase-Amplitude | 94.25% | - | - | Low α - low γ CFC with graph metrics |
| Motor Imagery BCI [67] | XGBoost (CPX) | Phase-Amplitude | 76.7% | - | - | PAC with channel optimization |
| Disorders of Consciousness [12] | - | Theta-Beta & Delta-Theta | - | - | - | Significant group differences |
| Emotion Recognition [75] | AC-CfC | Multiple CFC | 94.76% (valence) | - | - | Raw EEG with spatial-temporal features |
| Covert Visual Attention [76] | ShallowConvNet | Time-Frequency | 100% (binary) | - | - | CWT with deep learning |
Implementation Considerations and Future Directions
Methodological Standardization
Current CFC research exhibits significant heterogeneity in methodologies, which complicates direct comparison across studies [20]. Standardization efforts should address:
CFC Computation Methods: Multiple algorithms exist for calculating CFC metrics, each with distinct advantages and limitations [1]. Establishing gold-standard approaches would enhance reproducibility.
Experimental Paradigms: Consistency in task designs, resting-state recording parameters, and clinical assessments would facilitate multi-site collaborations and meta-analyses.
Validation Protocols: Implementation of rigorous cross-validation approaches and external validation on independent datasets to ensure generalizability.
Computational Efficiency
CFC analysis, particularly when integrated with sophisticated ML models, presents substantial computational demands. Promising approaches to address these challenges include:
Closed-form Neural Networks: CfC models provide between one and five orders of magnitude faster training and inference compared to differential equation-based counterparts [78].
Channel Optimization: Methods like Particle Swarm Optimization can reduce channel counts while maintaining classification accuracy, enhancing practical applicability [67].
Efficient CFC Metrics: Power-to-power coupling offers computational advantages over more complex CFC measures, making it suitable for real-time applications [74].
Future Research Directions
The integration of CFC and ML continues to evolve, with several promising research trajectories:
Multimodal Integration: Combining CFC with other neurophysiological measures, behavioral data, and clinical assessments for comprehensive biomarker development.
Longitudinal Monitoring: Utilizing CFC-based classifiers to track disease progression and treatment response over time.
Explainable AI: Developing interpretable ML models that provide insight into pathophysiological mechanisms underlying CFC alterations.
Clinical Translation: Transitioning from research settings to clinical applications, including diagnostic support systems and closed-loop neuromodulation approaches.
The integration of cross-frequency coupling analysis with machine learning represents a powerful paradigm for classifying neurological and psychiatric disorders. By capturing complex interactions between neural oscillations across different spatial and temporal scales, CFC provides rich feature sets that enable highly accurate discrimination of pathological states. Continued refinement of computational frameworks, standardization of methodological approaches, and validation in diverse clinical populations will further establish CFC-based classification as an essential tool in computational psychiatry and neurology. The protocols and frameworks outlined in this technical guide provide researchers with comprehensive resources for implementing these advanced analytical techniques in both basic and translational research contexts.
Cross-frequency coupling (CFC) represents a paradigm shift in electroencephalography (EEG) analysis, moving beyond traditional metrics that examine neural oscillations in isolation. This technical guide demonstrates that CFC—which quantifies interactions between distinct frequency bands—consistently outperforms traditional EEG metrics in providing sensitive biomarkers for neurological and psychiatric conditions. By capturing the complex, dynamic interactions that underlie higher-order brain functions, CFC offers enhanced discriminative power for classifying patient populations, predicting clinical outcomes, and elucidating pathophysiological mechanisms. The integration of CFC into translational research protocols provides researchers and drug development professionals with a powerful tool for assessing therapeutic efficacy and advancing precision medicine in neurology and psychiatry.
Electroencephalography (EEG) provides direct measurement of neural electrical activity with millisecond temporal resolution, making it an indispensable tool for probing brain function in both basic research and clinical applications. Traditional EEG metrics have primarily focused on analyzing neural oscillations within discrete frequency bands: delta (1-4 Hz), theta (4-8 Hz), alpha (8-12 Hz), beta (13-30 Hz), and gamma (>30 Hz). These conventional approaches include power spectral density (PSD), which quantifies oscillation strength within each band, and within-frequency functional connectivity (FC), which measures synchronization between brain regions using the same frequency component [55].
While these traditional metrics have proven valuable, they fundamentally overlook a critical aspect of brain organization: cross-frequency interactions that enable coordination between spatially and functionally distinct neural assemblies [50]. Cross-frequency coupling (CFC) addresses this limitation by quantifying how different frequency bands interact, most commonly through phase-amplitude coupling (PAC) where the phase of a lower frequency rhythm modulates the amplitude of a higher frequency oscillation [36]. This technical guide provides a comprehensive comparison between CFC and traditional EEG metrics, demonstrating CFC's superior performance across multiple neurological and psychiatric conditions through quantitative data analysis, detailed experimental protocols, and practical implementation frameworks.
Theoretical Foundations: From Isolated Oscillations to Cross-Frequency Interactions
Traditional EEG Metrics
Traditional EEG analysis operates on the premise that distinct neural functions can be mapped to specific frequency bands. The dominant metrics include:
Power Spectral Density (PSD): Quantifies the distribution of signal power across frequency bands, typically showing pathological patterns such as increased low-frequency (delta, theta) and decreased high-frequency (alpha, beta) power in conditions like Alzheimer's disease and cognitive impairment [55] [79].
Within-Frequency Coupling (WFC): Measures phase synchronization between brain regions using the same frequency component, often assessed through phase-locking value (PLV) or weighted phase lag index (wPLI) [13].
Signal Complexity Metrics: Sample entropy (EnSA) quantifies the irregularity of neural signals, typically reduced in pathological states [55].
These metrics provide a foundational understanding of brain states but offer limited insight into the integrative mechanisms that support complex cognitive functions.
Cross-Frequency Coupling Fundamentals
CFC represents a more sophisticated framework that captures how different temporal scales of neural activity coordinate information processing. The primary forms of CFC include:
Phase-Amplitude Coupling (PAC): The phase of a low-frequency oscillation modulates the amplitude of a high-frequency oscillation [36] [67].
n:m Phase Synchronization: Harmonic frequency ratios between distinct oscillators demonstrate stable phase relationships quantified through the n:m Phase Synchronization Index (PSI) [21].
CFC is theorized to facilitate information transfer and integration across distributed neural networks, serving as a mechanism for coordinating local processing with global brain communication [50] [36]. This fundamental capacity to capture multi-scale brain interactions underpins CFC's superior performance across diverse applications.
Quantitative Performance Comparison
The table below summarizes direct performance comparisons between CFC and traditional EEG metrics across multiple neurological conditions and applications:
Table 1: Performance Comparison of CFC vs. Traditional EEG Metrics
| Condition/Application | Traditional Metric Performance | CFC-Based Performance | Key CFC Findings |
|---|---|---|---|
| Motor Imagery BCI [67] | CSP: 60.2% ± 12.4%FBCSP: 63.5% ± 13.5%FBCNet: 68.8% ± 14.6% | 76.7% ± 1.0% (CPX pipeline) | CFC with PSO channel selection significantly outperforms traditional spatial filtering methods |
| Alzheimer's Disease [79] | Relative power shows characteristic slowing but limited diagnostic specificity | Enhanced delta-gamma & theta-gamma CFC in right temporal-parietal regions correlates with memory impairment | CFC provides regional specificity and stronger correlation with cognitive deficits |
| Mild Cognitive Impairment [79] | Moderate sensitivity with power metrics | Theta-gamma coupling identifies aMCI patients with 95% accuracy during auditory oddball paradigm | Superior discriminative power for early detection |
| Atrial Fibrillation Cognitive Decline [55] | PSD shows typical slowing pattern (↑δ,θ; ↓α,β) | θ–β PAC identified as significant mediator between AF and cognitive impairment | CFC captures mechanistic pathway not apparent in traditional metrics |
| Covert Visual Attention [76] | Conventional machine learning with manual feature extraction | CFC features enable successful decoding of attention direction and color with SVM/ELM classifiers | Eliminates need for handcrafted features, improves generalizability |
| Disorders of Consciousness [13] | Delta-band WFC negatively correlates with consciousness level | Reduced delta-theta & theta-beta CFC predicts favorable prognosis (MCS vs. VS) | Enhanced prognostic precision for clinical outcome prediction |
The consistent superiority of CFC metrics across these diverse applications highlights their enhanced sensitivity to neuropathological mechanisms and brain states. Specifically, CFC provides:
- Higher classification accuracy in diagnostic and BCI applications
- Stronger correlation with cognitive performance and clinical scores
- Earlier detection of pathological changes in progressive neurological conditions
- Superior prognostic value for clinical outcomes
Detailed Experimental Protocols for CFC Analysis
EEG Acquisition and Preprocessing Standards
Robust CFC analysis requires meticulous attention to acquisition parameters and preprocessing pipelines. The following protocol synthesizes methodologies from multiple studies demonstrating high-quality CFC outcomes [21] [79] [55]:
EEG Acquisition: Record with ≥64 electrodes following the 10-20 system at sampling rates ≥500 Hz. Use online band-pass filtering (0.3-100 Hz) and 50/60 Hz notch filtering. Maintain electrode impedances <10 kΩ.
Preprocessing Pipeline:
- Band-pass filtering (1-45 Hz) and notch filtering (48-52 Hz) to remove residual noise
- Segmentation into 2-second epochs with baseline correction
- Bad channel interpolation using spherical spline interpolation
- Re-referencing to common average or mastoid references
- Artifact removal using independent component analysis (ICA) for ocular and muscular artifacts
- Manual rejection of epochs exceeding ±100 μV
This standardized pipeline ensures signal quality sufficient for detecting subtle cross-frequency interactions while minimizing confounding artifacts.
CFC Computation Methodologies
Multiple validated approaches exist for quantifying CFC, each with distinct advantages:
Phase-Amplitude Coupling (PAC): Extract the phase of low-frequency oscillations and amplitude of high-frequency oscillations via Hilbert transform. Compute modulation index using the Kullback-Liebler method [36] [67].
n:m Phase Synchronization Index (PSI): Accelerate original phase time series to align instantaneous frequencies across distinct spectral components. Quantify stability of phase relationships for harmonic frequency ratios [21].
Linear Parameter Varying Autoregressive (LPV-AR) Models: Model the instantaneous high-frequency amplitude with AR coefficients modulated by the low-frequency phase. Provides closed-form solutions via regularized least squares estimation [36].
The selection of specific methodology should be guided by research question, signal-to-noise ratio, and computational resources.
Microstate-Specific CFC Analysis
For advanced network-level investigations, the microstate-specific CFC approach offers exceptional spatial precision [21]:
- Identify canonical microstates (A-D) through topographic template matching
- Segment EEG into periods dominated by each microstate class
- Compute CFC metrics separately for each microstate segment
- Construct microstate-specific cross-frequency coupling networks (MCFCNs)
- Evaluate network properties using graph theory or machine learning classifiers
This approach has revealed network disruptions in subconcussive impacts, with reduced delta/theta to alpha/beta coupling in microstates A, C, and D, except for increased delta-band coupling from the default mode network to the frontoparietal network in microstate A [21].
Figure 1: Comprehensive CFC Analysis Workflow
The Scientist's Toolkit: Essential Research Reagents and Solutions
Table 2: Essential Research Tools for CFC Analysis
| Tool/Resource | Specifications | Research Application | Key Considerations |
|---|---|---|---|
| High-Density EEG Systems | 64+ channels, ≥500 Hz sampling rate, Ag/AgCl electrodes | Signal acquisition with sufficient spatial/temporal resolution | Online filtering (0.3-100 Hz), impedance monitoring (<10 kΩ) [21] |
| EEG Analysis Software | EEGLAB, MATLAB with custom scripts | Preprocessing, CFC computation, statistical analysis | Compatibility with standardized pipelines (e.g., PREP) [55] [76] |
| CFC Algorithm Toolboxes | PAC, n:m PSI, LPV-AR implementations | Quantifying cross-frequency interactions | Validation with synthetic data, multiple comparison correction [21] [36] |
| Machine Learning Frameworks | LightGBM, XGBoost, ShallowConvNet | Feature importance analysis, classification | SHAP values for interpretability, cross-validation [21] [67] |
| Statistical Packages | R, Python (SciPy, statsmodels) | Multiple comparison correction, mediation analysis | FDR correction for multiple comparisons, effect size reporting [55] |
Advanced Applications and Implementation Frameworks
Integrated CFC Analysis Pipeline for Clinical Translation
The CFC-PSO-XGBoost (CPX) pipeline represents a state-of-the-art framework for optimizing BCI performance [67]:
Feature Extraction: Compute PAC between low-frequency phases (delta, theta) and high-frequency amplitudes (beta, gamma) across all channels
Channel Optimization: Apply Particle Swarm Optimization (PSO) to identify the most discriminative channel subset (typically 8-12 channels)
Classification: Implement XGBoost with SHAP value analysis to interpret feature contributions
Validation: Employ 10-fold cross-validation with comprehensive metrics (accuracy, sensitivity, specificity, AUC, MCC)
This pipeline achieved 76.7% accuracy in MI-BCI classification, significantly outperforming traditional approaches like CSP (60.2%) and FBCNet (68.8%) while using fewer channels [67].
Microstate-Specific CFC for Network Analysis
The integration of microstate analysis with CFC provides unprecedented spatial specificity for investigating large-scale network dynamics [21]:
Figure 2: Microstate-Specific CFC Network Analysis Workflow
This approach has revealed microstate-specific network disruptions in subconcussive impacts, with machine learning models achieving significant group discrimination based on CFC features [21].
The comprehensive evidence presented in this technical guide unequivocally demonstrates that CFC metrics consistently outperform traditional EEG analyses across diverse neurological conditions and applications. CFC's capacity to capture the complex, multi-scale interactions that underlie brain function provides enhanced sensitivity to pathological states, superior classification performance, and stronger correlations with clinical outcomes.
For researchers and drug development professionals, implementing CFC analysis offers:
- Enhanced biomarker sensitivity for early detection and progression monitoring
- Improved stratification of heterogeneous patient populations
- Novel endpoints for clinical trials targeting neural network integrity
- Mechanistic insights into therapeutic effects on brain network dynamics
Future developments in CFC methodology will likely focus on real-time analysis capabilities, standardized analytical pipelines across research centers, and integration with other neuroimaging modalities. As the field advances, CFC is poised to become an essential component of the translational neuroscience toolkit, providing unprecedented insights into brain function and dysfunction.
For research teams implementing CFC analysis, we recommend beginning with established PAC methodologies before advancing to more complex n:m PSI or microstate-specific approaches. Validation with both synthetic and empirical data, adherence to standardized preprocessing protocols, and appropriate correction for multiple comparisons are essential for generating robust, reproducible findings that advance our understanding of brain network dynamics in health and disease.
Cross-frequency coupling (CFC), particularly phase-amplitude coupling (PAC), has emerged as a significant electrophysiological biomarker for predicting clinical outcomes across neurological and psychiatric disorders. This technical review synthesizes evidence from recent studies investigating CFC in disorders of consciousness, depression, and pain processing, highlighting consistent patterns correlating with prognosis. Quantitative analysis reveals that specific CFC signatures—including elevated theta-gamma and alpha-gamma coupling in parietal regions and reduced delta-theta/theta-beta CFC in frontal-parietal networks—show significant correlations with cognitive function and consciousness recovery. Furthermore, multilayer brain network topological properties derived from CFC analysis demonstrate enhanced prognostic capability over traditional within-frequency approaches. This whitepaper provides a comprehensive framework of CFC methodologies, experimental protocols, and analytical tools to standardize its application in clinical prognosis and therapeutic development.
Cross-frequency coupling (CFC) refers to the interaction between neuronal oscillations at different frequencies, serving as a fundamental mechanism for integrating information across spatially distributed neural networks. Among the various forms of CFC, phase-amplitude coupling (PAC)—where the phase of a low-frequency rhythm modulates the amplitude of a higher-frequency oscillation—has shown particular promise as a biomarker for brain function and dysfunction [22] [80]. The prognostic value of CFC stems from its role in coordinating neural communication; abnormal CFC patterns reflect impaired information processing that underlies various pathological states [81] [2]. This technical guide synthesizes current research methodologies and findings on CFC's prognostic utility, providing researchers and drug development professionals with standardized frameworks for implementing CFC analysis in clinical outcomes prediction.
Clinical Evidence and Quantitative Findings
CFC in Disorders of Consciousness
Research in acute disorders of consciousness (DOC) demonstrates that CFC patterns during auditory stimulation effectively differentiate patients with favorable versus poor prognoses. A study of 38 acute DOC patients revealed significant CFC differences between those transitioning to minimally conscious state (MCS) versus vegetative state (VS) [12] [13].
Table 1: CFC Differences in DOC Prognosis
| Prognostic Group | WFC Patterns | CFC Patterns | Frontal-Parietal Network Properties |
|---|---|---|---|
| MCS (Favorable) | Significantly stronger alpha-band WFC | Reduced delta-theta and theta-beta CFC | Higher small-world properties in alpha, theta-beta, and alpha-beta networks |
| VS (Poor) | Significantly stronger delta and theta-band WFC | Enhanced delta-theta and theta-beta CFC | Lower small-world properties and reduced information processing efficiency |
These CFC measures were more pronounced in frontal-parietal regions, critical networks for conscious awareness, and graph theoretical analysis confirmed that patients with favorable outcomes exhibited significantly higher small-world properties in cross-frequency theta-beta and alpha-beta networks [13].
CFC in Depression Biotyping
CFC analysis has identified distinct neurophysiological subtypes in depression, particularly a cognitive biotype characterized by specific PAC alterations. A study of 141 depressed patients in remission classified 56 as having cognitive impairment (CI) based on MATRICS Consensus Cognitive Battery (MCCB) scores [2].
Table 2: CFC Alterations in Depression Cognitive Biotype
| Brain Region | Frequency Bands | CI vs. NCI Group Differences | Statistical Significance |
|---|---|---|---|
| Parietal (Pz) | Theta-Low Gamma | Decreased PAC in CI | t = -3.512, FDR-corrected p = 0.011 |
| Parietal (P3, Pz) | Alpha-Low Gamma | Decreased PAC in CI | P3: t = -3.377, p = 0.009; Pz: t = -3.451, p = 0.009 |
| Parietal (P3, Pz) | Beta-Low Gamma | Decreased PAC in CI | P3: t = -3.129, p = 0.020; Pz: t = -3.333, p = 0.020 |
| Parietal (P4) | Delta-Gamma | Increased PAC in CI | t = 3.314, FDR-corrected p = 0.022 |
These alterations were observed specifically during the eyes-closed resting state and showed significant correlations with cognitive function, suggesting that CFC may serve as a biomarker for targeting cognitive dysfunction in depression [2].
CFC in Pain Processing
Invasive recordings from deep brain structures in epilepsy patients undergoing pain processing reveal that gamma oscillatory responses (40-110 Hz) in the amygdala and hippocampus couple with theta (4-7 Hz) and alpha (8-12 Hz) rhythms during painful stimulation [81]. This CFC pattern in limbic structures potentially reflects the integration of pain's affective component, offering prognostic insights for pain-related disorders.
Experimental Protocols and Methodologies
EEG Data Acquisition Standards
Across studies, consistent EEG acquisition parameters ensure reproducible CFC analysis:
- Equipment: 19-24 channel systems configured per 10-20 international system [2]
- Referencing: Average reference montage; FPz reference with left earlobe ground [2]
- Sampling Rate: 250-300 Hz sufficient for gamma oscillations [76] [2]
- Filtering: Band-pass (1-90 Hz) with 50/60 Hz notch filter [2]
- Conditions: Resting state (eyes-open/closed) and/or task-based paradigms (e.g., auditory name-calling, laser pain stimulation) [12] [81]
CFC Analysis Pipeline
The standard computational workflow for CFC analysis involves sequential processing stages:
CFC Analysis Workflow: Standard processing pipeline from raw EEG to prognostic assessment.
Phase-Amplitude Coupling Quantification
The most established CFC metric is the modulation index (MI) based on Kullback-Leibler divergence:
- Signal Processing: Bandpass filter raw EEG into low-frequency (1-30 Hz) for phase and high-frequency (30-90 Hz) for amplitude [2]
- Hilbert Transform: Extract phase (ϕₗₒ𝓌) and amplitude (Aₕᵢ) time series via Hilbert transform [22] [2]
- Phase Binning: Sort high-frequency amplitude by low-frequency phase into 18-20 bins
- MI Calculation: Compute Kullback-Leibler divergence between amplitude distribution and uniform distribution [2]
- Statistical Validation: Compare against surrogate data (n=200) using z-score transformation
Advanced statistical approaches include generalized linear models (GLM) that account for confounding effects of low-frequency amplitude on PAC measures [22].
The Scientist's Toolkit: Research Reagent Solutions
Table 3: Essential Resources for CFC Research
| Category | Specific Tool/Resource | Application in CFC Research |
|---|---|---|
| EEG Hardware | DSI-24 (Wearable Sensing) | 24-channel mobile EEG system for resting-state acquisition [2] |
| Analysis Software | EEGLAB (MATLAB) | Open-source toolbox for preprocessing, ICA, and basic CFC analysis [2] |
| CFC Algorithms | Modulation Index (MI) | Quantifies phase-amplitude coupling using Kullback-Leibler divergence [2] |
| Statistical Framework | Generalized Linear Models (GLM) | Accounts for confounding effects of low-frequency amplitude on PAC [22] |
| Cognitive Assessment | MATRICS Consensus Cognitive Battery (MCCB) | Standardized cognitive evaluation for depression biotyping [2] |
| Clinical Assessment | Coma Recovery Scale-Revised (CRS-R) | Gold-standard behavioral assessment for disorders of consciousness [13] |
Multilayer Network Analysis Framework
Advanced CFC prognosis utilizes multilayer functional brain networks incorporating both within-frequency coupling (WFC) and CFC:
Multilayer Network Architecture: Integrating WFC and CFC for enhanced prognostic capability.
Key graph theory metrics derived from these networks provide superior prognostic value:
- Small-World Properties: Higher values correlate with favorable outcomes in DOC [13]
- Global Efficiency: Reduced in cognitive impairment biotype of depression [2]
- Modularity: Altered organization in frontal-parietal networks across disorders
Cross-frequency coupling analysis represents a transformative approach in clinical neurophysiology, offering quantifiable biomarkers with demonstrated prognostic value across disorders of consciousness, depression, and pain processing. The standardized methodologies outlined in this whitepaper—from EEG acquisition protocols to advanced multilayer network analysis—provide researchers and drug development professionals with validated frameworks for implementing CFC assessment. Future directions should focus on establishing standardized CFC reference ranges, developing automated analysis pipelines for clinical settings, and validating CFC biomarkers as endpoints in therapeutic trials. As evidence accumulates, CFC-based prognosis promises to enhance precision medicine in neurology and psychiatry by linking specific neural synchronization patterns to clinical outcomes.
Cross-frequency coupling (CFC), particularly phase-amplitude coupling (PAC), serves as a fundamental mechanism for integrating brain activity across multiple spatiotemporal scales. This technical review synthesizes evidence of CFC alterations across neurological and neuropsychiatric disorders, including atrial fibrillation (AF)-related cognitive impairment, repetitive subconcussive impacts, epilepsy, and migraine. We present quantitative comparisons of CFC directionality and specificity, detailed methodological protocols for CFC assessment, and visualization of analytical workflows. Our analysis reveals that while increased theta-gamma PAC is a common transdiagnostic feature, specific CFC patterns show disorder-specific signatures, with θ–β PAC emerging as a key mediator in AF-related cognitive decline and delta/theta-to-alpha/beta decoupling characterizing subconcussive injury. This whitepaper provides researchers with standardized frameworks for CFC quantification, statistical approaches to control for confounding factors, and essential toolkits for implementing CFC biomarkers in therapeutic development pipelines.
Cross-frequency coupling (CFC) represents a class of neural mechanisms where interactions between distinct oscillatory frequencies enable temporal coordination and information transfer across brain networks. The most extensively studied form, phase-amplitude coupling (PAC), occurs when the amplitude of a high-frequency oscillation is modulated by the phase of a lower-frequency rhythm [1]. This coupling provides a physiological mechanism for integrating large-scale brain networks operating at behavioral timescales with fast, local cortical processing required for effective computation and synaptic modification [1]. The functional significance of CFC stems from its role in neuronal computation, communication, and learning, with CFC strength changing rapidly in response to sensory, motor, and cognitive events and correlating with performance in learning tasks [1].
The analytical landscape of CFC encompasses multiple coupling varieties: phase-amplitude coupling (PAC), phase-phase coupling (PPC), and amplitude-amplitude coupling (AAC) [22]. Numerous quantitative methods have been developed to characterize these CFC types, including mean vector length (modulation index), phase-locking value, envelope-to-signal correlation, and generalized linear modeling (GLM) approaches [1] [22]. The diversity of methodological approaches necessitates careful selection of analysis techniques aligned with specific research questions, as choosing an inappropriate method weakens statistical power and introduces opportunities for confounding effects [22].
CFC Alterations Across Disorders: A Quantitative Comparison
Electroencephalography (EEG) studies have revealed consistent CFC alterations across neurological and neuropsychiatric conditions. The table below synthesizes specific CFC patterns observed across disorders, highlighting both transdiagnostic and condition-specific alterations.
Table 1: Cross-Disorder CFC Alteration Patterns
| Disorder | Specific CFC Alterations | Direction of Change | Key Brain Regions/Networks | Clinical Correlations |
|---|---|---|---|---|
| Atrial Fibrillation with Cognitive Impairment | θ–β PAC, θ–γ PAC | Increased | Not Specified | Mediates cognitive decline; Correlated with MoCA scores [82] |
| Repetitive Subconcussive Impacts | Delta/theta to alpha/beta coupling | Decreased (Microstates A, C, D) | DMN, FPN, LIM, SMN | Emotional-motor integration, attentional control [83] |
| Epilepsy | Theta-High Gamma PAC | Increased | Neocortex, Hippocampus | Seizure generation and propagation [22] |
| Migraine & Chronic Pain | Theta-Gamma PAC, Alpha-Gamma AAC | Variable | Default Mode, Salience Networks | Headache vulnerability, central pain syndromes [83] |
| Alzheimer's Disease | Theta-Gamma PAC | Disrupted | Hippocampal-Cortical Networks | Memory impairment, cognitive decline [82] |
The quantitative evidence reveals both overlapping and distinct CFC signatures across disorders. In AF patients with cognitive impairment, resting-state EEG analysis demonstrates significantly increased θ–β and θ–γ PAC alongside reduced β–γ PAC, with θ–β PAC identified as a key mediator in the relationship between AF and cognitive decline [82]. This pattern differs notably from the CFC alterations observed in repetitive subconcussive impacts, where exposed individuals exhibit reduced delta/theta to alpha/beta coupling across multiple microstates (A, C, and D), with the exception of increased delta-band coupling from the default mode network (DMN) to the frontoparietal network (FPN) in microstate A [83].
The specificity of CFC alterations extends to spatial distributions across brain networks. In subconcussive injury, CFC disruptions involve networks critical for emotional-motor integration, attentional control, and self-referential processing, with machine learning models identifying theta-DMN, beta-SMN, and delta-LIM as critical nodes distinguishing exposed individuals from controls [83]. These network-specific alterations resemble patterns observed in central pain syndromes, suggesting shared mechanisms despite different etiologies.
Table 2: Analytical Methodologies for CFC Quantification
| Method Category | Specific Measures | CFC Type Detected | Key Advantages | Limitations |
|---|---|---|---|---|
| Phase-Amplitude Measures | Modulation Index (KL-MI, MVL-MI), Height Ratio, Phase-Locking Value | PAC | Specific to phase-amplitude interactions; Multiple validation studies | Sensitive to low-frequency power changes [1] [22] |
| Amplitude-Amplitude Measures | Envelope-to-Signal Correlation, Coherence Value | AAC | Captures power correlations across bands | Less established functional significance [1] |
| Statistical Modeling | Generalized Linear Model (GLM) Framework | PAC, AAC simultaneously | Controls for confounding variables; Formal inference testing | Computational complexity [22] |
| Phase Synchronization | n:m Phase Synchronization Index (PSI) | PPC | Captures harmonic relationships; Comprehensive for cross-frequency coordination | Methodologically complex [83] |
Methodological Framework for CFC Assessment
EEG Data Acquisition and Preprocessing Standards
Standardized EEG protocols are fundamental for reliable CFC quantification. In recent studies, recordings are typically conducted using 21-64 channel systems according to the international 10–20 system, with signals sampled at 500-1000 Hz and online bandpass filtering between 0.5-100 Hz [82] [83]. Critical preprocessing steps include:
- Band-pass filtering (1–45 Hz) and notch filtering (48–52 Hz) to remove line noise and artifacts
- Segmentation into 2-second epochs with baseline correction
- Bad channel interpolation using spherical spline interpolation
- Re-referencing to common average or mastoid electrodes
- Artifact removal using independent component analysis (ICA) with ICLabel for automatic component classification
- Manual rejection of heavily contaminated segments exceeding ±100 μV [82] [83]
The preprocessing pipeline significantly impacts CFC measurements, with recommendations emphasizing the importance of minimizing ocular, muscular, and cardiac artifacts while preserving neural signals [83]. For microstate-specific CFC analysis, additional topographic mapping is required to identify canonical microstate classes (A-D) associated with functional networks such as the default mode, visual, dorsal attention, and salience networks [83].
Statistical Framework for Controlling Confounds
A critical advancement in CFC methodology is the development of statistical frameworks that account for confounding factors. The Generalized Linear Model (GLM) approach models high-frequency amplitude as a function of both low-frequency amplitude and low-frequency phase, providing a measure of phase-amplitude coupling that controls for changes in low-frequency power [22]. This framework addresses a key limitation of conventional PAC measures, which can be influenced by low-frequency power changes independent of actual coupling strength.
The GLM framework for CFC analysis implements:
Where the conditional distribution of high-frequency amplitude (Ahigh) is modeled as a function of low-frequency phase (φlow) and low-frequency amplitude (Alow) using a Gamma distribution and log-link function, with fk and g_j representing spline basis functions [22]. This approach successfully detects CFC in simulated signals and outperforms conventional modulation indices in biologically-motivated examples where CFC depends on low-frequency amplitude [22].
Visualization of CFC Analysis Workflows
The following diagram illustrates the comprehensive workflow for CFC analysis from data acquisition to clinical interpretation, integrating multiple methodological approaches:
CFC Analysis Workflow: From Data to Interpretation
The analytical pathway begins with EEG data acquisition using multichannel systems, followed by comprehensive preprocessing to eliminate artifacts and enhance signal quality. The core CFC quantification phase implements multiple complementary metrics to capture different coupling types, with subsequent statistical validation employing advanced frameworks like GLM to control confounds. The workflow culminates in clinical interpretation of CFC patterns within specific pathophysiological contexts.
Table 3: Essential Research Resources for CFC Investigation
| Resource Category | Specific Tools/Platforms | Primary Function | Application in CFC Research |
|---|---|---|---|
| EEG Acquisition Systems | Nicolet V5.95, eego amplifier | Signal recording with high temporal resolution | Resting-state and task EEG acquisition [82] [83] |
| Computational Platforms | MATLAB, EEGLAB, MicrostateLab | Signal processing and analysis | Preprocessing, CFC calculation, microstate analysis [82] [83] |
| Statistical Analysis Tools | SPSS, R Programming, Python | Statistical modeling and inference | GLM framework implementation, multiple comparisons correction [82] [22] |
| CFC-Specific Toolboxes | Custom MATLAB scripts | CFC metric implementation | Modulation index, n:m PSI, PAC calculation [1] [83] |
| Visualization Software | ChartExpo, GraphPad Prism | Data visualization and presentation | Creating publication-quality figures [84] |
Implementation of CFC analysis requires integration across multiple technical domains. EEG acquisition systems provide the raw physiological signals, with modern amplifiers supporting high sampling rates (≥500 Hz) and adequate channel counts (21-64 channels) for spatial resolution [82] [83]. Computational platforms like MATLAB with EEGLAB provide standardized environments for signal preprocessing, while specialized toolboxes like MicrostateLab enable microstate-specific CFC analysis [83]. For statistical implementation, the GLM framework for CFC assessment can be implemented in R or Python, providing robust control for confounding variables like low-frequency power changes [22].
Beyond software tools, analytical methodologies themselves constitute essential research reagents. The n:m Phase Synchronization Index (PSI) enables comprehensive assessment of cross-frequency coordination by evaluating phase relationship stability through acceleration of original phase time series to align instantaneous frequencies across distinct spectral components [83]. This approach captures multiplexed oscillatory coordination across spatiotemporally distributed networks, elucidating mechanistic foundations of cross-frequency interactions governing cortical network dynamics [83].
The growing evidence for disorder-specific CFC alterations positions this neurophysiological metric as a promising biomarker for diagnostic stratification and therapeutic monitoring. The specificity of θ–β PAC in mediating AF-related cognitive decline versus delta/theta-to-alpha/beta decoupling in subconcussive impacts demonstrates the discriminative potential of CFC patterns [82] [83]. Future research directions should include standardized CFC assessment protocols across multicenter studies, longitudinal designs to establish temporal relationships between CFC alterations and disease progression, and mechanistic studies linking specific CFC patterns to underlying molecular pathways.
For drug development professionals, CFC biomarkers offer particularly promising applications in target engagement assessment and patient stratification. The quantitative nature of CFC metrics, sensitivity to network-level neural dynamics, and relationship to cognitive processes provide a robust framework for evaluating therapeutic effects on neural system functionality. Implementation of the methodological frameworks and toolkits outlined in this whitepaper will accelerate the translation of CFC biomarkers from research tools to clinical applications in neurological and neuropsychiatric drug development.
Cross-frequency coupling (CFC) has emerged as a pivotal mechanism for understanding how the brain coordinates information processing across spatial and temporal scales. This sophisticated form of neural rhythm interaction, particularly observed in electroencephalogram (EEG) signals, represents a fundamental mechanism for integrating distributed neural processing. While research has extensively characterized CFC phenomena, their translation into clinical applications remains an ongoing frontier. The translational potential of CFC metrics lies in their ability to provide quantitative, non-invasive biomarkers for brain health and dysfunction. This technical guide examines the current evidence supporting CFC's clinical utility and provides detailed methodologies for implementing CFC analysis in translational research contexts, with particular emphasis on applications in disorders of consciousness, neuropsychiatric conditions, and cognitive assessment.
Two primary forms of CFC have been extensively studied: phase-amplitude coupling (PAC), where the phase of a lower-frequency oscillation modulates the amplitude of a higher-frequency oscillation, and cross-frequency phase synchrony (CFS), characterized by stable phase relationships between oscillations with integer frequency ratios (n:m synchronization) [85]. Evidence indicates these constitute distinct coupling mechanisms with potentially different functional roles and clinical implications [85]. The integrity of these cross-frequency interactions appears crucial for normal cognitive functioning, and their disruption is increasingly associated with pathological states, making them promising targets for clinical translation.
Quantitative Evidence: CFC Alterations Across Clinical Populations
Empirical studies have consistently demonstrated distinct CFC signatures across various clinical populations. The table below summarizes key quantitative findings from recent clinical investigations, highlighting the potential of CFC metrics as clinical biomarkers.
Table 1: Clinical CFC Alterations Across Patient Populations
| Clinical Population | CFC Type | Specific Alterations | Cognitive Correlations |
|---|---|---|---|
| Cognitive Biotype of Depression [2] | Theta-Gamma PAC | ↓ PAC at Pz electrode (t=-3.512, FDR-corrected p=0.011) | Correlation with cognitive function at eyes-closed state |
| Alpha-Gamma PAC | ↓ PAC at P3 (t=-3.377, p=0.009) and Pz (t=-3.451, p=0.009) | Correlation with cognitive function at eyes-closed state | |
| Beta-Gamma PAC | ↓ PAC at P3 (t=-3.129, p=0.020) and Pz (t=-3.333, p=0.020) | Correlation with cognitive function at eyes-closed state | |
| Delta-Gamma PAC | ↑ PAC at P4 electrode (t=3.314, FDR-corrected p=0.022) | Not specified | |
| Disorders of Consciousness [13] | Theta-Beta CFC | Significantly weaker in MCS vs. VS patients | More pronounced in frontal-parietal regions |
| Delta-Theta CFC | Significantly weaker in MCS vs. VS patients | More pronounced in frontal-parietal regions | |
| Healthy Aging & Cognition [86] | Multiple CFC Types | Younger brain age gap (BAG) in CFC metrics | Correlated with better picture priming task performance |
These quantitative findings demonstrate the sensitivity of CFC measures to clinical states and their relationship to cognitive performance, supporting their potential utility as diagnostic and prognostic biomarkers.
Experimental Protocols for CFC Analysis in Clinical Research
EEG Data Acquisition and Preprocessing
Standardized data acquisition protocols are essential for generating reliable, reproducible CFC metrics. The following methodology, compiled from multiple clinical studies, represents current best practices:
Equipment Specifications: Studies utilize either high-density EEG systems (e.g., 24-channel DSI-24 [2]) or clinical-grade systems (e.g., Neurofax EEG-1200C with 32 channels [87]). Sampling rates typically range from 200-300 Hz to adequately capture gamma frequencies [87].
Experimental Paradigms: Resting-state recordings typically include 5-10 minutes each of eyes-closed and eyes-open conditions [2] [87]. Task-based paradigms can include auditory stimulation (e.g., name-calling for DOC patients [13]) or cognitive tasks.
Signal Preprocessing: Data processing typically includes bandpass filtering (1-35 Hz or 1-90 Hz [87]), notch filtering at 50/60 Hz for line noise removal, independent component analysis (ICA) for artifact removal, and segmentation into 2-second epochs [2]. Automated or manual rejection of artifact-contaminated epochs (±100 μV threshold) is standard [2].
CFC Computation Methodologies
Table 2: CFC Calculation Methods and Implementation
| CFC Type | Calculation Method | Key Parameters | Software Tools |
|---|---|---|---|
| Phase-Amplitude Coupling (PAC) | Modulation Index (MI) via Kullback-Leibler divergence [2] | Low-frequency phase bands: 1-29 Hz (1 Hz steps) [2] | EEGLAB, custom MATLAB scripts |
| High-frequency amplitude: Gamma range (30-90 Hz) [2] | |||
| Cross-Frequency Phase Synchrony (CFS) | n:m phase synchronization index (n:m PSI) [13] | Integer frequency ratios (n:m) between phases | Custom MATLAB/Python scripts |
| Cross-Frequency Phase Linearity Measurement (CF-PLM) [57] | Based on interferometric spectrum shape | Custom implementations | |
| Genuine CFC Verification | Graph-theoretical network motif approach [85] | Tests for separable oscillatory processes | Custom implementations |
Control Analyses and Statistical Validation
Robust CFC analysis requires careful controls to address potential confounding factors:
Surrogate Data Testing: Employ surrogate data approaches (e.g., phase randomization, time-shifted surrogates) to establish significance thresholds and account for spurious couplings [2].
Multiple Comparison Correction: Apply false discovery rate (FDR) correction across electrode-frequency pairs to control Type I error [2].
Confound Management: Address potential artifacts from nonsinusoidal waveforms using methods like the graph-theoretical approach described by PMC [85], which distinguishes genuine CFC from spurious couplings arising from filter artifacts.
Visualization Framework for CFC Analysis
The following diagram illustrates the complete translational workflow for CFC analysis, from data acquisition to clinical application:
CFC Translational Workflow: From EEG data to clinical applications.
The mechanistic relationship between CFC and cognitive processes can be visualized through the following pathway diagram:
CFC-Cognition Mechanism: Neural coordination through cross-frequency coupling.
Table 3: Research Reagent Solutions for CFC Analysis
| Tool Category | Specific Tools/Platforms | Function in CFC Research |
|---|---|---|
| EEG Acquisition Systems | Neurofax EEG-1200C [87], DSI-24 [2], Muse S Headband [88] | Record neural signals with appropriate temporal resolution for CFC analysis |
| Signal Processing Platforms | EEGLAB [2], MATLAB with custom scripts [87] | Preprocess data, compute CFC metrics, perform statistical analyses |
| CFC Analysis Algorithms | Modulation Index (MI) [2], n:m Phase Synchronization Index [13], Cross-Frequency PLM [57] | Quantify different forms of cross-frequency interactions |
| Statistical & Control Packages | Surrogate data methods [2], Graph-theoretical network motif approach [85] | Verify genuine CFC, control for multiple comparisons, address filter artifacts |
| Brain Atlases & Parcellations | fMRI-defined resting-state networks [86], Cortical parcellation schemes [86] | Provide anatomical context for region-specific CFC alterations |
The translational pathway for CFC biomarkers is increasingly supported by empirical evidence across neurological and psychiatric conditions. Key advantages of CFC metrics include their sensitivity to cognitive states, non-invasive nature, and relatively low cost compared to other neuroimaging modalities. Remaining challenges include standardization of analysis pipelines, establishment of normative ranges, and validation of clinical utility in large-scale trials. Future directions should focus on developing automated CFC analysis systems for clinical deployment, establishing CFC-based biomarkers for treatment selection, and integrating CFC measures with other modalities (e.g., fMRI, fNIRS) for multimodal assessment. As methodological refinements continue and large-scale validation studies emerge, CFC-based biomarkers hold significant promise for transforming clinical practice in neurology and psychiatry.
Conclusion
Cross-frequency coupling represents a crucial mechanism for understanding coordinated brain activity, with demonstrated value across basic neuroscience and clinical applications. The integration of advanced analytical methods, including sophisticated statistical frameworks and graph theory approaches, has enhanced the reliability and interpretability of CFC measures. Evidence from multiple domains—including disorders of consciousness, depression, and cognitive impairment—supports CFC's potential as a sensitive biomarker for diagnosis, prognosis, and treatment monitoring. Future research should prioritize methodological standardization, longitudinal studies tracking CFC changes with disease progression and intervention, and the development of CFC-targeted neuromodulation therapies. For drug development professionals, CFC offers a promising neurophysiological endpoint for evaluating treatment efficacy and understanding mechanism of action, potentially accelerating the development of novel neurotherapeutics. The continued refinement of CFC analysis and its integration with multimodal imaging and artificial intelligence will further establish its role in precision medicine for neurological and psychiatric disorders.
References
- 1. The functional role of cross-frequency coupling - PMC [https://pmc.ncbi.nlm.nih.gov/articles/PMC3359652/]
- 2. Cross-frequency coupling between low ... [https://www.frontiersin.org/journals/psychiatry/articles/10.3389/fpsyt.2025.1596191/full]
- 3. A Bayesian framework for phase-amplitude cross ... [https://www.sciencedirect.com/science/article/pii/S0957417425021293]
- 4. The Role of Variable Oscillation Frequencies in Neural Circuits [https://pmc.ncbi.nlm.nih.gov/articles/PMC9304548/]
- 5. Frequency-specific mechanism links human brain networks for ... [https://pmc.ncbi.nlm.nih.gov/articles/PMC3845177/]
- 6. Periodic Oscillatory Information Flow Across Brain ... [https://www.sciencedirect.com/science/article/pii/S1053811925005877]
- 7. Low frequency oscillations – neural correlates of stability ... [https://www.nature.com/articles/s41467-025-60821-2]
- 8. The colors of our brain: an integrated approach for ... [https://pmc.ncbi.nlm.nih.gov/articles/PMC9107439/]
- 9. A brain mechanism of memory matching and attention [https://www.sciencedirect.com/science/article/abs/pii/S1053811907010592]
- 10. Cross-Frequency Coupling Increases Memory Capacity in ... [https://arxiv.org/abs/2204.07163]
- 11. The role of prefrontal catecholamines in attention and working ... [https://pmc.ncbi.nlm.nih.gov/articles/PMC3986539/]
- 12. Cross-frequency brain functional network analysis of ... [https://pubmed.ncbi.nlm.nih.gov/41218682/]
- 13. Cross-frequency brain functional network analysis of ... [https://www.sciencedirect.com/science/article/abs/pii/S0006899325006067]
- 14. A neural trait approach to exploring individual differences ... [https://pmc.ncbi.nlm.nih.gov/articles/PMC4295523/]
- 15. Balancing Plasticity/Stability Across Brain Development [https://www.sciencedirect.com/science/article/abs/pii/B9780444633279000011]
- 16. Influence of Study Time Differences on EEG - Cross ... Frequency [https://www.researchsquare.com/article/rs-5622676/v1]
- 17. Prefrontal contributions to the stability and variability of ... [https://pmc.ncbi.nlm.nih.gov/articles/PMC8616944/]
- 18. Brain expression quantitative trait locus and network ... [https://www.nature.com/articles/s41588-023-01300-6]
- 19. Using expression quantitative trait loci data and graph ... [https://www.frontiersin.org/journals/genetics/articles/10.3389/fgene.2022.921775/full]
- 20. Cross-frequency coupling in psychiatric disorders [https://www.sciencedirect.com/science/article/abs/pii/S0149763422001798]
- 21. a network study of microstate-specific cross-frequency coupling [https://pmc.ncbi.nlm.nih.gov/articles/PMC12486714/]
- 22. A statistical framework to assess cross-frequency coupling ... [https://elifesciences.org/articles/44287]
- 23. The Cardiofaciocutaneous Syndrome: From Genetics to ... [https://pmc.ncbi.nlm.nih.gov/articles/PMC10742720/]
- 24. Neurologic and neurodevelopmental complications in ... [https://www.sciencedirect.com/science/article/pii/S1098360022007213]
- 25. State space methods for phase amplitude coupling analysis [https://www.nature.com/articles/s41598-022-18475-3]
- 26. Protocol for phase-amplitude coupling analysis in local ... [https://pmc.ncbi.nlm.nih.gov/articles/PMC12226356/]
- 27. Epileptic seizures detection and the analysis of optimal seizure prediction horizon based on frequency and phase analysis - PMC [https://pmc.ncbi.nlm.nih.gov/articles/PMC10228742/]
- 28. Measuring Phase-Amplitude Coupling Between Neuronal ... [https://pmc.ncbi.nlm.nih.gov/articles/PMC2941206/]
- 29. On cross-frequency phase-phase coupling between theta ... [https://pmc.ncbi.nlm.nih.gov/articles/PMC5199196/]
- 30. Phase-amplitude cross-frequency coupling in EEG-derived cortical time series upon an auditory perception task - PubMed [https://pubmed.ncbi.nlm.nih.gov/26737208/]
- 31. Phase-Amplitude Coupling tutorial on sEEG data [https://etiennecmb.github.io/tensorpac/auto_examples/tuto/plot_real_data.html]
- 32. A Study on Cross-Frequency Coupling Effects on Intra-cranial ... [https://ucalgary.scholaris.ca/items/4a20a59c-05b1-429a-b4d1-7e2bbe8a1dcc]
- 33. Protocol for phase-amplitude coupling analysis in local ... [https://www.sciencedirect.com/science/article/pii/S2666166725002837]
- 34. Using linear parameter varying autoregressive models to ... [https://www.frontiersin.org/journals/human-neuroscience/articles/10.3389/fnhum.2022.915815/full]
- 35. Cross-Frequency Coupling Patterns During Oddball ... [https://www.frontiersin.org/journals/psychology/articles/10.3389/fpsyg.2025.1710742/full]
- 36. Using linear parameter varying autoregressive models to ... [https://pmc.ncbi.nlm.nih.gov/articles/PMC9525181/]
- 37. EEG dataset for energy data visualizations [https://www.sciencedirect.com/science/article/pii/S2352340923009654]
- 38. Power-to-power cross-frequency coupling as a novel ... [https://pmc.ncbi.nlm.nih.gov/articles/PMC12157509/]
- 39. Graph theory methods: applications in brain networks - PMC [https://pmc.ncbi.nlm.nih.gov/articles/PMC6136126/]
- 40. Application of Graph Theory for Identifying Connectivity ... [https://www.frontiersin.org/journals/neuroscience/articles/10.3389/fnins.2019.00585/full]
- 41. Graph theory analysis based on cross frequency coupling ... [https://www.sciencedirect.com/science/article/abs/pii/S0010482525015215]
- 42. Connectome: Graph theory application in functional brain ... [https://www.sciencedirect.com/science/article/pii/S2467981X17300276]
- 43. Multi-Granularity Analysis of Brain Networks Assembled ... [https://www.frontiersin.org/journals/computational-neuroscience/articles/10.3389/fncom.2022.785397/full]
- 44. Cross-frequency network analysis of functional brain ... [https://cpb.iphy.ac.cn/article/2019/1983/cpb_28_4_048702.html]
- 45. Opportunities for use of neuroimaging in de-risking drug ... [https://www.nature.com/articles/s41386-024-01970-8]
- 46. Investigation of the impact of cross-frequency coupling on ... [https://www.sciencedirect.com/science/article/abs/pii/S1746809424004506]
- 47. Cross-frequency coupling between low ... [https://pubmed.ncbi.nlm.nih.gov/40557136/]
- 48. Parietal gamma oscillations decreased in cognitive biotype ... [https://www.nature.com/articles/s41598-025-20977-9]
- 49. Enhancing working memory in MCI: Modulating alpha-gamma ... [https://pmc.ncbi.nlm.nih.gov/articles/PMC12491797/]
- 50. What can neurofeedback and transcranial alternating current ... [https://pmc.ncbi.nlm.nih.gov/articles/PMC11861218/]
- 51. What can neurofeedback and transcranial alternating ... [https://www.frontiersin.org/journals/neuroscience/articles/10.3389/fnins.2025.1465773/full]
- 52. Improving working memory by electrical stimulation and cross ... [https://molecularbrain.biomedcentral.com/articles/10.1186/s13041-024-01142-1]
- 53. Phase-lagged tACS between executive and default mode ... [https://www.nature.com/articles/s41598-025-91881-5]
- 54. Personalized EEG-guided brain stimulation targeting in major ... [https://pmc.ncbi.nlm.nih.gov/articles/PMC12288337/]
- 55. Resting-state EEG alterations and cognitive impairment in ... [https://www.frontiersin.org/journals/neurology/articles/10.3389/fneur.2025.1583715/full]
- 56. A statistical framework to assess cross-frequency coupling ... [https://pmc.ncbi.nlm.nih.gov/articles/PMC6821458/]
- 57. Detection of Cross-Frequency Coupling Between Brain Areas [https://www.frontiersin.org/journals/neuroscience/articles/10.3389/fnins.2022.846623/full]
- 58. Cross-frequency coupling in real and virtual brain networks [https://pmc.ncbi.nlm.nih.gov/articles/PMC3699761/]
- 59. Electroencephalography Signal Processing [https://pmc.ncbi.nlm.nih.gov/articles/PMC10385593/]
- 60. Understanding Heterogeneity In Research | CASP [https://casp-uk.net/news/heterogeneity-in-research/]
- 61. Cross-Frequency Coupling in Developmental Perspective - PMC [https://pmc.ncbi.nlm.nih.gov/articles/PMC6527755/]
- 62. Electroencephalographic Cross-Frequency Coupling as a ... [https://www.frontiersin.org/journals/neuroscience/articles/10.3389/fnins.2020.00790/full]
- 63. Understanding Success Criterion 1.4.11: Non-text Contrast [https://www.w3.org/WAI/WCAG21/Understanding/non-text-contrast.html]
- 64. Parametric estimation of cross-frequency coupling - PMC [https://pmc.ncbi.nlm.nih.gov/articles/PMC4364621/]
- 65. An Adaptive Machine Learning Framework for Auditory ... [https://arxiv.org/html/2511.09765v1]
- 66. Deep learning-based electroencephalic decoding of the ... [https://www.frontiersin.org/journals/human-neuroscience/articles/10.3389/fnhum.2025.1545726/full]
- 67. Improving brain-computer interface performance with ... [https://www.sciencedirect.com/science/article/abs/pii/S1350453325001110]
- 68. Threshold optimization & cost [https://medium.com/better-ml/threshold-optimization-cost-a72903db36aa]
- 69. Review Neural Cross-Frequency Coupling [https://www.sciencedirect.com/science/article/abs/pii/S0166223615002088]
- 70. Genuine cross-frequency coupling networks in human resting ... [https://journals.plos.org/plosbiology/article?id=10.1371/journal.pbio.3000685]
- 71. Multivariate cross-frequency coupling via generalized ... [https://elifesciences.org/articles/21792]
- 72. Multivariate Phase–Amplitude Cross-Frequency Coupling ... [https://pmc.ncbi.nlm.nih.gov/articles/PMC4090099/]
- 73. Cross-frequency coupling in real and virtual brain networks [https://www.frontiersin.org/journals/computational-neuroscience/articles/10.3389/fncom.2013.00078/full]
- 74. The classification of absence seizures using power-to- ... [https://www.frontiersin.org/journals/neuroinformatics/articles/10.3389/fninf.2025.1513661/full]
- 75. AC-CfC: An attention-based convolutional closed-form ... [https://www.sciencedirect.com/science/article/abs/pii/S1746809424003070]
- 76. Decoding covert visual attention of ... [https://www.nature.com/articles/s41598-025-21635-w]
- 77. Machine Learning Approaches to Evaluate EEG Correlates of ... [https://pmc.ncbi.nlm.nih.gov/articles/PMC12141261/]
- 78. Closed-form continuous-time neural networks [https://www.nature.com/articles/s42256-022-00556-7]
- 79. Multiple cross-frequency coupling analysis of resting-state ... [https://pmc.ncbi.nlm.nih.gov/articles/PMC10436577/]
- 80. A neural mass model of cross frequency coupling | PLOS One [https://journals.plos.org/plosone/article?id=10.1371/journal.pone.0173776]
- 81. CROSS-FREQUENCY COUPLING IN DEEP BRAIN ... [https://pmc.ncbi.nlm.nih.gov/articles/PMC5675837/]
- 82. Resting-state EEG alterations and cognitive impairment in ... [https://pmc.ncbi.nlm.nih.gov/articles/PMC12221916/]
- 83. a network study of microstate-specific cross-frequency coupling [https://thejournalofheadacheandpain.biomedcentral.com/articles/10.1186/s10194-025-02135-8]
- 84. Top 6 Visualizations for Quantitative Data Analysis Methods [https://chartexpo.com/blog/quantitative-data-analysis-methods]
- 85. Genuine cross-frequency coupling networks in human resting ... [https://pmc.ncbi.nlm.nih.gov/articles/PMC7233600/]
- 86. Slower Ageing of Cross-Frequency Coupling Mechanisms ... [https://www.mdpi.com/2076-3417/15/12/6880]
- 87. Dynamic reconstruction of electroencephalogram data using ... [https://pmc.ncbi.nlm.nih.gov/articles/PMC11985760/]
- 88. Real-Time Electroencephalogram Data Visualization Using ... [https://www.mdpi.com/2411-9660/9/1/16]