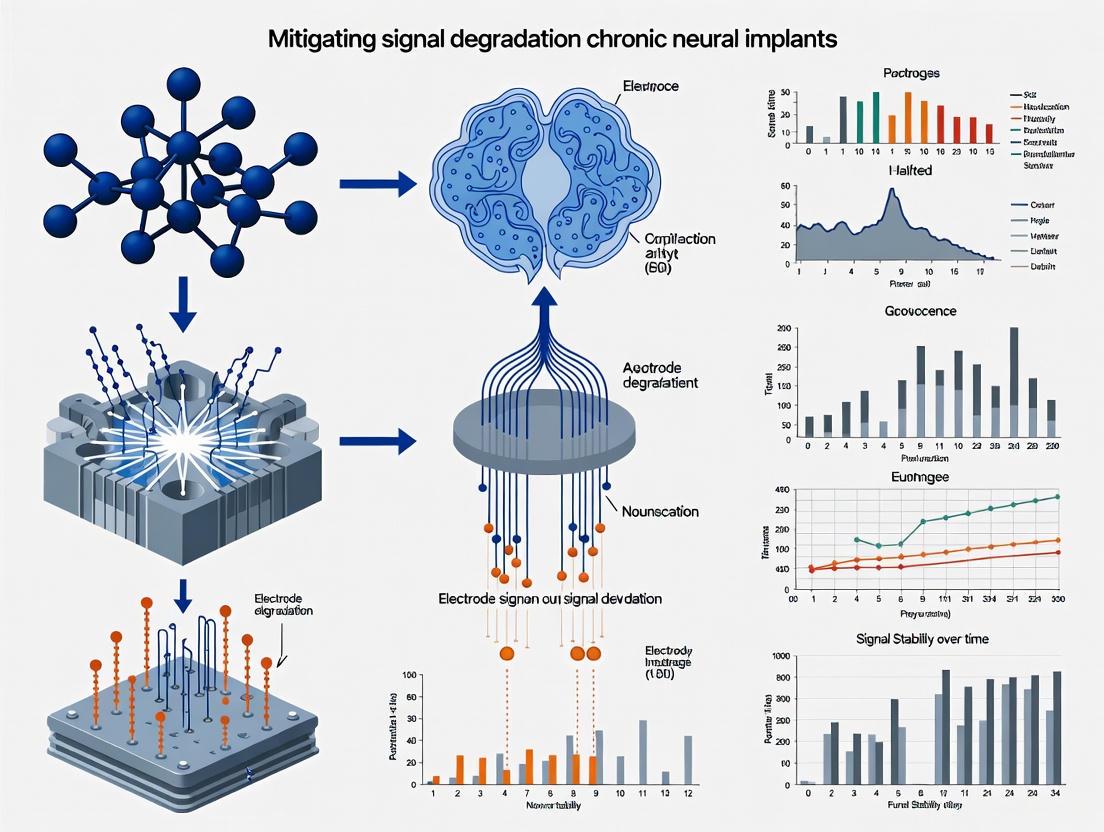
Combating Signal Degradation in Chronic Neural Implants: From Biological Mechanisms to Advanced Signal Processing
This article provides a comprehensive analysis of the challenge of signal degradation in chronically implanted neural interfaces, a critical barrier to long-term stability in basic neuroscience and clinical brain-computer interface...
Combating Signal Degradation in Chronic Neural Implants: From Biological Mechanisms to Advanced Signal Processing
Abstract
This article provides a comprehensive analysis of the challenge of signal degradation in chronically implanted neural interfaces, a critical barrier to long-term stability in basic neuroscience and clinical brain-computer interface (BCI) applications. We first explore the foundational biological mechanisms, including gliosis and neuronal death triggered by chronic inflammation and mechanical mismatch. The review then details innovative methodological strategies spanning materials engineering, novel probe designs, and advanced on-implant signal processing for data compression and real-time decoding. Furthermore, we examine practical troubleshooting and optimization techniques for existing systems, covering failure mode diagnosis and signal restoration algorithms like degradation-aware imputation. Finally, we present a comparative analysis of validation frameworks, highlighting performance benchmarks across different implant technologies and decoding approaches in both preclinical and clinical settings. This synthesis offers researchers and clinicians a multi-faceted roadmap for developing robust, chronic neural implants.
Unraveling the Roots of Failure: Biological and Mechanical Causes of Chronic Signal Degradation
Implantable neural electrodes are powerful tools for recording brain activity and delivering therapeutic stimulation. However, their long-term functionality is critically limited by the foreign body response (FBR), a complex biological reaction to the implanted device. This response involves activation of the brain's immune cells, leading to gliosis (the proliferation and activation of glial cells), encapsulation of the device in a glial scar, and degeneration of nearby neurons. These events increase the electrical impedance of the interface and displace neurons away from the electrode sites, resulting in a progressive decline in signal quality and stimulation efficacy [1] [2] [3]. Understanding and mitigating this response is fundamental to advancing chronic neural implant research.
Frequently Asked Questions (FAQs)
Q1: What are the primary cellular events in the foreign body response to a neural implant? The FBR is a cascade that begins immediately upon implantation:
- Acute Phase (Minutes to Hours): Device insertion severs blood vessels and neural connections, disrupting the blood-brain barrier (BBB). This allows blood serum proteins (e.g., albumin, fibronectin) to leak into the brain tissue and adsorb onto the implant surface [1] [3] [4]. Microglia, the brain's resident immune cells, are the first responders, sensing the damage and migrating toward the implant within hours [4].
- Subacute Phase (Days to Weeks): Activated microglia proliferate and release pro-inflammatory cytokines and chemokines [3] [4]. This inflammatory signaling activates astrocytes, which begin to hypertrophy, proliferate, and upregulate intermediate filaments like GFAP (glial fibrillary acidic protein) [3].
- Chronic Phase (Weeks to Months): Astrocytes and microglia form a dense, layered glial scar that encapsulates the device. This process is often associated with ongoing neuroinflammation, neurodegeneration due to excitotoxicity, and a leaky blood-brain interface [1] [3].
Q2: How does the glial scar directly lead to signal degradation? The glial scar impedes neural interface function through multiple mechanisms:
- Neuronal Displacement: The progressive thickening of the scar tissue physically pushes viable neurons away from the electrode surface, increasing the distance between the signal source and the sensor [1] [4].
- Electrical Insulation: The glial scar tissue itself has high electrical resistivity, forming an insulating layer that obstructs efficient signal transduction between neurons and electrodes [1] [4].
- Altered Neuronal Environment: Chronic inflammation and glial activity can lead to reduced excitability and synaptic connectivity of nearby neurons, diminishing the amplitude and quality of recordable signals [4].
Q3: Is the FBR solely driven by the initial implantation trauma? No, while the initial insertion trauma is a major trigger, the FBR is sustained by multiple factors. The ongoing presence of the device as a foreign body perpetuates the response. A critical factor is mechanical mismatch: the stiffness difference between a rigid implant (e.g., silicon or metal) and the soft, pulsating brain tissue creates continuous micro-movements. This micromotion causes secondary trauma, sustaining inflammation and glial activation even after the initial wound has healed [1] [2].
Q4: Can the FBR be prevented by eliminating microglia? Research suggests the process is more complex. One study depleted 89-94% of cortical microglia using a CSF1R inhibitor (PLX5622) before implantation. The results showed that astrocytes were still activated and formed an encapsulating scar in the absence of microglia, indicating that microglia roles might be redundant for scar formation in this context. The study also found that neuron degeneration and recovery progressed similarly with or without microglia, challenging the assumption that microglia always serve a protective role for neurons in this context [4].
Troubleshooting Guides: Addressing Common Experimental Challenges
Challenge 1: Progressive Decline in Recording Signal-to-Noise Ratio
Problem: Recorded neural signal amplitudes decrease over weeks post-implantation.
| Potential Cause | Diagnostic Steps | Mitigation Strategies |
|---|---|---|
| Gliosis and Neuronal Loss: Glial scar formation increases distance to neurons. | - Perform immunohistochemistry post-experiment for GFAP (astrocytes), Iba1 (microglia), and NeuN (neurons) to quantify scar thickness and neuronal density.- Correlate histology with electrode impedance data. | - Reduce Cross-section: Use probes with a smaller footprint to displace less tissue [1].- Improve Flexibility: Utilize flexible materials (e.g., polyimide, ultraflexible electrodes) to minimize micromotion [1] [5].- Surface Modification: Apply anti-inflammatory drug coatings (e.g., dexamethasone). |
| Biofouling: Adsorption of blood proteins and inflammatory factors on the electrode surface increases impedance. | - Measure electrochemical impedance spectroscopy over time.- Inspect explanted devices for protein buildup. | - Hydrogel Coatings: Use coatings that resist protein adhesion.- Biomimetic Coatings: Functionalize surfaces with peptides that promote healthy neuronal integration. |
| Device Micromotion: Relative movement between the probe and tissue causes chronic inflammation. | - Use in vivo imaging (e.g., two-photon microscopy) if available.- Analyze signal stability for characteristic shifts indicative of probe movement. | - Flexible Tethers: Eliminate rigid connections to the skull.- Secure Anchoring: Improve skull anchorage to minimize bulk movement.- Ultra-flexible Probes: Use devices that mechanically match the brain [5]. |
Challenge 2: Unstable Stimulation Efficacy
Problem: Increasing electrical current levels are required to evoke the same neural or therapeutic response.
| Potential Cause | Diagnostic Steps | Mitigation Strategies |
|---|---|---|
| Insulating Glial Scar: The scar tissue acts as a barrier, reducing charge transfer to the target neurons. | - Perform post-mortem histology to confirm glial encapsulation.- Monitor stimulation impedance and voltage waveforms during pulsing. | - Material Biocompatibility: Use softer materials with a closer mechanical match to brain tissue (Young's modulus ~1-10 kPa) to reduce scarring [6] [2].- Drug-eluting Coatings. |
| Neurodegeneration: Loss of target neurons in the vicinity of the electrode. | - Histological staining for neuronal nuclei (NeuN) and markers of apoptosis. | - Reduce Initial Trauma: Optimize surgical technique and use sharper, smaller probes.- Anti-inflammatory Interventions. |
| Electrode Corrosion/Degradation: The stimulation pulses damage the electrode surface, reducing its effectiveness. | - Inspect explanted electrodes using electron microscopy and energy-dispersive X-ray spectroscopy (EDS). | - Use Advanced Electrode Materials: Employ corrosion-resistant materials like iridium oxide or PEDOT:PSS.- Optimize Stimulation Parameters: Stay within safe charge injection limits. |
Key Signaling Pathways in the Foreign Body Response
The following diagram illustrates the core cellular and molecular cascade triggered by neural probe implantation.
Quantitative Data on Key FBR Factors
Table 1: Mechanical Properties of Neural Tissues and Interface Materials
| Material / Tissue | Young's Modulus | Key Characteristics & Impact on FBR |
|---|---|---|
| Brain Tissue | 1 - 10 kPa | Soft, gelatinous; serves as the benchmark for mechanical compatibility [6] [2]. |
| Flexible Polymer (e.g., Polyimide) | 1 - 10 GPa | Much stiffer than brain, but can be fabricated in thin, flexible shanks that bend easily, reducing effective stiffness and micromotion [1] [5]. |
| Ultraflexible Probes | < 1 GPa | Engineered to have a low bending stiffness, enabling more seamless integration and reduced chronic FBR [1] [5]. |
| Silicon | ~100 GPa | Very stiff; significant mechanical mismatch leads to sustained FBR, though slender designs can improve integration [1] [2]. |
| Platinum (Metal Electrode) | ~100 GPa | Extreme stiffness mismatch; often requires flexible composites or thin films for chronic stability [2]. |
Table 2: Key Cellular Actors in the Foreign Body Response
| Cell Type | Timeline of Activation | Primary Functions in FBR | Effect on Neural Interface |
|---|---|---|---|
| Microglia | First Responder (Minutes-Hours) | Phagocytosis; release of pro-inflammatory cytokines (e.g., TNF-α, IL-1β); initial encapsulation of the device [3] [4]. | Initiates inflammation that can lead to neuronal damage and astrocyte activation. Chronic activation contributes to the insulating scar [3] [4]. |
| Astrocytes | Subacute/Chronic (Days-Weeks) | Form the core of the glial scar; upregulate GFAP; hypertrophy; release factors that perpetuate the foreign body response [1] [3]. | Creates a physical and electrochemical barrier between the electrode and neurons, a primary cause of signal degradation [1] [3]. |
| NG2-glia | Early Responder (Within 24h) | Proliferate and arrive at the injury site; can differentiate into astrocytes, contributing to the glial cell population [3]. | May augment the population of reactive astrocytes around the implant, thickening the scar [3]. |
The Scientist's Toolkit: Essential Reagents and Materials
Table 3: Key Reagents and Materials for FBR Research
| Item | Function in FBR Research | Example Use Case |
|---|---|---|
| CSF1R Inhibitors (e.g., PLX5622) | Depletes microglia populations by blocking a receptor critical for their survival [4]. | Used to investigate the specific role of microglia in scar formation and neuronal health independently of astrocytes [4]. |
| Antibody Markers | Allows identification and visualization of specific cell types in histology. | - GFAP: Labels reactive astrocytes [3] [4].- Iba1: Labels microglia/macrophages [4].- NeuN: Labels neuronal nuclei to quantify cell loss [4]. |
| Flexible Polymer Substrates | Serves as the base material for neural probes to reduce mechanical mismatch. | Polyimide-based microelectrode arrays can be made ultra-thin and flexible, promoting better tissue integration and reducing chronic FBR [5]. |
| Conducting Polymers (e.g., PEDOT:PSS) | Used as a coating for electrode sites; improves charge injection capacity and can be functionalized with bioactive molecules. | Coating electrodes with PEDOT:PSS can lower impedance and improve signal quality, while also serving as a platform for delivering anti-inflammatory drugs [2]. |
| Dexamethasone | A potent anti-inflammatory glucocorticoid. | Incorporated into hydrogel coatings on neural probes to locally suppress the inflammatory response upon implantation, potentially reducing glial scarring [2]. |
Advanced Experimental Protocol: Assessing the FBR
Objective: To evaluate the extent of the foreign body response and neuronal loss around a newly implanted neural probe.
Materials:
- Experimental animal model (e.g., rat or mouse).
- Neural probe for implantation.
- Standard stereotaxic surgical setup.
- Perfusion and fixation equipment.
- Primary antibodies: Anti-GFAP (astrocytes), Anti-Iba1 (microglia), Anti-NeuN (neurons).
- Fluorescently-labeled secondary antibodies.
- Confocal or fluorescent microscope.
Method:
- Implantation: Aseptically implant the neural probe into the target brain region using optimized stereotaxic surgery to minimize bleeding and initial trauma [1].
- Chronic Period: Allow the device to remain implanted for the desired chronic duration (e.g., 2, 4, 6, or 12 weeks) while periodically conducting electrophysiological recordings to monitor signal quality.
- Perfusion and Tissue Harvest: At the endpoint, transcardially perfuse the animal with phosphate-buffered saline (PBS) followed by 4% paraformaldehyde (PFA). Extract the brain and post-fix in PFA, then transfer to a sucrose solution for cryoprotection.
- Histology: Section the frozen brain tissue containing the implant track into thin slices (e.g., 30-40 μm) using a cryostat.
- Immunohistochemistry: Incubate free-floating tissue sections with the primary antibodies, then with appropriate secondary antibodies. Include DAPI for nuclear counterstaining.
- Imaging and Quantification: Image the tissue surrounding the implant track using confocal microscopy. Use image analysis software to:
- Quantify Gliosis: Measure the intensity and thickness of GFAP and Iba1 staining as a function of distance from the implant track.
- Quantify Neuronal Loss: Count NeuN-positive cells in concentric zones (e.g., 0-50 μm, 50-100 μm, 100-150 μm) from the implant track and compare to counts in contralateral or naive tissue.
- Correlation with Electrophysiology: Statistically correlate the histological metrics (glial scar thickness, neuronal density) with the electrophysiological performance metrics (signal amplitude, impedance) recorded over time.
Frequently Asked Questions (FAQs)
1. What is mechanical mismatch in the context of neural implants? Mechanical mismatch refers to the significant difference in stiffness (Young's Modulus) between a rigid neural probe and the soft, surrounding brain tissue. Conventional silicon probes can have a Young's modulus of ~170 GPa, while brain tissue has a modulus of approximately ~3-6 kPa [7] [8]. This billion-fold difference in stiffness means that when the brain moves naturally (due to cardiac pulse, breathing, or head movement), the rigid probe does not move with it, creating shear forces and strain at the probe-tissue interface [7].
2. How does mechanical mismatch lead to signal degradation? The micromotion-induced strain and shear forces trigger a cascade of biological responses that degrade signal quality over time [9]:
- Chronic Inflammation: The mechanical strain activates the brain's immune cells (microglia) and disrupts the blood-brain barrier [9].
- Gliosis: This leads to the formation of a glial scar—a dense layer of reactive astrocytes and other cells—around the implant [9].
- Neuronal Death: Pro-inflammatory cytokines and oxidative stress from the chronic inflammatory response are neurotoxic [9]. The glial scar increases the distance between neurons and the recording electrodes, while neuronal death reduces the number of signal sources, together causing a decline in the signal-to-noise ratio (SNR) and eventual signal loss [9].
3. Where does mechanical failure most likely occur within the probe itself? Finite Element Modeling (FEM) has shown that mechanical strain is concentrated on small protrusions and at the interfaces between different materials. In planar silicon electrodes, the protruded electrical traces and the borders of the iridium recording sites are focal points for strain [10] [11]. This concentrated strain can lead to material failure, such as cracking or delamination of conductive traces and insulation, which directly causes recording site degradation or failure [10].
4. What are the primary sources of brain micromotion? Brain micromotion is a persistent phenomenon with several sources [7]:
- Cardiac Pulse: Causes displacements of 1–4 µm at frequencies up to 5 Hz.
- Respiration: Causes larger displacements of 2–25 µm at frequencies of approximately 1–2 Hz.
- Physical Activities: Movements such as walking, stumbling, or head rotations can generate higher frequency motions (up to 24 Hz in humans) and larger displacements, creating more significant strain [7].
Troubleshooting Guides
Problem: Gradual Decline in Signal-to-Noise Ratio (SNR) Over Weeks/Months
Potential Cause: Chronic foreign body response (FBR) and glial scar formation exacerbated by mechanical mismatch.
Solution Strategy:
- Verify Probe-Tissue Interaction: Use Finite Element Modeling to simulate the strain and micromotion at your probe's interface. Focus on areas with material discontinuities (e.g., metal traces on a silicon shank) [10].
- Switch to Softer Probe Materials: Consider replacing rigid silicon probes with flexible alternatives. The following table compares common materials:
| Material | Young's Modulus | Key Advantages for Chronic Implants |
|---|---|---|
| Silicon | 165 - 170 GPa [7] | Rigid, easy to implant; high spatial multiplexing [9] |
| Parylene-C | ~4 GPa [8] | Conformal coating, chemical inertness, greater flexibility than silicon [8] |
| Polyimide | ~2.5 GPa [8] | Flexible, can be used to make compliant neural probes [8] |
| PDMS | 360 - 870 kPa [8] | High flexibility, close to brain tissue stiffness, excellent biocompatibility [7] [8] |
| Hydrogels | ~200 kPa [7] | Very low modulus, can closely match the mechanical properties of brain tissue [7] |
- Implement a Stiffening Shuttle for Implantation: Flexible probes require temporary stiffening for implantation. A common protocol uses a biodegradable material as a stiffener [8]:
- Materials: Parylene-based flexible probe integrated with a microfluidic channel; Polyethylene glycol (PEG).
- Method:
- Melt solid PEG on a hot plate at 50 °C until it becomes liquid [8].
- Use a tiny glass pipette to suction the liquid PEG into the microchannel from the outlet [8].
- Allow the probe to cool to room temperature, solidifying the PEG and stiffening the shank [8].
- Implant the stiffened probe. The PEG will dissolve upon contact with brain tissue, restoring the probe's flexibility and minimizing chronic mechanical mismatch [8].
Problem: Acute Signal Loss or High Electrode Impedance Post-Implantation
Potential Cause: Material failure of the probe due to focused mechanical strain.
Solution Strategy:
- Inspect for Material Damage: Use Scanning Electron Microscopy (SEM) to examine explanted probes. Look for cracks in the substrate or insulation, and particularly for damage to the conductive polysilicon traces near the iridium recording sites, as predicted by FEM [10] [11].
- Redesign Probe Micro-architecture: To mitigate future failures:
Problem: Excessive Tissue Strain During Initial Implantation or From Chronic Micromotion
Potential Cause: The stiffness and size of the probe induce damaging levels of strain in the surrounding tissue during both insertion and from ongoing brain pulsations.
Solution Strategy:
- Quantify Tissue Strain with FEM: Model the probe-tissue interface under simulated micromotion. A 1 µm displacement can produce strains over 25% in the brain with a stiff silicon probe under no-coupling conditions [7].
- Optimize Friction and Coupling: Model different coefficients of friction (µ) to simulate the post-implantation timeline [7]:
Table 1. Key Parameters for Micromotion and Strain Analysis
| Parameter | Typical Value/Source | Relevance to Probe Design |
|---|---|---|
| Brain Tissue Stiffness | 6 kPa (Modeled at 37°C) [10] | Target for mechanical matching |
| Brain Displacement (Respiration) | 2 - 25 µm [7] | Input for mechanical simulation |
| Brain Displacement (Cardiac Pulse) | 1 - 4 µm [7] | Input for mechanical simulation |
| Frequency (Respiration) | 1 - 2 Hz [7] | Input for transient simulation |
| Frequency (Cardiac Pulse) | Up to 5 Hz [7] | Input for transient simulation |
| Permitted Micromotion for Integration | 28 - 150 µm (Bone literature) [8] | Reference for stable integration |
| Critical Strain on Protrusions | Highly concentrated at trace edges [10] | Guides micro-architecture design |
The Scientist's Toolkit: Research Reagent Solutions
Table 2. Essential Materials for Next-Generation Neural Probe Development
| Item | Function in Research | Example Use Case |
|---|---|---|
| Parylene-C | A flexible polymer used as the substrate and insulation for soft neural probes [8]. | Fabrication of flexible microelectrodes that reduce chronic inflammation [8]. |
| Polyethylene Glycol (PEG) | A biodegradable stiffener that enables the implantation of flexible probes [8]. | Used as a dissolving shuttle to temporarily stiffen a Parylene probe for insertion into brain tissue [8]. |
| Polyimide | A flexible polymer substrate for creating compliant electrode arrays [8]. | Serves as the structural base for flexible multichannel probe arrays [8]. |
| PDMS (Polydimethylsiloxane) | An elastomer with low Young's modulus used for ultra-soft probes [7] [8]. | Developing probes with a modulus much closer to brain tissue to minimize mechanical mismatch [8]. |
| Hydrogels | Ultra-soft materials used as coatings or probe substrates to closely match brain mechanics [7]. | Applied as a coating on neural electrodes for better integration and mechanical buffering [7]. |
Visualizing the Impact of Probe Stiffness
The following diagram illustrates the core relationship between probe stiffness, micromotion, and the subsequent biological and functional outcomes.
Chronic Inflammation and Blood-Brain Barrier Disruption as Key Drivers
Frequently Asked Questions (FAQs)
Q1: What are the primary cellular players in the foreign body response to a neural implant? The foreign body response involves a coordinated cellular cascade. Microglia (the brain's resident immune cells) are activated within minutes of implantation, extending processes toward the device. Within hours, they begin to encapsulate the implant. Astrocytes become maximally activated within the first week and subsequently form a dense glial scar that can act as a physical and chemical barrier to signal transmission. This process can also involve peripheral immune cells if the Blood-Brain Barrier (BBB) is compromised [12].
Q2: How does peripheral inflammation affect the BBB and my chronic neural recordings? Systemic inflammation, even outside the central nervous system, can disrupt the BBB. Peripheral inflammatory signals (e.g., cytokines like TNF-α and IL-1β) can weaken the tight junctions between endothelial cells that form the BBB. This increased permeability allows more immune cells and inflammatory mediators to enter the brain, potentially exacerbating the local glial response around your implant and accelerating signal degradation [13] [14].
Q3: I've observed a slow decline in signal quality over months. Is this a biological or mechanical failure? It is often a combination of both. Biologically, the chronic glial encapsulation and persistent inflammation increase the distance between neurons and electrode sites, elevating impedance and attenuating signal amplitude [12]. Mechanically, the constant micro-motion between the brain and the implant can cause strain, leading to material fatigue, delamination of conductive traces, or insulation failure, which also degrades electrical performance [11] [15].
Q4: My animal model underwent a craniectomy for electrode implantation. Could the procedure itself be affecting my BBB integrity data? Yes. Studies have demonstrated that craniectomy alone, even without inducing cerebral ischemia, can cause significant BBB disruption and cerebral edema. This is a critical experimental artifact. If your research involves assessing BBB integrity, you must include a craniectomy-only control group to distinguish procedure-related effects from those caused by your specific experimental manipulation or the implant itself [16].
Troubleshooting Guides
Problem: Acute Loss of Signal Post-Implantation
| Possible Cause | Diagnostic Tests | Proposed Solution |
|---|---|---|
| Major Blood Vessel Damage [11] | In vivo: Check for significant bleeding during surgery. Post-mortem: Perfuse and image brain sections for large hemorrhagic tracts. | Improve surgical planning using vascular maps. Use smaller, sharper probes. Employ coatings that promote hemostasis. |
| Severe Insertion Trauma & Acute Edema [12] | Monitor impedance; a sharp, sustained rise indicates dense biological encapsulation. Use two-photon microscopy if available. | Allow a longer stabilization period (1-4 weeks) post-surgery before beginning chronic recordings. Consider anti-inflammatory drug regimens post-op (e.g., dexamethasone). |
| Mechanical Failure of Device [11] [15] | In vivo: Check for open or short circuits via impedance spectroscopy. Ex vivo: Inspect device under SEM for cracks, delamination, or broken leads. | Verify device integrity pre-implantation. Ensure packaging and interconnects are robust. Review surgical handling procedures to avoid excessive force. |
Problem: Chronic, Progressive Signal Degradation Over Weeks/Months
| Possible Cause | Diagnostic Tests | Proposed Solution |
|---|---|---|
| Glial Scar Maturation [12] | Histology: Post-mortem immunostaining for GFAP (astrocytes) and Iba1 (microglia). In vivo: Correlate increasing impedance with loss of unit count. | Develop strategies to mitigate the foreign body response: use smaller, more flexible probes; apply anti-inflammatory coatings (e.g., drug-eluting hydrogels). |
| Persistent BBB Leakage & Neuroinflammation [13] [14] | In vivo: Admininate tracer dyes (e.g., Evans Blue, fluorescein) to quantify BBB permeability. Histology: Analyze serum albumin or IgG extravasation in tissue. | Control systemic infections and inflammation in animal subjects. Investigate therapeutic agents that stabilize BBB integrity (e.g., Angiopoietin-1). |
| Neuronal Loss/Loss of Proximity [12] | Histology: Stain for neuronal markers (NeuN) and count neurons within a 150 µm radius of the implant track. | The same solutions for mitigating gliosis apply, as neuronal loss is often a consequence of chronic inflammation. Softer materials that minimize micromotion are beneficial. |
| Material Degradation [11] [15] | Ex vivo: Use SEM and impedance testing on explanted devices to identify corrosion, cracked insulation, or broken traces. | Select more durable, corrosion-resistant materials (e.g., platinum-iridium, iridium oxide). Improve insulation layer adhesion and quality. |
Problem: High Variability in Signal Quality Across Electrodes/Animals
| Possible Cause | Diagnostic Tests | Proposed Solution |
|---|---|---|
| Inconsistent Proximity to Major Vasculature [11] | Histology: Correlate electrode track location with post-mortem vascular maps (e.g., using perfused dyes). | Use neuroimaging to guide implant placement away from large surface vessels. Standardize stereotaxic coordinates with high-resolution atlases. |
| Uncontrolled Peripheral Inflammatory State [13] | Monitor animal health rigorously. Measure systemic cytokine levels (e.g., via blood draws) if variability is a major issue. | Strict hygiene protocols, consistent suppliers, and healthy cohorts. Monitor for subclinical infections. |
| Mechanical Mismatch & Micromotion [11] | Modeling: Use Finite Element Analysis to simulate strain. In vivo: Difficult to measure directly, but variability can be reduced by improving device mechanics. | Use flexible, compliant materials that better match brain tissue's Young's modulus. Designs that tether loosely to the skull can reduce strain. |
Key Experimental Data & Protocols
Quantitative Data on Inflammation and BBB Disruption
Table 1: Impact of Inflammatory Stimuli on BBB Permeability
| Inducing Factor | Experimental Model | Tracer Used (Size) | Key Finding (Permeability Change) | Citation |
|---|---|---|---|---|
| Peripheral LPS Injection | APP Transgenic Mice | Endogenous proteins, cytokines | Increased BBB permeability, infiltration of IL-6, TNF-α | [13] |
| Craniectomy (alone) | Mouse / Rat | Evans Blue (961 Da), Fluorescein, Endogenous Albumin (~66 kDa) | Significant increase in permeability to small molecules and albumin, leading to cerebral edema | [16] |
| Chronic Inflammatory Pain (CFA) | Rat | [14C]Sucrose (342 Da) | Significant increase in brain sucrose uptake | [17] |
| Systemic LPS Challenge | Mouse | 70-kD Dextran | Glycocalyx damage and increased permeability to large molecules | [14] |
Table 2: Tight Junction Protein Alterations Under Inflammation
| Experimental Model | Tight Junction Protein | Change in Expression | Functional Outcome | Citation |
|---|---|---|---|---|
| Chronic Inflammatory Pain (CFA) | Occludin | 60% Decrease | Associated with increased BBB permeability | [17] |
| Chronic Inflammatory Pain (CFA) | Claudin-3 | 450% Increase | Compensatory or pathological response? | [17] |
| Chronic Inflammatory Pain (CFA) | Claudin-5 | 615% Increase | Compensatory or pathological response? | [17] |
| Claudin-5 Knockout Mice | Claudin-5 | Knockout | Increased permeability to molecules < 1.9 kDa | [14] |
Detailed Experimental Protocols
Protocol 1: Assessing BBB Permeability Using Evans Blue Dye
- Principle: Evans Blue dye binds tightly to serum albumin in vivo, forming a large molecular complex (~68 kDa). Its extravasation into brain tissue is a quantitative measure of BBB disruption [16] [17].
- Materials: Evans Blue dye, saline, heating pad, stereotaxic apparatus, surgical tools, peristaltic pump (for perfusion), formamide (for dye extraction).
- Procedure:
- Prepare a 4% (w/v) solution of Evans Blue in sterile saline.
- Inject the dye intravenously (e.g., via tail vein) at a standard dose (e.g., 2 ml/kg) [16].
- Allow the dye to circulate for a predetermined time (e.g., 1-3 hours) depending on the experimental model.
- Deeply anesthetize the animal and transcardially perfuse with a large volume of cold saline (~100-200 ml for a rat) until the perfusate from the right atrium runs clear. This step is critical to remove dye from the cerebral vasculature.
- Extract the brain and photograph it for qualitative assessment of blue staining.
- For quantification, dissect brain regions of interest and homogenize them in formamide (e.g., 1 ml per 100 mg tissue).
- Incubate the homogenate at 60°C for 24 hours to extract the dye.
- Centrifuge the homogenate and measure the absorbance of the supernatant at 620 nm (with a reference at 740 nm) using a spectrophotometer.
- Calculate the concentration of extracted Evans Blue by comparing to a standard curve and normalize to tissue weight.
Protocol 2: Evaluating the Foreign Body Response via Histology
- Principle: Immunohistochemistry allows for the visualization and quantification of specific cell types and proteins involved in the neuroinflammatory response around an implant [12].
- Materials: Paraformaldehyde (PFA), cryostat or microtome, primary antibodies (e.g., Iba1 for microglia, GFAP for astrocytes, NeuN for neurons, Claudin-5 for BBB), fluorescently-labeled secondary antibodies, mounting medium.
- Procedure:
- At the experimental endpoint, deeply anesthetize the animal and transcardially perfuse with cold saline followed by 4% PFA.
- Extract the brain and post-fix in 4% PFA for 24 hours, then transfer to a cryoprotectant solution (e.g., 30% sucrose) until the tissue sinks.
- Section the brain containing the implant track using a cryostat (e.g., 30-40 µm thick sections).
- Perform free-floating immunohistochemistry: incubate sections in blocking serum, then primary antibody overnight at 4°C, followed by appropriate secondary antibody.
- Mount the sections on glass slides and image using confocal or fluorescence microscopy.
- Quantification: Use image analysis software (e.g., ImageJ, Fiji) to measure the intensity of staining and the thickness of the glial scar (GFAP+/Iba1+ cells) at defined distances (e.g., 0-50 µm, 50-150 µm) from the implant track. Neuronal density can be quantified by counting NeuN+ cells within these same regions.
Signaling Pathways and Experimental Workflows
Inflammatory Cascade Following Implantation
Workflow for Investigating Implant Failure
The Scientist's Toolkit: Research Reagent Solutions
Table 3: Essential Reagents for Investigating BBB and Inflammation
| Reagent / Material | Primary Function | Example Application in Research | Key Considerations |
|---|---|---|---|
| Evans Blue Dye | A macroscopic and quantitative tracer for BBB integrity assessment. Binds to serum albumin. | Qualitative visualization of leaky brain regions; quantitative measurement of dye extravasation via spectrophotometry [16] [17]. | Requires careful perfusion to remove intravascular dye. |
| Fluorescein, Dextran-Conjugated Tracers | A range of fluorescent tracers of different molecular weights to assess pore size and permeability. | Using small (e.g., 376 Da fluorescein) vs. large (e.g., 70 kDa dextran) tracers to characterize the nature of BBB disruption [16] [14]. | Allows for high-resolution imaging of leakage sites. |
| Lipopolysaccharide (LPS) | A potent pro-inflammatory agent used to model systemic inflammation. | Injected peripherally to study the effects of systemic inflammation on BBB integrity and implant function [13] [14]. | Dose-dependent effects; can induce severe sickness behavior. |
| Complete Freund's Adjuvant (CFA) | An immunopotentiator used to induce chronic inflammatory pain. | Modeling how chronic pain and peripheral inflammation lead to changes in BBB TJ protein expression and function [17]. | Causes significant local tissue inflammation and pain. |
| Primary Antibodies (Iba1, GFAP, Claudin-5, Occludin) | Molecular tools for identifying specific cells and proteins via immunohistochemistry. | Iba1: staining microglia; GFAP: staining reactive astrocytes; Claudin-5/Occludin: visualizing TJ integrity [12] [17]. | Optimization of dilution and antigen retrieval is often necessary. |
| Flexible Polymer-Based Probes | Neural interfaces with a lower Young's modulus to minimize mechanical mismatch. | Comparing the foreign body response and signal longevity between traditional silicon probes and modern flexible probes [18] [11]. | Can be more difficult to implant without buckling; require specialized shuttle needles. |
| Anti-Inflammatory Coatings (e.g., Dexamethasone) | Drug-eluting coatings to suppress the acute inflammatory response post-implantation. | Applied to probes to transiently inhibit microglial and astrocytic activation, improving acute signal stability [12] [15]. | Must balance efficacy with potential interference with normal healing and neural function. |
Troubleshooting Guides & FAQs
Frequently Asked Questions
Q1: What are the primary biological factors that cause signal degradation in chronic neural implants? The primary factors are the foreign body response (FBR) and mechanical mismatch. The FBR is a cascade where device implantation activates microglia and astrocytes, leading to the formation of a dense glial scar around the implant [9] [12]. This scar tissue increases the distance between neurons and electrode recording sites, leading to a higher interfacial impedance and a decay in the signal-to-noise ratio (SNR) of recorded neuronal activities [9]. Furthermore, the mechanical mismatch between stiff implant materials and soft brain tissue (Young's modulus of 1–10 kPa) causes ongoing micromotion injury, exacerbating the chronic inflammatory response [2] [19].
Q2: How does electrode material composition influence the chronic foreign body response? The material composition directly impacts the intensity and duration of the FBR. Conventional rigid materials like silicon (~102 GPa) and platinum (~102 MPa) have a significant mechanical mismatch with brain tissue, promoting chronic inflammation and neuronal death [2] [9]. Softer, more flexible materials can reduce this mechanical mismatch. Furthermore, the surface chemistry of the material can be modified with biocompatible coatings (e.g., conducting polymers, hydrogels, or anti-inflammatory drugs) to passively resist protein adsorption or actively suppress the local immune response, thereby reducing glial scarring and improving neuronal survival around the implant [20] [21] [22].
Q3: What are the functional consequences of material-tissue interface failure? The consequences are severe for both recording and stimulation functionalities:
- For Recording: The amplitude of recorded neural signals falls off rapidly as the electrode-to-neuron distance increases. A rule of thumb is that to record isolated single-neuron signals, the electrode must be within 100 μm of the active neuron. The formation of a glial scar increases this distance, causing rapid signal attenuation and a rise in impedance, which can lead to complete recording failure [9] [19].
- For Stimulation: The current required to stimulate neurons increases with the square of the distance. Neuronal death and glial encapsulation therefore require higher stimulation currents to achieve the same effect, which can create a positive feedback loop by further exacerbating the tissue response [19].
Q4: What material strategies are emerging to extend the functional lifespan of neural electrodes? Emerging strategies focus on improving biocompatibility through material and design innovations:
- Flexible Substrates: Using polymers with a lower Young's modulus to minimize mechanical mismatch and micromotion-induced damage [9] [23].
- Surface Functionalization: Applying ultrathin, durable antifouling coatings (e.g., via photoinitiated chemical vapor deposition) to resist protein adsorption and glial adhesion [21].
- Bioactive Coatings: Covalently binding and controllably releasing anti-inflammatory drugs (e.g., dexamethasone) directly at the implant-tissue interface for several months to suppress the local immune response [22].
- Conductive Coatings: Using materials like sputtered iridium oxide (SIROF) to improve electrical properties. Studies in humans show SIROF electrodes are twice as likely to record neural activity than platinum, despite showing more physical degradation [24].
Quantitative Data on Electrode Performance
Table 1: Chronic Performance of Different Electrode Materials in Human Subjects
| Electrode Tip Material | Implantation Duration (Days) | Key Performance Finding | Physical Degradation Observation |
|---|---|---|---|
| Sputtered Iridium Oxide (SIROF) [24] | 956 – 2130 | Twice as likely to record neural activity (higher SNR) than Pt | "Pockmarked" and "cracked" degradation types observed; impedance correlated with damage metrics |
| Platinum (Pt) [24] | 956 – 2130 | Lower signal-to-noise ratio (SNR) compared to SIROF | Physical degradation observed; performance less robust than SIROF |
Table 2: Efficacy of Advanced Coating Strategies in Preclinical Models
| Coating Strategy / Material | Model / Duration | Key Outcome | Performance Improvement |
|---|---|---|---|
| piCVD Anti-fouling Coating [21] | Mouse (3 months) | 66.6% reduction in glial scarring; 84.6% enhanced neuronal preservation | Signal-to-Noise Ratio (SNR) improved from 18.0 (week 1) to 20.7 (week 13) |
| Covalently-bound Dexamethasone [22] | Animal model (≥2 months) | Significant reduction in immune reactions and scar tissue formation | Improved functional performance of electrodes for stimulating and recording |
Core Experimental Protocols for Assessing Biocompatibility
Protocol 1: In Vivo Assessment of Chronic Foreign Body Response
- Objective: To quantitatively evaluate the tissue reaction and neuronal loss around an implanted neural electrode over time.
- Methodology:
- Implantation: Stereotactically implant the neural probe into the target brain region of an animal model (e.g., mouse, rat).
- Chronic Recording: Periodically measure electrophysiological parameters, including impedance at 1 kHz and signal-to-noise ratio (SNR) of neural recordings, over the implantation period (e.g., 4, 8, 12 weeks) [24] [21].
- Histological Processing: After a predetermined survival time, perfuse and fix the brain. Section the tissue and perform immunohistochemical staining.
- Key Staining Markers:
- Image Analysis: Use confocal microscopy and quantitative image analysis to measure the thickness of the glial scar, the density of neurons, and the intensity of GFAP and Iba1 staining around the implant compared to distal regions [21].
Protocol 2: Functional Testing of Drug-Eluting Coatings
- Objective: To validate the efficacy of an anti-inflammatory drug coating on improving biocompatibility and signal stability.
- Methodology:
- Coating Fabrication: Functionalize the electrode surface (e.g., polyimide) using a chemical strategy to enable the covalent binding of an anti-inflammatory drug (e.g., dexamethasone) [22].
- In Vitro Release Kinetics: Characterize the drug release profile in phosphate-buffered saline (PBS) to confirm slow, sustained release over the desired period (e.g., 2 months) [22].
- In Vitro Biocompatibility: Test the coated material with immune cells (e.g., macrophages) to confirm a reduction in pro-inflammatory cytokine release [22].
- In Vivo Validation: Implant coated and uncoated (control) electrodes and follow Protocol 1. Compare the histological outcomes (gliosis, neuronal density) and electrophysiological performance (SNR, impedance) between the two groups to statistically demonstrate the coating's benefit [21] [22].
Key Signaling Pathways in the Foreign Body Response
The following diagram illustrates the core cellular and molecular events triggered by neural electrode implantation, leading to signal degradation.
Foreign Body Response to Neural Implants
The Scientist's Toolkit: Essential Research Reagents & Materials
Table 3: Key Materials and Reagents for Neural Interface Biocompatibility Research
| Item | Function / Application | Key Consideration |
|---|---|---|
| Flexible Polymer Substrates (e.g., Polyimide, Parylene C) [23] [15] | Base material for neural probes to reduce mechanical mismatch with brain tissue. | Young's modulus (∼1-3 GPa) is lower than silicon but still higher than brain tissue; requires rigid shuttles for implantation. |
| Conductive Coatings (e.g., Sputtered Iridium Oxide - SIROF) [24] [15] | Coating electrode sites to improve charge injection capacity and recording quality. | May exhibit different degradation patterns (pockmarks) than Platinum but can show superior chronic recording performance. |
| Anti-inflammatory Drugs (e.g., Dexamethasone) [22] | Incorporated into coatings for localized, sustained release to suppress the immune response. | Release kinetics are critical; covalent binding strategies can enable slow release over months. |
| piCVD Coating Equipment [21] | Applying ultrathin (<100 nm), uniform, and durable anti-fouling polymer coatings on complex probe geometries. | Provides superior adhesion and stability compared to wet-chemistry methods, maintaining electrical functionality. |
| Primary Antibodies for IHC (Anti-GFAP, Anti-Iba1, Anti-NeuN) [12] [21] | Immunohistochemical staining to quantify gliosis (astrocytes, microglia) and neuronal survival around explanted probes. | Essential for validating the efficacy of new materials and coatings by quantifying the biological response. |
Corrosion and Material Failure at the Electrode-Tissue Interface
Frequently Asked Questions (FAQs)
Q1: What are the primary causes of material failure in chronically implanted neural electrodes? Material failure is a major contributor to the performance degradation of neural implants. The primary causes include:
- Corrosion: Electrode materials can corrode in the highly corrosive environment of the body, leading to a loss of structural integrity and electrical functionality. Tungsten electrodes, for example, exhibit a high degree of corrosion and subsequent insulation delamination [25] [26].
- Insulation Delamination: The encapsulation or insulation layer can separate from the conductive metal. This is often a corrosion-triggered process where body fluids diffuse into the polymer-metal interface, weakening adhesion and leading to delamination [27].
- Cracking and Fracture: Mechanical strain, often caused by the mismatch between different materials within the electrode (e.g., between iridium and silicon), can lead to cracking, particularly at vulnerable points like electrical traces and recording sites [25] [11].
- De-insulation: The loss of insulation along the electrode shaft or tip increases the exposed surface area. This decreases impedance but severely compromises recording quality and selectivity [25].
Q2: How does the body's biological response contribute to electrode failure? The foreign body reaction (FBR) is a key biological driver of failure.
- Gliosis: The activation of microglia and astrocytes leads to the formation of a dense glial scar around the implant. This scar tissue insulates the electrode from nearby neurons, increasing impedance and the physical distance to viable neurons, which degrades the signal-to-noise ratio [25] [9].
- Chronic Inflammation: The initial implantation injury and persistent presence of the device trigger a chronic inflammatory state. Activated microglia release pro-inflammatory cytokines and reactive oxygen species, which can be neurotoxic and lead to the death of neurons in the vicinity of the probe [9] [2].
- Blood-Brain Barrier (BBB) Disruption: Implantation inevitably damages blood vessels, breaching the BBB. This leads to the leakage of blood cells, neurotoxic plasma proteins, and other inflammatory factors into the neural tissue, exacerbating the inflammatory response and contributing to neuronal degeneration [25] [9].
Q3: What electrode tip profiles are available and how do I select one? The tip profile can subtly influence recording and stimulation performance.
- Standard Tip: Features a sharp, robust point offering a versatile balance between penetration and durability. It is recommended for most neural recording applications [28].
- Blunted Tip: Engineered with a rounded, bullet-shaped profile. It can offer superior stimulation performance by acting more like a point source, providing improved isolation. It may also reduce the occurrence of punctured cells [28].
- Extra-Fine Tip: Features a significantly sharper taper and thinner insulation for recording from small, tightly-packed cell populations. Due to its delicate nature, it is recommended for shallow preparations [28].
- Heat-Treated Tip: Intended for penetrating tough membranes like the dura mater. The heat treatment provides a more gradual taper and toughens the polymer insulation near the tip [28].
Q4: How can the mechanical properties of an electrode lead to failure? Mechanical mismatch is a critical factor at two levels.
- Device-Tissue Mismatch: The large difference in Young's modulus between rigid electrode materials (e.g., Silicon ~100 GPa) and soft brain tissue (~1-10 kPa) means that natural brain micromotions cause strain and persistent irritation to the surrounding tissue, driving chronic inflammation [2] [11].
- Intra-Device Mismatch: Within an electrode, different materials (e.g., silicon and iridium) have clashing mechanical properties. Finite Element Modeling (FEM) shows that strain concentrates at the borders between these materials, making areas like the edges of recording sites and protruding electrical traces particularly vulnerable to cracking and delamination over time [11].
Troubleshooting Guides
Guide to Diagnosing Common Failure Modes
| Observed Problem | Potential Causes | Recommended Investigation Methods |
|---|---|---|
| Gradual increase in electrical impedance | Glial scar formation, Insulation delamination, Partial corrosion. | Electrochemical Impedance Spectroscopy (EIS), Post-explantation histology (e.g., GFAP staining for astrocytes) [25] [9]. |
| Sudden signal drop-out or increased noise | Complete trace fracture, Severe de-insulation, Electrode site detachment. | Scanning Electron Microscopy (SEM) of explanted probe, Functional testing with a known input signal [11]. |
| Loss of single-unit recording capability | Neuronal death, Glial encapsulation increasing electrode-neuron distance. | Histological analysis for neuronal markers (e.g., NeuN) and glial markers (e.g., GFAP, Iba1) [25] [9]. |
| Visible damage under microscopy | Corrosion, Cracking, Delamination of polymer encapsulation. | SEM and optical microscopy to identify the specific mode of material failure [27] [11]. |
Quantitative Data on Electrode Performance and Failure
Table 1: Chronic Recording Performance of Selected Neural Electrodes [25]
| Electrode Type | Animal Model | Experiment Duration (Days) | Yield at End of Experiment (%) | Total Failure (%) |
|---|---|---|---|---|
| Utah 10×10 | Monkey | 2104 | N/A | 79% |
| Michigan Single Shank | Mouse | 133–189 | N/A | N/A |
| Tungsten Microwire | Rat | 260 | 24.6% | 75.4% |
| Pt/Ir Microwire | Rat | 71–180 | 33% | N/A |
Table 2: Material Degradation Rates and Properties [25] [11]
| Material / Process | Parameter | Value / Rate | Context |
|---|---|---|---|
| Silicon Dioxide | Dissolution rate in aqueous environment | 3.7 – 43.5 pm h⁻¹ | Common insulation/material [25] |
| Silicon | Fracture Strength | 1800 MPa | Michigan probe substrate [11] |
| Silicon Oxide | Fracture Strength | 360 MPa | Insulating layer [11] |
| Iridium | Fracture Strength | 500 – 740 MPa | Recording site material [11] |
Experimental Protocols
Protocol: Finite Element Modeling (FEM) for Strain Analysis
Purpose: To identify regions of high mechanical strain within a planar neural electrode design due to material mismatch and motion [11].
Methodology:
- Model Creation: Develop a 3D model of the electrode in FEM software (e.g., ANSYS). The model should include all material layers (e.g., silicon substrate, silicon oxide insulation, conductive traces, iridium electrode sites) with their precise geometries.
- Material Property Assignment: Assign accurate mechanical properties (Young's modulus, Poisson's ratio, fracture strength) to each material in the model.
- Boundary Conditions and Loading: Apply a simulated displacement to the model (e.g., 1 µm in the direction normal to the probe surface) to represent micromotion between the brain and the electrode.
- Simulation and Analysis: Run the simulation to compute the von Mises Equivalent Elastic Strain. Analyze the model to identify areas of concentrated strain, particularly at the interfaces between different materials and on small protrusions like electrical traces.
Expected Outcome: The model will predict locations most vulnerable to mechanical failure, such as cracking or delamination, guiding more robust electrode design.
Protocol: Corrosion-Delamination Testing
Purpose: To experimentally investigate and model the delamination of polymer encapsulation from metal surfaces triggered by corrosive body fluids [27].
Methodology:
- Specimen Fabrication: Create test specimens with a defined 3-phase boundary (simulating body fluid, metal, and polymer). For example, sputter a metal layer (e.g., copper for accelerated testing) onto a substrate and encapsulate it with a standard polymer like PDMS (Sylgard-184).
- Accelerated Aging: Expose the specimens to a corroding agent (e.g., a solution of potassium polysulfide) to simulate long-term exposure to body fluids.
- Visual Observation and Analysis: Use optical microscopy or SEM to visually track the progression of the delamination front at the metal-polymer interface over time.
- Mathematical Modeling: Fit the experimental data to a mathematical model (e.g., a Stefan-model coupled to volume diffusion) to describe the corrosion-triggered delamination process quantitatively.
Expected Outcome: A quantitative understanding of the delamination kinetics, which can be used to predict the lifetime of encapsulated components and improve adhesion strategies.
Visualization: Integrated Failure Analysis Workflow
The Scientist's Toolkit: Research Reagent Solutions
Table 3: Essential Materials for Neural Interface Research
| Item | Function / Application | Brief Explanation |
|---|---|---|
| PDMS (Sylgard-184) | Polymer Encapsulation | A bio-inert, flexible silicone rubber widely used for insulating and encapsulating neural electrodes due to its biocompatibility and electrical isolation properties [27]. |
| Nature-Derived Materials (e.g., Chitosan, Silk Fibroin, Alginate) | Biocompatible Coatings | These materials create a hydrogel-like, ECM-mimicking buffer layer at the tissue-implant interface, reducing glial scarring and improving neuronal integration [29]. |
| Conductive Polymers (e.g., PEDOT:PSS) | Coating for Electrode Sites | Coating electrode sites with these polymers can significantly lower impedance and increase charge injection capacity, improving signal quality and stimulation efficiency [29]. |
| Iridium / Platinum | Conductive Electrode Material | Precious metals used for recording sites and stimulating electrodes due to their excellent biocompatibility and electrochemical stability (high charge injection capacity) [25] [11]. |
| Finite Element Modeling Software (e.g., ANSYS) | Mechanical Strain Analysis | Used to simulate and identify areas of high mechanical stress within an electrode design due to material mismatch, guiding design improvements before fabrication [11]. |
| Dexamethasone (DEX) | Anti-inflammatory Drug Delivery | A corticosteroid that can be incorporated into coatings (e.g., PLGA nanofibers) for localized, controlled release to suppress the chronic inflammatory response around the implant [29]. |
Building for Stability: Material, Design, and Algorithmic Solutions for Chronic Implants
Next-Generation Soft Materials and Flexible Probe Designs to Minimize Mechanical Mismatch
Troubleshooting Guides
Guide 1: Addressing Chronic Signal Degradation
Problem: Recordings from a chronically implanted neural probe show a gradual decline in signal-to-noise ratio (SNR) and loss of single-unit activity over several weeks.
| Potential Cause | Diagnostic Steps | Recommended Solution |
|---|---|---|
| Gilal Scar Formation | Perform immunohistochemistry for GFAP (astrocytes) and Iba1 (microglia) on explanted tissue. Correlate with chronic impedance measurements. [12] [9] | Switch to a softer, flexible probe material (e.g., polyimide, SU-8) to reduce chronic foreign body response. [9] [30] [31] |
| Neuronal Loss | Histologically quantify neuronal density (e.g., with NeuN staining) within a 100 µm radius of the implant track. [9] | Implement a probe with smaller, cellular-scale feature sizes (<50 µm) and ensure a lower bending modulus to minimize neuronal death. [32] |
| BBB Disruption & Chronic Inflammation | Assess serum protein leakage (e.g., IgG immunostaining) and measure pro-inflammatory cytokine levels (e.g., IL-1β, TNF-α) near the implant site. [9] [33] | Use an ultra-small, injectable probe delivered via a temporary shuttle to minimize vascular damage during insertion. [31] [32] |
| Mechanical Failure of Internal Components | Use scanning electron microscopy (SEM) to inspect for cracks in insulation or conductive traces, particularly at material interfaces. [11] | Select a probe design with minimal internal mechanical mismatch (e.g., between silicon and iridium) and consider more durable, nanocarbon-based conductors. [11] [30] |
Guide 2: Managing Acute Implantation Challenges with Flexible Probes
Problem: A new, highly flexible probe buckles or fails to penetrate the pia mater during surgical implantation.
| Potential Cause | Diagnostic Steps | Recommended Solution |
|---|---|---|
| Insufficient Probe Rigidity for Insertion | Visually observe probe behavior during a mock insertion into agarose brain phantom. | Utilize a dissolvable, stiff coating (e.g., sugar, carboxymethyl cellulose) or a biodegradable polymer shuttle that provides temporary support. [9] [31] |
| Excessive Friction with Brain Tissue | Check the probe tip geometry under a microscope; a dull tip increases penetration force. | Design probes with sharp, tapered tip geometries (e.g., < 5 µm tip diameter) to reduce tissue displacement and penetration pressure. [9] [33] |
| Improper Insertion Speed or Technique | Record the insertion force with a force sensor; a slow, hesitant insertion can cause buckling. | Employ a consistent, rapid insertion method using a precise stereotaxic actuator to ensure clean penetration. [33] |
Frequently Asked Questions (FAQs)
FAQ 1: Why is mechanical mismatch a critical issue for chronic neural implants?
Mechanical mismatch occurs when the Young's modulus of a rigid implant (e.g., silicon, ~179 GPa) is orders of magnitude higher than that of the surrounding soft brain tissue (~0.1-1 kPa). [31] [32] This stiffness difference causes:
- Chronic Inflammation: The rigid probe continuously strains the surrounding tissue, especially with natural brain micromovements, leading to persistent activation of microglia and astrocytes. [9] [11]
- Gilal Scarring: Activated glial cells form a dense, insulating sheath around the probe, which increases electrode impedance and physically pushes neurons away from the recording sites. [12] [9] [33]
- Neuronal Death: The inflammatory environment and direct mechanical stress lead to the degeneration of neurons in the immediate vicinity of the probe, permanently eliminating signal sources. [9]
FAQ 2: What are the key material properties for next-generation flexible probes?
The table below summarizes the properties of advanced materials compared to traditional options.
| Material Class | Example Materials | Young's Modulus | Key Advantages | Key Challenges |
|---|---|---|---|---|
| Conventional Rigid | Silicon, Tungsten | 100-200 GPa | High rigidity for easy insertion, well-established fabrication. [11] | Severe mechanical mismatch, chronic inflammation, signal degradation. [9] |
| Flexible Polymers | Polyimide, SU-8, Parylene | 2-5 GPa | Excellent flexibility, biocompatibility, established microfabrication. [30] [32] | Require temporary stiffeners for implantation. [31] |
| Conductive Nanocomposites | PEDOT:PSS, Graphene, Carbon Nanotubes | kPa - GPa range | Soft, conductive, high charge injection capacity, can be made porous. [30] [34] | Long-term stability, adhesion to substrates. [30] |
| 3D-Printed Soft Electronics | Conductive polymer inks | kPa - MPa range | Customizable, porous architectures, excellent tissue integration. [34] | Resolution, conductivity, and long-term stability in vivo. [34] |
FAQ 3: How do I validate the biocompatibility and integration of a new flexible probe design?
A comprehensive validation protocol should include:
- In Vivo Electrophysiology: Track the SNR and number of recordable single units from the same probe over 4-12 weeks to assess chronic performance. [9]
- Electrochemical Impedance Spectroscopy (EIS): Monitor impedance at 1 kHz periodically. A stable or decreasing impedance suggests minimal glial encapsulation, while a steady increase suggests scar formation. [12] [33]
- Histological Analysis: Upon study termination, perform:
FAQ 4: What advanced probe architectures are emerging beyond traditional shanks?
- Mesh Electronics: Ultra-flexible, macroporous probes that can be injected through fine-gauge syringes, allowing them to interpenetrate with neural tissue and achieve seamless integration with minimal immune response. [30] [31]
- 3D-Printed Porous Probes: Custom-designed, free-form probes with tissue-like porosity that enhance flexibility, permeability, and conformability with the brain or spinal cord. [34]
- Bioresorbable Probes: Temporary implants that record for a desired period and then fully dissolve, eliminating long-term foreign body risk and the need for extraction surgery. [30]
Experimental Protocols
Protocol 1: Evaluating the Foreign Body Response to an Implanted Probe
Objective: To quantitatively assess the acute and chronic tissue response following the implantation of a neural probe.
Materials:
- Neural probe of interest
- Appropriate animal model (e.g., rodent)
- Stereotaxic surgical setup
- Perfusion and fixation equipment
- Cryostat or microtome
- Primary antibodies: Anti-GFAP (astrocytes), Anti-Iba1 (microglia), Anti-NeuN (neurons)
- Fluorescently-labeled secondary antibodies
- Confocal or epifluorescence microscope
Methodology:
- Implantation: Aseptically implant the probe into the target brain region using standard stereotaxic procedures.
- Survival Time Points: Plan for survival times to capture both acute (e.g., 1, 2 weeks) and chronic (e.g., 4, 8, 12 weeks) responses.
- Perfusion and Tissue Collection: At each time point, transcardially perfuse the animal with saline followed by 4% paraformaldehyde (PFA). Extract the brain and post-fix in PFA before cryoprotecting in sucrose solution.
- Sectioning: Cut coronal sections (30-40 µm thick) containing the probe track using a cryostat.
- Immunohistochemistry:
- Permeabilize and block sections.
- Incubate with primary antibodies overnight at 4°C.
- Incubate with secondary antibodies.
- Mount slides with DAPI-containing medium.
- Image Acquisition and Quantification:
Protocol 2: Chronic In Vivo Electrophysiology and Impedance Tracking
Objective: To longitudinally monitor the recording performance and stability of a chronically implanted probe.
Materials:
- Implantable neural probe and headstage
- Neural signal acquisition system
- Data analysis software (e.g., MATLAB, Python with SpikeInterface)
Methodology:
- Baseline Recording: Within the first week post-implantation, perform multiple recording sessions to establish baseline signal quality.
- Longitudinal Data Collection: Conduct regular recording sessions (e.g., weekly) under consistent behavioral states (e.g., awake, resting).
- Signal Processing:
- Spike Sorting: Use consistent spike sorting algorithms across all sessions to isolate single units.
- Metrics Calculation: For each session, calculate:
- Signal-to-Noise Ratio (SNR):
(peak_spike_amplitude) / (std_dev_of_background_noise) - Number of Single Units: The count of well-isolated neurons.
- Unit Stability: Track the amplitude and waveform shape of the same unit across days if possible. [9]
- Signal-to-Noise Ratio (SNR):
- Impedance Monitoring: Use the acquisition system's built-in functionality or a separate impedance spectrometer to measure the electrode impedance at 1 kHz before each recording session. Plot impedance over time to correlate with signal quality changes. [12] [33]
The Scientist's Toolkit: Essential Research Reagents & Materials
| Item | Function in Research | Example Application |
|---|---|---|
| Flexible Polymer Substrates (Polyimide, SU-8) | Serves as the mechanical backbone of the probe, providing flexibility and biocompatibility. [30] [32] | Fabricating the shank of a Michigan-style or mesh electronic probe. |
| Conductive Nanocomposites (PEDOT:PSS, CNTs) | Coat electrode sites to reduce impedance and improve charge injection capacity, enhancing signal quality. [30] | Modifying standard metal (e.g., gold, Pt) electrode sites to achieve softer, more efficient interfaces. |
| Bioresorbable Coatings (Sugar, Silk, PLGA) | Provide temporary rigidity to flexible probes for reliable implantation, dissolving after placement. [9] [31] | Coating a ultra-flexible mesh probe to create a stiff, syringe-injectable needle. |
| Antibodies for Glial & Neuronal Markers | Enable histological quantification of the tissue response post-implantation. [9] [32] | Staining brain sections for GFAP, Iba1, and NeuN to measure gliosis and neuronal survival. |
Signaling Pathways and Experimental Workflows
Diagram: Tissue Response to Mechanical Mismatch
Diagram: Strategy for Biocompatible Probe Design
Advanced Biocompatible Coatings to Mitigate Immune Responses
Frequently Asked Questions (FAQs)
FAQ 1: What are the primary causes of signal degradation in chronic neural implants? Signal degradation occurs primarily due to the foreign body response (FBR). Upon implantation, devices trigger a cascade of cellular events: microglia activate within minutes, forming a cellular sheath around the implant within 24 hours. Subsequently, astrocytes form a compact glial scar over 2-3 weeks. This scar tissue acts as an insulating barrier, increasing the distance between neurons and electrode sites, leading to signal attenuation and a sharp rise in electrical impedance [12] [23].
FAQ 2: How do hydrophilic coatings improve implant functionality? Hydrophilic coatings are lubricious, meaning they significantly reduce friction during the implantation process, minimizing acute tissue damage. Furthermore, they can be engineered to serve multiple functions. Specific hydrophilic coatings can be designed to possess both antimicrobial and anti-thrombogenic (anti-clotting) properties, thereby addressing several key challenges associated with biofouling and immune activation simultaneously [35].
FAQ 3: What is the difference between "passive" and "active" coating strategies?
- Passive Strategies: Aim to make the implant "invisible" to the immune system. This is achieved by using biocompatible, inert materials or those with specific physicochemical properties (e.g., surface topography, charge) that minimize protein adsorption and cellular activation. The goal is to avoid triggering a significant immune response in the first place [23].
- Active Strategies: Go beyond evasion to actively modulate the host's immune response. This includes coatings that release anti-inflammatory drugs, bioactive molecules (e.g., cytokines), or incorporate specific immune-modulating motifs (e.g., CD47) to directly influence the behavior of immune cells, such as polarizing macrophages toward a pro-regenerative (M2) phenotype [35] [36] [37].
FAQ 4: Can you provide an example of a novel "active" immunomodulating coating? Yes. A recent innovation involves a living red blood cell (RBC) coating. Using hyaluronic acid (HA) as a bridging polymer, RBCs are attached to a substrate (e.g., PDMS). This coating leverages natural immune escape antigens present on the RBC membrane, such as CD47 and CD59. These antigens actively communicate with macrophages, promoting a shift toward the anti-inflammatory M2 phenotype and significantly reducing fibrosis in vivo compared to uncoated controls [36].
FAQ 5: What are "smart" or stimuli-responsive biomaterials? Smart biomaterials represent a paradigm shift from static implants to dynamic, responsive systems. These coatings are engineered to sense specific changes in their local microenvironment (e.g., pH, temperature, enzyme levels) and respond in a predetermined manner. Responses can include a change in the coating's physical properties or the controlled release of a therapeutic agent. This allows for highly precise, localized immunomodulation timed to specific phases of the healing process [37].
Troubleshooting Guides
Problem 1: Persistent Glial Scarring and Signal Loss
Issue: A significant increase in impedance and loss of neural signal amplitude is observed several weeks post-implantation, indicative of dense glial scar formation.
Solution:
- Employ Anti-Biofouling Coatings: Apply hydrophilic or hydrogel-based coatings to create a physical barrier that reduces protein adsorption and cell adhesion [35].
- Incorporate Active Anti-Inflammatories: Use drug-eluting coatings that release corticosteroids or other anti-inflammatory agents (e.g., Dexamethasone) in a controlled manner over the critical first few weeks to suppress the chronic inflammatory response [35] [37].
- Utilize Immunomodulatory Signals: Functionalize the coating surface with peptides or proteins (e.g., CD47 mimetics) that send "self" signals to microglia and macrophages, discouraging their pro-inflammatory activation [36].
Experimental Protocol: Coating Efficacy for Glial Scar Mitigation
- Objective: To evaluate the effectiveness of a novel coating in reducing glial scarring around neural implants in a rodent model.
- Materials: Coated and uncoated neural probes, stereotaxic surgical setup, histological staining reagents (Iba1 for microglia, GFAP for astrocytes), impedance spectrometer.
- Method:
- Implant coated and uncoated control devices into the target brain region (e.g., cortex or hippocampus) of animal subjects.
- At multiple time points (e.g., 2, 4, and 12 weeks), perform in vivo electrochemical impedance spectroscopy to track changes at the tissue-electrode interface.
- Perfuse animals and extract brains for histological analysis.
- Section tissue and immunostain for Iba1 and GFAP.
- Quantify the thickness and density of the glial scar surrounding the implant track using confocal microscopy and image analysis software.
- Expected Outcome: A significant reduction in glial scar thickness and a lower, more stable impedance profile in coated devices compared to uncoated controls.
Problem 2: Acute Inflammatory Response and Initial Insertion Trauma
Issue: The physical act of implantation causes significant tissue displacement, vascular damage, and an intense acute inflammatory reaction, compromising the initial signal quality and long-term stability.
Solution:
- Optimize Device Geometry: Design electrodes with smaller cross-sectional areas and sharper tips to minimize tissue displacement and rupture during insertion [23].
- Use Lubricious Coatings: Apply hydrophilic coatings to the device surface to reduce friction and drag forces during implantation [35].
- Implement Stiffening Shuttles: For flexible electrodes, use biodegradable or retractable rigid shuttles (e.g., made of PEG or tungsten) to ensure precise insertion, then remove the shuttle to leave a soft, compliant device in place [23].
Experimental Protocol: Assessing Insertion Damage
- Objective: To quantify the extent of acute tissue damage caused by different electrode designs and coating strategies.
- Materials: Dye-labeled dextrans (to assess blood-brain barrier breach), antibodies for early inflammatory markers (e.g., TNF-α), two-photon microscopy setup.
- Method:
- Prior to implantation, administer a fluorescent dye that extravasates upon vascular injury.
- Implant the test and control devices.
- Within hours post-implantation, use two-photon microscopy to image the implantation site in real-time, visualizing the extent of vascular leakage and immune cell recruitment.
- Analyze tissue sections for the presence and concentration of early inflammatory cytokines.
- Expected Outcome: Devices with optimized geometry and lubricious coatings should show a smaller region of vascular leakage and lower levels of acute inflammatory markers.
Problem 3: Bacterial Colonization and Infection
Issue: The implant becomes a nidus for infection, leading to a severe immune response, biofilm formation, and potential device failure.
Solution:
- Apply Antimicrobial Coatings: Incorporate agents like silver nanoparticles, antimicrobial peptides (AMPs), or antibiotics (e.g., Vancomycin) into the coating matrix [35].
- Utilize Leaching or Contact-Killing Mechanisms: Choose between coatings that release antimicrobials to kill nearby planktonic bacteria or non-leaching coatings that kill microbes upon contact [35].
Experimental Protocol: Anti-Biofilm Coating Efficacy
- Objective: To test the ability of a coating to prevent biofilm formation in vitro and in vivo.
- Materials: Coated and uncoated implant samples, bacterial cultures (e.g., S. aureus), flow cell system for in vitro biofilm growth, colony counting equipment.
- Method:
- (In vitro): Incubate coated samples in a bacterial suspension within a flow cell. After 24-48 hours, stain for live/dead bacteria and analyze biofilm biomass and thickness using confocal microscopy.
- (In vivo): Pre-contaminate implants with bacteria before insertion into an animal model. After a set period, explant the devices and perform sonication to dislodge adhered bacteria. Plate the sonicate and count colony-forming units (CFUs).
- Expected Outcome: A significant reduction in biofilm biomass and bacterial CFUs on coated devices compared to uncoated controls.
Data Presentation
Table 1: Comparison of Key Biocompatible Coating Types
| Coating Type | Primary Mechanism of Action | Key Advantages | Potential Limitations | Relevant Immune Cells Targeted |
|---|---|---|---|---|
| Hydrophilic [35] | Reduces protein adsorption & friction via lubricious surface | Excellent for insertion trauma reduction, can be multi-functional | May require rehydration, limited innate bioactivity | Macrophages, Microglia |
| Hydrophobic [35] | Repels bodily fluids, prevents cell adhesion | Creates anti-adhesive surface, self-cleaning potential | Can be difficult to apply uniformly | Macrophages, Fibroblasts |
| Drug-Eluting [35] [37] | Controlled release of anti-inflammatory or antimicrobial agents | High efficacy, targeted delivery, tunable release kinetics | Finite drug reservoir, potential for burst release | Macrophages, Microglia, Neutrophils |
| Bioactive [35] [36] | Presents biological cues (e.g., CD47) to promote integration | Actively modulates immune response, promotes healing | Complex manufacturing, potential batch variability | Macrophages (M2 polarization) |
| Stimuli-Responsive [37] | Releases drugs or changes properties in response to local cues (pH, enzymes) | "On-demand" therapy, high spatiotemporal control | Sophisticated design and characterization required | Macrophages, Microglia |
Table 2: Research Reagent Solutions for Coating Development
| Reagent / Material | Function in Experiment | Example Application |
|---|---|---|
| Hyaluronic Acid (HA) [36] | Natural polymer used as a bio-inert bridging layer or backbone for coatings. | Serves as an intermediary layer for attaching red blood cell coatings to PDMS substrates [36]. |
| Poly(Dimethylsiloxane) (PDMS) [36] | A common silicone-based organic polymer used as a flexible substrate for neural devices. | Used as a model implant material for testing the efficacy of RBC coatings in vivo [36]. |
| Poly(Lactic-co-Glycolic Acid) (PLGA) [35] | A biodegradable polymer used for controlled drug delivery. | Forms the matrix of a biodegradable coating that releases an anti-inflammatory drug as it degrades [35]. |
| Silver Nanoparticles [35] | Provide broad-spectrum antimicrobial activity. | Incorporated into a coating to prevent bacterial colonization and biofilm formation on the implant surface [35]. |
| Iba1 & GFAP Antibodies [12] | Immunohistochemical markers for microglia/macrophages and astrocytes, respectively. | Used to label and quantify the glial scar formation around explanted neural devices [12]. |
| CD68 / CD206 / CD86 Antibodies [36] | Markers for total macrophages (CD68), M2 anti-inflammatory phenotype (CD206), and M1 pro-inflammatory phenotype (CD86/CD80). | Used to characterize the polarization state of macrophages in the tissue surrounding a coated implant [36]. |
Signaling Pathways and Experimental Workflows
Immune Response Modulation by Advanced Coatings
Workflow for Coating Development & Testing
Technical Support & FAQs
This technical support center provides troubleshooting guides and frequently asked questions (FAQs) for researchers working with high-density, chronically implanted neural arrays. The content focuses on mitigating signal degradation by addressing common challenges in spike detection, sorting, and data management.
Spike Detection & Sorting
Question: Our chronic recordings show a gradual decline in spike sorting accuracy over time. What are the primary causes and potential solutions?
A decline in sorting accuracy is often linked to biological and technical factors associated with long-term implantation.
Primary Causes:
- Gliosis and Neuronal Death: The brain's foreign body response to the implant leads to the formation of a glial scar, which increases the distance between electrodes and neurons, reducing signal-to-noise ratio (SNR). Neuronal death in the immediate vicinity of the probe further diminishes detectable signals [9].
- Spike Wave-Shape Distortion: Chronic changes in brain tissue around the electrode can alter the shape of recorded action potentials, making stable clustering difficult [38].
- Physical Electrode Degradation: Long-term implantation can lead to material degradation of the electrode tips, which directly impacts recording quality and the ability to deliver stimulation [24].
Troubleshooting Recommendations:
- Implement Adaptive Algorithms: Use spike sorting algorithms that can handle non-symmetrical and unstable clusters. Clustering with a mixture of skew-t distributions is more robust than Gaussian models for dealing with skewed data shapes often encountered in chronic recordings [38].
- Employ Advanced Pre-Processing: Incorporate an adaptive detection procedure that includes multi-point alignment and statistical filtering. This helps correct for spike timing and remove falsely detected spikes caused by noise, improving the quality of data fed into the clustering algorithm [38].
- Validate with Ground Truth Data: Test your spike sorting pipeline on synthesized data or real datasets with known ground truth to quantify performance (precision and recall) across a range of SNRs [38].
Question: What spike detection methods are suitable for real-time, low-power operation on the implant itself?
On-implant detection is crucial for reducing data transmission needs. The key is to use computationally efficient and adaptive methods.
Recommended Methods:
- Nonlinear Energy Operator (NEO) with Adaptive Thresholding: The NEO method is efficient and effective at distinguishing spikes from background noise based on signal energy. For real-world use, pair it with a genetic algorithm (GA) to automatically and continuously optimize its detection threshold without human intervention. This combination is robust in noisy environments and consumes less power [39].
- Adaptive Multi-Point Alignment: Move beyond simple threshold crossing. Using both the minimum and maximum values of a detected spike for alignment reduces within-cluster variability, leading to more stable feature extraction for sorting [38].
Experimental Protocol for Evaluating Detection Algorithms:
- Data Simulation: Generate synthetic neural signals with known spike timings and varying levels of added noise.
- Algorithm Application: Run the NEO-GA detector and other baseline detectors (e.g., simple amplitude thresholding) on the simulated data.
- Performance Metrics: Calculate precision (true positives / [true positives + false positives]) and recall (true positives / [true positives + false negatives]) by comparing the algorithm's output to the known ground truth labels [39].
- Comparison: The algorithm with higher precision and recall, particularly in low SNR conditions, is superior.
Data Integrity & Compression
Question: How can we maintain data integrity while managing the massive data volumes from high-channel count arrays?
The bottleneck for high-density implants is data transfer. The most effective solution is data reduction via on-implant signal processing.
- Core Strategy: On-Implant Processing for Data Reduction. Instead of transmitting raw data, the implant should perform initial processing to extract only key information [40].
- Key Techniques:
- Spike Detection: Transmit only the timestamp and features of detected spike events, drastically reducing data compared to a continuous raw signal [40] [39].
- Feature Extraction and Compression: Use temporal and spatial compression techniques on the neural signal. This can involve compressing the waveform of each spike or leveraging correlations across multiple electrodes to reduce redundant information [40].
Hardware & Electrode Performance
Question: How does electrode material choice impact long-term recording stability and stimulation capability?
The material of the electrode tip is a critical factor in the longevity and functionality of a chronic implant.
- Quantitative Comparison: The table below summarizes findings from a long-term human study comparing two common materials [24].
| Electrode Material | Key Characteristics | Long-Term Recording Performance (SNR) | Stimulation Performance | Observed Degradation |
|---|---|---|---|---|
| Platinum (Pt) | Conventional material | Lower likelihood of recording neural activity | Standard | Physical degradation observed |
| Sputtered Iridium Oxide Film (SIROF) | High charge-transfer capacity | Twice as likely to record neural activity than Pt | Reliable; performance linked to impedance | "Pockmarked" or "cracked" degradation; impedance correlated with damage |
Question: What are the emerging hardware solutions for minimizing chronic immune response and signal degradation?
New probe designs focus on improving biocompatibility to better match the mechanical properties of brain tissue.
- Soft and Flexible Probes: Traditional rigid probes (e.g., silicon, tungsten) cause significant chronic inflammation. Emerging probes use polymer-based materials that are "thousands to millions of times softer," which drastically reduces scar tissue formation and helps maintain a high-quality signal interface over time [41].
- Modular and Adjustable Implants: New implant kits allow for vertical adjustment of probes with micron precision post-implantation. This enables researchers to slowly navigate probes to areas with strong neuronal signals, minimizing tissue damage and irritation during the chronic recording period [42].
Experimental Protocols & Workflows
Question: What is a robust methodological workflow for processing neural data from a chronic implant?
The following diagram illustrates a recommended workflow that incorporates adaptive techniques to combat signal instability.
Question: What is the biological mechanism behind chronic signal degradation, and how do next-generation probes address it?
Understanding the biological cascade triggered by implantation is key to developing solutions.
The Scientist's Toolkit: Research Reagent Solutions
The table below lists key materials and computational tools essential for experiments in chronic neural signal processing.
| Item Name | Type/Model (if applicable) | Function & Explanation |
|---|---|---|
| Neuropixels Probe | Hardware | High-density CMOS-based silicon probe with integrated amplifiers, enabling recording from over 1000 sites simultaneously [9] [42]. |
| SIROF Electrodes | Material | Sputtered Iridium Oxide Film electrode tips offer superior charge-transfer capacity, leading to a higher likelihood of recording neural activity long-term compared to Platinum [24]. |
| Fleuron Material | Material | A novel, soft polymer used in next-generation neural probes. Its high flexibility and biocompatibility significantly reduce glial scarring and chronic immune response [41]. |
| Modular Chronic Implant Kit | Hardware | A 3D-printed, customizable implant system for rats. It allows vertical probe adjustment with micron precision, facilitating chronic recordings and reducing tissue damage [42]. |
| ROSS Toolbox | Software | An open-source MATLAB toolbox for spike sorting that implements the automatic algorithm based on adaptive detection and skew-t clustering, useful for handling unstable recordings [38]. |
| Genetic Algorithm (GA) for NEO | Algorithm | An evolutionary optimization method used to automatically adjust the threshold in the Nonlinear Energy Operator (NEO), enabling robust, real-time spike detection in noisy signals [39]. |
Real-Time Neural Decoding Platforms for Adaptive Closed-Loop Therapies
Troubleshooting Common Experimental Challenges
Q1: Our neural decoder's performance drops significantly during online, real-time testing compared to offline validation. What could be causing this?
- Cause: Offline decoding often benefits from data pre-processing that is not causal (uses future data), while real-time systems must rely only on past and present information, leading to a performance gap [43].
- Solution: Implement and validate models specifically designed for causal, online inference. Architectures like state-space models (SSMs) are inherently recurrent and can update predictions with millisecond latency as new neural data arrives, making them suitable for real-time operation [43].
Q2: We are experiencing significant signal degradation and increased impedance in our chronic neural implants over several weeks. How can this be mitigated?
- Cause: The body's foreign body response, including inflammation and glial scar formation, creates a physical barrier between the electrode and neurons, degrading signal quality [44] [45].
- Solution: Utilize flexible, biocompatible materials that minimize mechanical mismatch with neural tissue. Substrates like polyimide or parylene-C, combined with conductive polymers such as PEDOT:PSS, are more compliant and can reduce chronic inflammation. Furthermore, ensure robust packaging and encapsulation (e.g., with parylene-C) to protect the electronics from the physiological environment [44].
Q3: Our decoding model, trained on one subject or session, fails to generalize to new subjects or even the same subject on a different day. How can we improve generalization?
- Cause: Neural data can have high variability across individuals and even across sessions due to factors like electrode drift, changes in neural populations, and physiological state [43] [46].
- Solution 1: Multi-dataset Pretraining: Pretrain your model on large, diverse neural datasets from multiple subjects and sessions. This helps the model learn robust, generalizable neural representations [43].
- Solution 2: Connectomic Fingerprinting: Instead of relying on precise anatomical coordinates, select recording channels based on their functional or structural connectivity profiles. This connectomic approach allows for a priori channel selection that generalizes across individuals with different implant locations [46].
Q4: The computational complexity of our decoding model creates high latency, making it unsuitable for true real-time, closed-loop applications. What are our options?
- Cause: Complex models like large Transformers have high computational demands and memory requirements, which can bottleneck inference speed [43] [47].
- Solution: Explore hybrid or efficient architectures.
- Hybrid SSMs: Models like POSSM combine the flexible input processing of attention mechanisms with the efficient, constant-time recurrence of State-Space Models, offering high accuracy with significantly lower computational cost (up to 9x speedup reported) [43].
- Hardware-Friendly Algorithms: For implantable applications, consider algorithms inspired by hyperdimensional computing that reduce dependence on complex mathematical models, lowering power consumption and enabling FPGA or ASIC implementation [47].
Experimental Protocols for Key Methodologies
Protocol: Cross-Subject Generalization using Connectomic Decoding
Objective: To train a neural decoder that can accurately predict behavior (e.g., movement) in a new subject without requiring subject-specific training data [46].
Materials:
- Neural recording data (e.g., ECoG, LFP) and synchronized behavioral data from multiple subjects.
- Normative brain connectome dataset (e.g., from a standardized brain atlas).
- Software for mapping electrode locations to standard (MNI) space.
Methodology:
- Data Alignment: For all subjects, localize each recording channel in standard Montreal Neurological Institute (MNI) space.
- Performance Mapping: Train patient-specific decoders and calculate the decoding performance for each channel.
- Connectomic Template Creation: For each channel, seed a whole-brain connectivity map from its MNI coordinates. Perform a voxel-wise correlation across all subjects to identify which brain networks are consistently associated with high decoding performance. This produces a "connectomic decoding network map" [46].
- A Priori Channel Selection: For a new subject, identify the individual recording channel whose connectivity fingerprint has the highest overlap with the optimal connectomic template.
- Model Application: Use the features from this pre-selected channel with a pre-trained model to decode behavior in the new subject.
Protocol: Real-Time Decoding with a Hybrid State-Space Model (POSSM)
Objective: To decode behavioral variables from neural spiking activity with high accuracy and low latency for closed-loop control [43].
Materials:
- Stream of timestamped neural spike data.
- Computational environment capable of running PyTorch/TensorFlow models.
Methodology:
- Input Tokenization: For a short, contiguous time chunk (e.g., 50 ms), represent all spikes within that window as tokens. Each token combines a learnable embedding for the neuron's identity and a rotary position embedding for the spike's precise timestamp [43].
- Cross-Attention Encoding: Process the variable number of spike tokens through a cross-attention module. This projects the sparse spikes into a fixed-dimensional latent vector that summarizes the neural state for that time chunk [43].
- Recurrent State Update: Feed this latent vector into a State-Space Model (SSM) backbone. The SSM updates its hidden state recurrently, incorporating the new neural information to make a prediction (e.g., kinematic velocity or discrete state).
- Output: The model outputs a prediction for the current or impending behavior. The process repeats for the next time chunk, enabling continuous, real-time decoding.
The following diagram illustrates the POSSM architecture workflow:
Protocol: Feature Selection for Defensive Behavior Decoding
Objective: To identify the most informative local field potential (LFP) features for accurately predicting defensive behaviors (e.g., freezing) in real-time [48].
Materials:
- LFP recordings from relevant brain regions (e.g., infralimbic cortex, basolateral amygdala).
- Synchronized video and/or accelerometer data for behavioral scoring.
- Machine learning environment (Python/R) with LightGBM and SHAP libraries.
Methodology:
- Feature Extraction: From consecutive short-time windows of LFP data (e.g., 1-second windows, updated every 100 ms), extract a comprehensive set of features:
- Model Training: Train a Light Gradient-Boosting Machine (LightGBM) regressor/classifier to predict the behavioral metric from the extracted features.
- Feature Importance Evaluation: Use SHapley Additive exPlanations (SHAP) to compute the importance of each feature for the model's predictions.
- Feature Selection: Retrain the model using only the top-ranked features (e.g., high-gamma power, power ratios, and inter-regional correlations have been shown to be highly informative) [48]. This simplifies the model and can improve real-time performance.
Performance Data & Computational Benchmarks
Decoding Performance Across Modalities and Algorithms
Table 1: Benchmarking performance of various decoding approaches across different neural signals and behaviors.
| Decoding Task | Neural Signal | Algorithm | Performance Metric & Result | Key Advantage |
|---|---|---|---|---|
| Motor Decoding (NHP/Human) [43] | Intracortical Spikes | POSSM (Hybrid SSM) | Accuracy comparable to SOTA Transformers | Inference speed up to 9x faster on GPU |
| Defensive Behavior (Rat) [48] | LFP (IL-BLA) | LightGBM | Mean R²: 0.5357 (Jerk), 0.3476 (Bar Press); Pearson R: 0.7579, 0.6092 | Low latency: <110 ms training, <1 ms inference |
| Movement Detection (Human ECoG) [46] | ECoG | Ridge Regression | Balanced Accuracy: 0.8 (sample), 0.98 (movement detection rate) | Generalizable across patients via connectomics |
| Saccade Angle (NHP) [47] | Intracortical Spikes | Hyperdimensional Computing | Accuracy: 51.5% (8 angles) | Ultra-low power (9.32 µW) and hardware-friendly |
Computational Efficiency of Decoding Algorithms
Table 2: Comparison of computational characteristics for implantable brain-machine interface (BMI) applications.
| Algorithm | Computational Complexity | Hardware Feasibility | Power Consumption | Reported Latency |
|---|---|---|---|---|
| POSSM (Hybrid SSM) [43] | Lower than Transformers | Suitable for GPU acceleration | Not specified (Lower compute load) | Millisecond-level, real-time |
| LightGBM [48] | Low for inference | CPU-friendly | Not specified | <1 ms inference |
| Hyperdimensional Computing [47] | Very Low | FPGA/ASIC (180 nm), 2.3 KB RAM | 9.32 µW @ 1.8V | Suitable for real-time |
| Recurrent Neural Networks [43] | Moderate | Requires specialized hardware | Moderate | Low latency |
| Transformer-based [43] | High (Quadratic) | Challenging for implantables | High | Higher latency |
The Scientist's Toolkit: Research Reagents & Materials
Table 3: Essential materials and computational tools for developing real-time neural decoding platforms.
| Item / Solution | Function / Application | Key Characteristics |
|---|---|---|
| Flexible Neural Probes [44] | Chronic neural recording interface | Substrates: Polyimide, Parylene-C. Conductors: PEDOT:PSS, PPy. High flexibility for reduced gliosis. |
| Organic Electrochemical Transistors(OECTs / IGTs) [44] | Neural signal transduction & amplification | Intrinsic ion-electron coupling, mechanical compliance, operates at low voltages. |
| py_neuromodulation [46] | Open-source Python platform for invasive brain signal analysis | Modular feature extraction (spectral, temporal, connectivity). Facilitates standardized decoding. |
| State-Space Models (SSMs) [43] | Backbone for low-latency, recurrent decoding | Efficient online inference, constant-time state updates, strong long-range dependency modeling. |
| LightGBM [48] | Machine learning model for fast decoding | Gradient boosting framework, fast training and inference, handles tabular feature data well. |
| SHAP (SHapley Additive exPlanations) [48] | Model interpretation and feature importance | Identifies most informative neuro-markers, guides feature selection for optimal performance. |
System Integration Workflow
The following diagram outlines the complete workflow for an adaptive closed-loop therapy system, from signal acquisition to therapeutic intervention:
Connectomics-Informed Decoding to Generalize Across Patient Cohorts
Troubleshooting Guides and FAQs
Frequently Asked Questions
Q1: What is the primary advantage of using a connectomics-informed approach for neural decoding over patient-specific models?
A connectomics-informed approach allows for the creation of generalized decoding models that do not require retraining for each individual patient. By using the brain's network structure (its "wiring diagram") as a common reference frame, models can be applied across different patients and even cohorts from different continents. This overcomes the major clinical limitation of patient-specific models, which require tedious, individual training sessions that burden both patients and medical staff [46] [49].
Q2: Why might my movement decoding performance be lower in patients with more severe Parkinson's disease symptoms?
Research has consistently shown a negative correlation between decoding performance and clinical symptom severity in Parkinson's disease, as measured by the Unified Parkinson's Disease Rating Scale (UPDRS) [46] [49]. This correlation has been replicated across independent cohorts. A leading hypothesis is that the underlying neurodegeneration impacts how movement is neurally encoded, which in turn impedes the machine learning model's ability to decode it accurately.
Q3: How does therapeutic Deep Brain Stimulation (DBS) affect real-time decoding, and how can I mitigate this?
Therapeutic high-frequency (130 Hz) subthalamic nucleus DBS can significantly deteriorate sample-wise decoding performance in some patients. Standard processing steps to mitigate DBS artefacts, such as bandpass filtering and period-based artefact removal, may not improve and can even aggravate this deterioration [46]. A more effective strategy is to train models separately for stimulation ON and OFF conditions, as this has been shown to outperform models trained on either condition alone [46] [49].
Q4: What are the main factors contributing to the long-term degradation of neural implant signals?
Long-term signal degradation is a multi-factorial problem. Key contributors include:
- Foreign Body Response: The insertion and chronic presence of the probe triggers gliosis, where a dense encapsulation layer (glial scar) formed by reactive astrocytes and microglia surrounds the implant [9] [12]. This increases the distance between electrodes and neurons, raising impedance and degrading the signal-to-noise ratio (SNR).
- Neuronal Death: Pro-inflammatory cytokines and oxidative stress from the chronic inflammatory response lead to neuronal death in the immediate vicinity (within ~100-150 µm) of the probe, resulting in signal loss [9] [12].
- Physical Material Degradation: Electrodes sustain physical damage over years of implantation. Studies of explanted arrays show different degradation types like "pockmarked" and "cracked" surfaces, which correlate with functional performance metrics like SNR and impedance [24].
Q5: My electrode impedance has increased sharply 2-4 weeks post-implantation. Is this normal?
Yes, this is a typical acute-phase tissue response. A peak in electrochemical impedance magnitude is often observed over the first 2-4 weeks following insertion as a compact glial sheath forms around the device, creating a diffusion barrier that limits ionic exchange. The impedance often stabilizes after this period [12].
Troubleshooting Guide: Common Problems and Solutions
| Problem | Potential Causes | Recommended Solutions & Mitigation Strategies |
|---|---|---|
| Poor cross-patient decoding performance | • Individual anatomical variability in electrode placement.• Model overfitted to a specific patient cohort or disease state. | • Implement a connectomic decoding network map. Select recording channels based on their network overlap with an optimal template derived from normative connectomes [46].• Use contrastive learning (e.g., CEBRA) to transform neural features into a consistent embedding space across subjects [46] [49]. |
| Gradual decline in signal-to-noise ratio (SNR) over months | • Chronic foreign body response (gliosis) increasing electrode-tissue distance.• Neuronal death near the electrode site.• Physical degradation of the electrode material itself. | • Consider electrode material choice. Sputtered Iridium Oxide Film (SIROF) electrodes have been shown to be twice as likely to record neural activity than Platinum (Pt) despite showing greater physical degradation [24].• Explore next-generation, more biocompatible materials and probe designs (e.g., flexible, smaller footprint) to minimize mechanical mismatch and chronic inflammation [9]. |
| Unstable decoding performance during adaptive DBS | • Electrical stimulation artefacts corrupting the neural signal.• Stimulation-induced changes in the underlying network state. | • Train separate decoder models for stimulation ON and OFF conditions [46].• Investigate artefact rejection methods tailored to your specific stimulation parameters, noting that standard filtering may be insufficient [46]. |
| Failure to detect individual movement events | • Model is tuned for sample-wise (e.g., 100 ms) classification but lacks temporal smoothing for detecting sustained actions. | • Define a "movement detection rate" metric based on a consecutive duration of movement classification (e.g., 300 ms) to establish a more robust, coarse metric for detecting movement entities [46]. |
| Acute signal loss post-implantation | • Insertion trauma and acute inflammatory response (microglial activation, BBB disruption).• Electrode displacement. | • Allow for an adequate post-surgical stabilization period as the acute tissue response settles [50].• Validate electrode locations via post-op imaging to rule out macroscopic displacement. |
Experimental Protocols & Data
Key Experimental Workflow for Connectomics-Informed Decoding
The following workflow is adapted from the py_neuromodulation platform, which was validated across 73 neurosurgical patients [46] [49].
Quantitative Data on Decoding Performance and Electrode Degradation
Table 1: Cross-Validation Performance of Generalizable Movement Decoders [46] [49] This table summarizes the balanced accuracy (mean ± std) of different approaches for movement decoding without patient-specific training.
| Decoding Approach | Sample-Wise (Rest vs. Move) | Movement Detection Rate | Key Advantage |
|---|---|---|---|
| Grid Extrapolation | 0.63 ± 0.10 | 0.74 ± 0.18 | Simple spatial mapping |
| Connectomics (Linear Model) | 0.65 ± 0.09 | 0.77 ± 0.16 | Accounts for network structure |
| Connectomics with CEBRA | 0.67 ± 0.10 | 0.79 ± 0.16 | Highest performance & cross-cohort generalizability |
Table 2: Correlating Physical Electrode Degradation with Functional Performance [24] Data from 980 explanted microelectrodes in humans, implanted for 956-2130 days.
| Electrode Material | Likelihood to Record Neural Activity (vs. Pt) | Correlation of 1 kHz Impedance with Physical Damage | Notable Degradation Patterns |
|---|---|---|---|
| Platinum (Pt) | (Baseline) | Weak or Non-Significant | Cracking |
| Sputtered Iridium Oxide (SIROF) | ~2x Higher | Significantly Correlated | "Pockmarked" surface (especially on stimulated electrodes) |
The Scientist's Toolkit: Research Reagent Solutions
Table 3: Essential Materials and Computational Tools for Connectomics-Informed Decoding
| Item | Function / Rationale | Example / Note |
|---|---|---|
py_neuromodulation |
An open-source, modular Python platform for standardized implementation of brain signal decoding algorithms. It allows flexible extraction of oscillatory, waveform, and connectivity features [46] [49]. | Core software platform for reproducible analysis. |
| Normative Connectome Atlas | Provides a standard reference for whole-brain structural and functional connectivity. Used to generate connectivity "fingerprints" for electrode locations in standard (MNI) space [46] [51]. | e.g., Human Connectome Project data. |
| CEBRA (Contrastive Learning) | A machine learning method used to transform neural features into a lower-dimensional embedding that shows high consistency across participants, improving model generalization [46] [49]. | Used for creating subject-invariant feature embeddings. |
| Sputtered Iridium Oxide Film (SIROF) | An electrode coating material demonstrated to have superior functional performance for chronic recording compared to Platinum, maintaining higher signal-to-noise ratio despite physical degradation [24]. | Critical for improving chronic recording stability. |
| High-Fidelity Brain Scanner | Advanced MRI scanners (e.g., Connectome 2.0) are used to acquire the high-resolution diffusion and functional data needed to build the detailed connectome maps that inform the decoding models [51]. | Provides the foundational imaging data. |
Sustaining Performance: Diagnostic and Restorative Strategies for Existing Implants
Troubleshooting Guide & FAQs
This guide helps researchers diagnose common failure modes in chronic neural implant studies. A systematic approach is required to differentiate between biological responses and technical device failures, as both lead to signal degradation [10] [9].
Frequently Asked Questions
Q1: My recorded neural signal amplitude has gradually decreased over several weeks. Is this a biological or technical failure?
A: A gradual decline in signal amplitude is most commonly associated with biological failure modes [9] [19]. This is typically caused by the formation of a glial scar (gliosis), which increases the distance between your electrodes and the target neurons. Since recorded signal amplitude falls off rapidly with distance (approximately 1/r for monopolar sources and 1/r² for dipolar sources), even a small increase in distance can cause significant signal loss [19]. To confirm:
- Check Electrode Impedance: A concurrent steady increase in electrochemical impedance often accompanies glial scar formation [10].
- Review Histology: Post-explant histology for markers like GFAP (reactive astrocytes) and Iba1 (activated microglia) can confirm the biological tissue response [9].
Q2: My device has suddenly and completely stopped recording any neural activity on specific channels, while others remain functional. What should I check first?
A: A sudden, complete loss of signal on specific channels is highly indicative of a technical failure [10] [11]. This suggests a physical break in the signal pathway. Your diagnostic steps should be:
- Perform Visual Inspection: Use scanning electron microscopy (SEM) to examine the explanted probe for cracked insulation, broken conductive traces, or delamination of materials, particularly at the points of mechanical strain identified in the diagram below [10] [11].
- Run Impedance Spectroscopy: A very high or infinite impedance reading on the affected channels suggests a broken trace or connection [10].
Q3: The signal-to-noise ratio (SNR) of my recordings has become inconsistent, varying from day to day. What could be causing this?
A: Inconsistent SNR is often linked to ongoing mechanical strain at the tissue-electrode interface, which can have both biological and technical consequences [19]. The mechanical mismatch between the rigid probe and soft brain tissue, combined with natural brain micromotion (which can exceed 10 µm), causes strain [19]. This can:
- Cause Tissue Damage: Chronic inflammation and neuronal death, disrupting stable neural populations [9] [19].
- Damage the Device: Lead to mechanical fatigue and failure of the probe's materials over time [10].
- Investigate Stabilization: Ensure the implant is properly stabilized to minimize relative motion. Consider the use of more flexible materials in future designs to reduce mechanical mismatch [9] [2].
Diagnostic Data Tables
The following tables summarize key characteristics and diagnostic results for different failure modes.
Table 1: Characteristic Signatures of Primary Failure Modes
| Feature | Biological Failure | Technical Failure |
|---|---|---|
| Onset | Gradual (weeks to months) | Sudden or incremental |
| Signal Change | Progressive decline in amplitude & SNR | Sudden signal loss or step-wise degradation |
| Impedance Trend | Steady increase over time [10] | Sudden shift to open-circuit (very high) or short-circuit (very low) |
| Affected Channels | Often widespread across multiple channels | Can be isolated to specific channels or shanks [10] |
| Post-explant Evidence | Gliosis, neuronal loss, BBB disruption [9] | Cracked insulation, broken traces, material delamination [10] [11] |
Table 2: Key Experimental Metrics for Differentiation
| Metric | Method | Indication of Biological Failure | Indication of Technical Failure |
|---|---|---|---|
| Electrochemical Impedance Spectroscopy (EIS) | Measure impedance at 1 kHz [10] | Steady, chronic increase | Sudden, catastrophic change |
| Signal Amplitude | Track single-unit amplitude over time [10] | Slow, continuous decrease | Abrupt drop to noise floor |
| Multi-unit Activity | Evoked potential recordings [10] | General reduction across many channels | Loss on specific channels only |
| Scanning Electron Microscopy (SEM) | Visual inspection of explanted probe | Little to no physical damage | Visible cracks, delamination, or corrosion [10] [11] |
Experimental Protocols for Failure Analysis
Protocol 1: Correlative Analysis of Recording Performance and Material Integrity
This protocol combines functional electrophysiology with physical inspection to link performance degradation to specific device failures [10].
- Objective: To correlate the degradation of electrophysiological recording quality with mechanical damage on planar silicon-based neural probes.
- Materials:
- Chronically implanted mice (e.g., in visual cortex V1m)
- Single-shank Michigan-style silicon electrode
- Standard electrophysiology recording system
- Electrochemical impedance spectrometer
- Scanning Electron Microscope (SEM)
- Methodology:
- Chronic Recording: Implant probes and conduct longitudinal recordings (e.g., over 133-189 days) in vivo [10].
- Functional Assessment: Periodically measure single-unit activity, evoked multi-unit recordings, and electrochemical impedance spectroscopy [10].
- Physical Inspection: Upon explant, examine the probe using SEM. Focus on the interface between iridium recording sites and polysilicon traces, as these are strain concentration points [10] [11].
- Expected Outcome: A direct correlation is often found between recording failure on specific channels and visible damage (e.g., cracks in the polysilicon trace) near the electrode site [10].
Protocol 2: Finite Element Modeling of Mechanical Strain
Use computational modeling to identify probe microstructures vulnerable to mechanical failure during chronic implantation [10] [11].
- Objective: To simulate the mechanical strain on a planar silicon electrode caused by micromotion and identify high-risk areas for failure.
- Materials:
- Finite Element Model (FEM) software (e.g., ANSYS)
- 3D model of the electrode with accurate material properties and geometry [10].
- Methodology:
- Model Setup: Develop a 3D model of a 15 µm thick, 123 µm wide planar silicon electrode. Include key features like 0.6 µm protruded electrical traces and iridium recording sites [10].
- Define Materials: Assign material properties (Young's modulus, Poisson's ratio) for silicon (~200 GPa), iridium (~528 GPa), and the brain tissue (~6 kPa) [10] [19].
- Apply Forces: Simulate brain micromotion by applying a small displacement (e.g., 1 µm) to the tip of the electrode while fixing the base [10].
- Analyze Strain: Calculate the von Mises Equivalent Elastic Strain to identify areas of concentrated strain [10].
- Expected Outcome: The model will show that mechanical strain is concentrated along the border between different materials (e.g., iridium and silicon) and is further focused on small protrusions like electrical traces [10] [11].
The Scientist's Toolkit
Table 3: Essential Research Reagents and Materials
| Item | Function/Brief Explanation |
|---|---|
| Michigan-style Silicon Probe | A planar, thin-film microfabricated array allowing for multi-site recordings along the shank depth [10] [9]. |
| Finite Element Modeling Software (e.g., ANSYS) | Used to simulate mechanical strain within the probe structure to predict high-risk failure points before fabrication and implantation [10] [11]. |
| Electrochemical Impedance Spectrometer | A key tool for monitoring the status of the electrode-tissue interface; increasing impedance suggests biological encapsulation [10]. |
| Scanning Electron Microscope (SEM) | Provides high-resolution images of explanted probes to identify physical damage like trace cracks or insulation delamination [10]. |
| Antibodies (GFAP, Iba1) | Used for immunohistochemistry to label reactive astrocytes (GFAP) and activated microglia (Iba1), quantifying the biological immune response [9]. |
Diagnostic Workflow and Signaling Pathways
The following diagram illustrates the logical workflow for diagnosing failure modes in chronic neural implants, integrating the key questions and methods discussed above.
The diagram below illustrates the primary signaling pathways of the biological tissue response to an implanted neural probe, leading to signal degradation.
Signal Restoration through Degradation-Aware Imputation (e.g., CW-BLR)
Troubleshooting Guide: Common Issues with Neural Signal Imputation
Q1: My decoder's performance drops significantly a few weeks after implantation. The neural signals seem to have degraded. What approaches can restore decoding accuracy?
A: Signal degradation in chronic neural implants is typically addressed through data imputation methods. The optimal approach depends on your signal characteristics and computational constraints [52]:
- For quick, baseline restoration: Start with Mean Imputation (Mean-imp), which replaces degraded data points with the mean value from high-quality data. Be aware that this method ignores temporal and spatial structures, which can distort movement-related information [52].
- For robust, general-purpose imputation: Use Gaussian-Mixture-Model-based Expectation-Maximization (GMM-EM). This method iteratively estimates missing values and can preserve temporal patterns better than mean imputation. However, it can be computationally intensive and may overfit or introduce bias due to its Gaussian assumptions [52].
- For superior, degradation-aware performance: Implement Confidence-Weighted Bayesian Linear Regression (CW-BLR). This state-of-the-art method uses quality metrics (like Signal-to-Noise Ratio for MUA and Coherence for LFP) as confidence weights to guide the imputation process. It effectively preserves temporal and spatial dependencies within neural signals, leading to significantly more stable long-term decoding [53] [52].
Q2: How do I know which neural features are most important to focus on for imputation in motor decoding tasks?
A: Research indicates that not all neural features contribute equally to decoding forelimb movements. You should prioritize imputation for features with the highest predictive power. The table below summarizes the contribution of different neural features to predicting forelimb movement velocity, based on experimental results from a kSIR decoder and Maximal Information Coefficient (MIC) analysis [52].
Table 1: Contribution of Neural Features to Forelimb Movement Decoding
| Neural Feature Type | Specific Feature | Contribution to Decoding | Correlation with Movement (MIC) |
|---|---|---|---|
| Multiunit Activity (MUA) | Binned spike counts from individual channels | High contribution | Strongest correlation |
| Local Field Potential (LFP) | High-frequency bands (γ and γ') | Moderate contribution | Strong correlation |
| Local Field Potential (LFP) | Low-frequency bands (δ, θ, α, and β) | Lower contribution | Weaker correlation |
Q3: After imputation, my decoder works well initially but performance decays again over time. Should I retrain the decoder?
A: Retraining a decoder on deteriorating data is a common but flawed strategy, as model performance will continue to decline with input data quality [52]. A more robust approach is to integrate a degradation-aware imputation model, like CW-BLR, directly into your processing pipeline. This model continuously restores signal integrity by using confidence-based quality metrics, providing stable features for your decoder across fluctuating signal quality scenarios. This eliminates or significantly reduces the need for frequent retraining [53] [52].
Q4: What are the primary biological causes of signal degradation that make imputation necessary?
A: The need for signal restoration stems from the body's reaction to the implanted device [9] [15]:
- Foreign Body Reaction (FBR): The immune system recognizes the implant as a foreign object, triggering inflammation.
- Gliosis: A dense layer of cells (primarily reactive astrocytes and microglia) forms a glial scar around the probe. This scar increases the distance between neurons and recording electrodes, attenuating the signal and increasing impedance [9].
- Neuronal Death: Pro-inflammatory cytokines and oxidative stress from the chronic inflammation can kill neurons in the vicinity of the probe, leading to a permanent loss of signal sources [9].
- Mechanical Mismatch: The stiffness of traditional probes causes micromotion injuries against soft brain tissue, exacerbating the inflammatory response over time [9] [23].
Experimental Protocol: Validating CW-BLR for Motor Decoding
This protocol outlines the key methodology for implementing and testing the Confidence-Weighted Bayesian Linear Regression (CW-BLR) imputation technique, based on the experiment described by Kuo et al. [53] [52].
1. Objective: To evaluate the efficacy of the CW-BLR algorithm in imputing degraded multiunit activity (MUA) and local field potential (LFP) signals for stable long-term decoding of forelimb movement trajectories.
2. Experimental Setup and Subjects:
- Subjects: Four Wistar rats trained to perform a forelimb-reaching task.
- Neural Recording: Implantable microelectrodes are used to record neural activity (MUA and LFPs) from relevant motor areas over a period of 27 days. Days 1-7 are designated the high-quality baseline period. Days 8-27 are the degraded signal period [52].
3. Data Processing Workflow: The following diagram illustrates the core signal processing and decoding workflow.
4. Key Steps and Methodologies:
- Feature Extraction:
- MUA: Convert raw spikes to binned firing counts.
- LFP: Decompose signals using spectral analysis (e.g., wavelet transform) to extract power in six frequency bands: δ (0.5-4 Hz), θ (4-8 Hz), α (8-12 Hz), β (12-30 Hz), γ (30-80 Hz), and γ' (80-200 Hz) [52].
- Quality Metric Calculation:
- For MUA signals, calculate the Signal-to-Noise Ratio (SNR).
- For LFP signals, calculate the Coherence (Coh) with a reference signal or across channels. These metrics serve as confidence weights in the CW-BLR model [52].
- Decoder Training and Tuning:
- Train a Kernel-Sliced Inverse Regression (kSIR) decoder using only the high-quality data from Days 1-7.
- Use five-fold cross-validation to find optimal tuning parameters. The cited study found the lowest Root Mean Square Error (RMSE) for forelimb velocity prediction with a kernel width (σ) of 0.9 and a regularization parameter (r) of 0.10 [52].
- Performance Evaluation:
- From Days 8-27, apply CW-BLR (and other methods for comparison) to impute the degraded neural features.
- Feed the imputed data into the pre-trained kSIR decoder to predict forelimb movement trajectories (e.g., x- and y-velocity).
- Quantify performance using Root Mean Square Error (RMSE) between the decoded and actual movements. Compare the RMSE of CW-BLR against traditional methods (Mean-imp, GMM-EM) [52].
Quantitative Performance Comparison of Imputation Methods
The following table summarizes the quantitative findings from the benchmark study, comparing the long-term decoding performance after applying different imputation methods to degraded signals [52].
Table 2: Performance Comparison of Neural Signal Imputation Methods
| Imputation Method | Key Principle | Advantages | Limitations / Performance Outcome |
|---|---|---|---|
| Mean Imputation (Mean-imp) | Replaces degraded data with the dataset's mean value. | Simple and computationally fast. | Disregards temporal/spatial structure. Lowest decoding accuracy over time. |
| GMM-EM | Models data with Gaussian distributions and iteratively estimates missing values. | More robust than Mean-imp; can preserve temporal patterns. | Computationally heavy; can overfit; biased by Gaussian assumptions. Moderate decoding accuracy. |
| CW-BLR (Proposed Method) | Uses Bayesian linear regression weighted by signal quality confidence metrics (SNR, Coh). | Preserves temporal & spatial dependencies; degradation-aware. | More complex implementation. Significantly improved decoding accuracy and stability across fluctuating signal quality. |
The Scientist's Toolkit: Research Reagent Solutions
This table details key materials and computational tools used in the development and validation of degradation-aware neural imputation pipelines.
Table 3: Essential Materials and Tools for Neural Imputation Research
| Item / Reagent | Function / Specification | Application in the Experiment |
|---|---|---|
| Flexible Neural Probe | Polyimide or parylene-C substrate with conductive polymer (e.g., PEDOT:PSS) electrodes [9] [44]. | Chronic neural signal recording; reduces mechanical mismatch and immune response for more stable long-term signals [23]. |
| Signal Quality Metrics | Signal-to-Noise Ratio (SNR) for MUA; Coherence (Coh) for LFP. | Serves as the confidence weight in the CW-BLR model to guide the imputation of degraded data points [52]. |
| kSIR Decoder | Kernel-Sliced Inverse Regression model with Radial Basis Function (RBF) kernel. | Decodes imputed neural features (MUA, LFP power) into kinematic parameters (forelimb velocity). Optimized parameters: σ=0.9, r=0.10 [52]. |
| Maximal Information Coefficient (MIC) | A non-parametric statistical measure that detects linear and non-linear correlations between variables. | Used to identify which neural features (e.g., MUA, high-γ LFP) are most strongly correlated with movement kinematics, informing feature selection [52]. |
Managing Stimulation Artifacts and Noise in Recording During Therapeutic DBS
Foundational Concepts: Understanding the Artifact Problem
What are DBS stimulation artifacts and why are they a major challenge for research?
Deep Brain Stimulation (DBS) delivers high-frequency electrical pulses (typically >100 Hz) with amplitudes often greater than 1 Volt to targeted brain structures. [54] This signal is volume-conducted through brain tissue to the scalp, where it produces large electrical artifacts that can completely obscure the neural activity researchers aim to record. [54] The fundamental challenge is that these artifacts are often orders of magnitude larger than the neural signals of interest, such as local field potentials (LFPs), which are typically measured in microvolts. [54]
Why can't simple filtering remove DBS artifacts?
While DBS stimulation occurs at high frequencies (>100 Hz), the artifacts are not limited to these frequencies. DBS also causes significant low-frequency artifacts that overlap with biologically relevant neural signals. [54] Simple low-pass temporal filtering is therefore insufficient on its own, as it would remove these physiologically important signals along with the artifacts. [54]
How does data acquisition contribute to the problem?
The aliasing of high-frequency stimulation artifacts presents a major technical challenge. [55] [54] When the sampling rate is too low relative to the stimulation frequency, the high-frequency artifacts "fold down" into lower frequencies that overlap with the neural signals of interest. This occurs due to desynchronization between the stimulation device and the recording equipment. [54] While oversampling is a theoretically sound strategy to reduce aliasing, it is practically limited by EEG/recording system constraints—for example, a 256-electrode system may be limited to 2048 Hz sampling. [54]
Artifact Removal Methodologies & Protocols
What advanced signal processing methods effectively remove DBS artifacts?
No single approach can efficiently remove DBS artifacts; instead, researchers must combine multiple techniques. [54] The most promising methods include:
- Frequency-Domain Hampel Filtering: This method tracks outliers in the frequency domain, effectively removing artifact components while preserving neural signals. [54] It is particularly valuable for addressing low-frequency artifacts that simple filtering cannot remove.
- Dynamic Template Subtraction: This recently developed method uses stimulation-sampling synchronization to create and dynamically update a template of the artifact, which is then subtracted from the signal. [56] The template adapts to changes in stimulation artifacts over time, ensuring robust performance.
- Periodic Artifact Removal with Harmonic Regression: This algorithm models the artifact as a sum of sinusoids and jointly estimates the artifact frequency and phase shifts while fitting the artifact using harmonic regression. [55] It can handle missing data and situations where the stimulation frequency exceeds the Nyquist frequency.
Table 1: Comparison of Advanced DBS Artifact Removal Methods
| Method | Key Principle | Advantages | Limitations |
|---|---|---|---|
| Frequency-Domain Hampel Filtering [54] | Identifies and removes outliers in frequency domain | Effective for low-frequency artifacts; preserves neural signals | Requires fine-tuning to avoid over-aggressive filtering |
| Dynamic Template Subtraction [56] | Creates and updates artifact template for subtraction | Works at low sampling rates (2x stimulation frequency); adapts to changing artifacts | Requires stimulation-sampling synchronization |
| Periodic Artifact Removal with Harmonic Regression [55] | Models artifact as sinusoidal components; estimates frequency/phase | Handles missing data and aliased frequencies; suitable for closed-loop systems | Computationally intensive; requires accurate frequency estimation |
What is the experimental protocol for implementing Dynamic Template Subtraction?
The protocol based on recent research involves: [56]
- Synchronization: Establish timing synchronization between the stimulation pulses and data sampling system.
- Template Creation: Capture the artifact waveform shape by averaging multiple stimulation cycles.
- Dynamic Updating: Continuously update the artifact template to adapt to changes in the stimulation artifacts over time.
- Subtraction: Subtract the dynamic template from the recorded signal in real-time.
- Validation: Verify the method's performance by checking that relative errors in the power spectral density between recovered and reference LFPs are minimal (successful implementations show errors <1% across frequencies 1-150 Hz under various stimulation parameters). [56]
What about using bipolar stimulation to reduce artifacts?
Bipolar stimulation (using two intracranial contacts as anode and cathode) generates a shorter electrical dipole compared to monopolar stimulation (using the pulse generator as anode). [54] While some studies suggest this produces clinically insignificant artifacts, the evidence is mixed. The effectiveness depends on specific recording configurations and cannot be relied upon as a sole solution for artifact removal. [54]
Hardware & Biophysical Considerations
How does electrode design impact recording quality and artifacts?
The mechanical mismatch between implanted electrodes and brain tissue creates significant challenges. [19] [11] The brain's shear modulus (200-1500 Pa) is several orders of magnitude less than commonly used electrode materials like silicon (~50 GPa) or tungsten (~130 GPa). [19] This mismatch leads to:
- Strain concentration around electrode sites and protruded electrical traces [11]
- Chronic inflammation and neuronal death near the electrode [19]
- Increased electrode-to-neuron distance, which elevates stimulation thresholds and reduces recorded signal amplitude [19]
Table 2: Impact of Electrode-to-Neuron Distance on Recording and Stimulation
| Electrode-Neuron Distance | Impact on Stimulation Threshold | Impact on Recorded Signal Amplitude | Functional Consequence |
|---|---|---|---|
| Increased distance | Increases according to current-distance relationship: Ith = IR + k·r² [19] | Monopolar source: potential varies as 1/r; Dipolar source: varies as 1/r² [19] | Higher stimulation currents required; weaker recorded signals |
| Neuronal death near electrode | Increases threshold intensity; reduces response amplitude [19] | Rapid decrease in signal amplitude; historical rule of thumb: need <100µm for single-unit recording [19] | Device performance degradation over time |
What are the key material failure modes in chronic implants?
Finite Element Modeling (FEM) reveals that mechanical strain is focused around electrode sites and on protruded electrical traces, particularly at the borders between different materials (e.g., iridium and silicon). [11] These micro-architectural stress points become failure modes that degrade recording performance over months of implantation. [11]
Troubleshooting Guide & Research Toolkit
Frequently Asked Questions from Researchers
Q: My low-pass filtering isn't removing DBS artifacts. What am I missing? A: This is a common misunderstanding. DBS creates both high and low-frequency artifacts. While high-frequency components might be removed with low-pass filtering, the low-frequency artifacts remain and overlap with neural signals of interest. You need advanced methods like frequency-domain Hampel filtering or template subtraction that specifically target these low-frequency artifacts. [54]
Q: Can I just increase my sampling rate to solve aliasing problems? A: While theoretically sound, there are practical limits. Sampling rates are constrained by your recording system's capabilities, particularly with high channel counts. For example, with 256 electrodes, you might be limited to 2048 Hz sampling. Furthermore, aliasing can still occur due to desynchronization between stimulation and recording devices, so oversampling alone is insufficient. [54]
Q: How critical is precise electrode placement for minimizing artifacts? A: For DBS targeting the internal capsule, recent research suggests that as long as electrodes are within the target structure, precise positioning may be less critical than previously thought due to the large sphere of DBS-current distribution that influences most fibers in the area. [57] However, general recording quality is still significantly affected by the tissue response to the electrode, which is influenced by placement and surgical technique. [19]
Q: What are the prospects for real-time artifact removal in closed-loop DBS systems? A: Recent advances show significant promise. Methods like dynamic template subtraction have been successfully implemented for real-time artifact removal, enabling beta-triggered closed-loop DBS with sampling rates as low as 260 Hz (twice the stimulation frequency of 130 Hz). [56] This provides important technical support for realizing lightweight closed-loop DBS systems.
Table 3: Research Reagent Solutions for DBS Artifact Studies
| Research Tool | Function/Application | Key Features |
|---|---|---|
| DBSFILT Toolbox [54] | Open-source MATLAB toolbox for DBS artifact removal | Combines multiple filtering strategies; user-friendly interface |
| Harmonic Regression Algorithm [55] | Periodic artifact removal | Handles missing data; works with aliased frequencies; public GitHub code available |
| Dynamic Template Subtraction Method [56] | Real-time artifact removal for closed-loop DBS | Works at low sampling rates; adapts to changing artifacts |
| Finite Element Modeling (FEM) [11] | Analyzing mechanical strain in electrodes | Identifies failure modes; guides electrode design improvements |
| SAPAP3 Mutant Mouse Model [57] | Preclinical DBS research for OCD mechanisms | Exhibits compulsive-like grooming; responds to DBS and pharmacotherapy |
Workflow Diagram: DBS Artifact Removal Decision Pathway
Signaling Pathway: DBS Artifact Impact on Neural Recordings
Strategies for Model Retraining and Adaptation to Evolving Neural Signals
FAQs: Addressing Common Challenges in Chronic Neural Implant Research
FAQ 1: Why do my signal processing models degrade in performance over months of chronic recording? The primary cause is the biological response to the implant. After insertion, the brain initiates a foreign body response, leading to gliosis—the formation of a dense glial scar primarily composed of reactive astrocytes. This scar increases the distance between your recording electrodes and the target neurons, which elevates interfacial impedance and decays the signal-to-noise ratio (SNR). Furthermore, chronic inflammation can lead to neuronal death in the immediate vicinity of the probe, resulting in a permanent loss of signal from some units. This dynamic environment means that the statistical properties of the recorded neural signals (e.g., amplitude, noise floor, and available units) are non-stationary [9] [2].
FAQ 2: What hardware strategies can improve the long-term stability of the signals I receive? Hardware strategies focus on improving biocompatibility and mechanical compatibility with brain tissue:
- Material and Design: Move from rigid, inorganic materials (e.g., silicon, platinum) to soft, flexible materials (e.g., ultrasoft microwires, conductive polymers like PEDOT, graphene) that minimize mechanical mismatch. This reduces micromotion-induced damage and chronic inflammation [9] [2] [30].
- Protective Coatings: Encapsulate implantable silicon integrated circuits (ICs) with soft PDMS (polydimethylsiloxane) elastomers. This coating acts as a body-fluid barrier, protecting the chips from the corrosive in-body environment and significantly enhancing their operational longevity, as demonstrated in accelerated aging studies [58].
- Endovascular Approach: Consider minimally invasive implants, such as a stent-electrode array placed in a blood vessel near the cortex. This approach avoids direct penetration of brain tissue and has shown stable motor-related signal modulation and impedance over one year in human feasibility trials [59].
FAQ 3: What algorithmic adaptations are needed for real-time processing of high-density neural data? With high-density implants (1000+ electrodes), on-implant signal processing is essential to overcome the "recording density-transmission bandwidth" dilemma. Your strategy should focus on data reduction that preserves crucial information:
- Spike Detection and Sorting: Implement efficient, low-power algorithms for detecting neural action potentials (spikes) and classifying them by putative neuron. This drastically reduces the amount of data that needs to be transmitted [60].
- Signal Compression: Employ temporal and spatial compression techniques tailored to neural signals. The key requirement is hardware efficiency—algorithms must have low power consumption, small circuit size, and be capable of real-time operation [60].
- Neuromorphic Computing: Explore neuromorphic algorithms that run on specialized, low-power hardware. These systems use event-based, spiking neural networks that can adaptively adjust stimulation or processing patterns in real-time as brain states fluctuate, offering high efficiency for closed-loop implants [50].
FAQ 4: How can I validate that my model adaptations are effective over long timeframes? Establish a rigorous benchmarking protocol using standardized tasks performed regularly (e.g., in home-based sessions for clinical trials). Quantify key signal metrics over time, such as:
- Motor Signal Strength: The modulation in high-frequency band power (30-200 Hz) during attempted movements versus rest [59].
- Resting State Features: The stability of band power in various frequency bands during periods of no movement [59].
- Electrode Impedance: Track impedance changes as an indicator of tissue health and interface stability [59]. Consistent performance on these metrics over months or years is a strong indicator of successful model adaptation.
Troubleshooting Guides
Guide 1: Diagnosing Progressive Signal Quality Issues
| Observable Symptom | Potential Root Cause | Recommended Action |
|---|---|---|
| Gradual decrease in signal-to-noise ratio (SNR) for all units. | Gliosis (glial scar formation) increasing distance and impedance; general neuronal death [9]. | Re-calibrate detection thresholds; employ spatial filters that use signals from multiple electrodes; model the change as a slow drift parameter. |
| Sudden loss of a specific, previously stable unit. | Neuronal death; micromotion causing the electrode to shift relative to the neuron [9]. | Confirm loss across multiple data sessions. If confirmed, deactivate the unit from your decoding model and rely on ensemble-level signals. |
| Unstable unit waveforms over days/weeks. | Micromotion of the probe or slight morphological changes in recorded neurons [9]. | Use adaptive spike sorting algorithms that can track non-stationary waveform features over time. |
| Increased electrical impedance on specific channels. | Protein fouling on the electrode surface; degradation of the electrode material [58] [2]. | Check for consistent impedance across sessions. If permanently elevated, exclude the channel from analysis. |
Guide 2: Addressing Data Volume and Transmission Bottlenecks
| Symptom | Potential Root Cause | Recommended Action |
|---|---|---|
| Inability to stream all raw data from a high-channel-count implant. | Wireless transmission bandwidth and power are physically limited [60]. | Process on the implant: Shift from raw data streaming to transmitting only detected and sorted spike times (or extracted features). This can reduce data volume by orders of magnitude [60]. |
| Processing pipeline cannot keep up with real-time data rates. | Inefficient algorithms on the external receiver; lack of hardware acceleration. | Optimize and parallelize: Use efficient programming languages (e.g., C++, Rust). Offload intensive computations to a GPU. For the implant, use application-specific integrated circuits (ASICs) for signal processing [60]. |
| Power budget is exceeded during continuous operation. | High power draw from analog front-end and wireless transmitter. | Implement gated operation: Use low-power "sleep" modes and only activate full recording and processing during task-relevant periods triggered by external cues or detected neural states [50]. |
Experimental Protocols for Validating Model Adaptation
Protocol 1: Accelerated Aging Test for Implant Durability
Objective: To predict the long-term durability of a neural implant's silicon components within the body.
- Preparation: Use bare silicon integrated circuits (ICs) or those coated with a protective polymer like PDMS [58].
- Accelerated Aging Environment: Submerge the chips in a heated saline solution (e.g., hot salt water) that mimics the corrosive properties of body fluid. Apply electrical direct currents (bias) to the chips to simulate active operation [58].
- Monitoring: Periodically test the electrical performance of the chips (e.g., impedance, operational stability) over the course of the study (e.g., up to one year in an accelerated timeline) [58].
- Post-hoc Analysis: Perform material analysis to quantify degradation, such as comparing the physical state of bare-die regions versus PDMS-coated regions [58].
Protocol 2: Chronic In-Vivo Signal Stability Assessment
Objective: To quantitatively track the stability of neural signals and interface impedance over a long-term implantation.
- Implantation: Surgically implant the neural probe (e.g., stent-electrode array, Michigan probe, Neuropixels) into the target brain region [9] [59].
- Standardized Task Battery: At regular intervals (e.g., weekly), have subjects perform a standardized set of behavioral tasks, such as attempted limb movements, while neural data is recorded. Include periods of rest [59].
- Data Quantification: For each session, calculate:
- Longitudinal Analysis: Plot these quantitative metrics over time (e.g., 12 months) to assess signal stability and the performance of adaptive algorithms [59].
Research Reagent Solutions
| Item | Function in Research |
|---|---|
| PDMS (Polydimethylsiloxane) | A soft silicone elastomer used to coat and encapsulate implantable silicon chips, forming a protective barrier against body fluids to enhance long-term durability [58]. |
| PEDOT (Poly(3,4-ethylenedioxythiophene)) | A conductive polymer used as a coating for neural electrodes. It improves the electrical interface by lowering impedance and increasing charge transfer capacity, which enhances signal quality [30]. |
| Graphene & Carbon Nanotubes (CNTs) | Nanomaterials used to create flexible, conductive neural interfaces. They offer excellent electrical properties, mechanical flexibility, and biocompatibility, promoting better integration with neural tissue [30]. |
| Neuropixels Probes | High-density, CMOS-based neural probes capable of recording from over 1000 sites simultaneously. They are a key tool for large-scale neural recording studies in both research and intraoperative human settings [9]. |
| Utah & Michigan Arrays | Conventional, widely used multielectrode arrays for extracellular recording. Utah arrays are 3D silicon needle arrays, while Michigan probes are 2D electrode arrays on a silicon shank [9]. |
| Stentrode | An endovascular stent-electrode array deployed in a blood vessel. It provides a minimally invasive method for recording motor cortex signals without direct brain penetration [59]. |
Signaling Pathways and Workflows
Signal Adaptation Workflow
Key Failure Modes of Neural Implants
Power and Data Transmission Challenges in Chronic, Fully Implanted Systems
For researchers developing chronic neural implants, maintaining stable power and high-fidelity data transmission over extended periods is a paramount challenge. Fully implanted systems face a hostile biological environment that can lead to signal degradation, increased impedance, and eventual device failure. This technical support guide addresses the most common issues encountered in experimental settings, providing targeted troubleshooting and methodologies to mitigate these risks, thereby enhancing the longevity and reliability of your neural interface research.
Frequently Asked Questions (FAQs)
Q1: What are the primary wireless power transfer methods for chronic neural implants, and how do I choose between them?
The three main wireless power mechanisms are Electromagnetic, Acoustic, and Optical, each with distinct advantages and limitations [61].
- Electromagnetic (e.g., Inductive/RF Coupling): A well-established method used in commercial systems. It is suitable for a wide range of power budgets. However, efficiency drops significantly with distance and can be susceptible to electromagnetic interference (EMI). For instance, the Stentrode implant uses near-field RF with an efficiency of approximately 2% at a 30 mm depth [61].
- Acoustic (Ultrasonic): Offers better power transmission efficiency through tissue and enables multi-node interrogation. It is less affected by EMI, making it a robust choice for dense implant environments. Technologies like the Sectored-Multi Ring Ultrasonic Transducer (S-MRUT) are advancing this field [61].
- Optical (e.g., NIR Light): An emerging method that uses light (e.g., red/infrared lasers) for power and data. It provides high efficiency and avoids EMI. A prime example is the MOTE (microscale optoelectronic tetherless electrode) implant, which is powered by lasers that harmlessly penetrate tissue and uses infrared pulses for data transmission [62].
Selection Guide: Choose Electromagnetic for proven reliability and shorter distances, Acoustic for higher efficiency at greater depths or for powering multiple implants, and Optical for applications requiring minimal EMI and the smallest possible form factor [61] [62].
Q2: Our team is observing a gradual decline in neural signal quality over weeks. What are the likely causes?
Progressive signal degradation is often attributable to the foreign body response (FBR). This biological process leads to:
- Biofouling: Protein adsorption and immune cell (e.g., glial) encapsulation on the electrode surface, which increases impedance and electrically isolates the implant [44].
- Inflammation and Oxidative Stress: Chronic inflammation can create a chemically hostile microenvironment, leading to the corrosion of electrode materials and further performance loss [61] [44].
- Mechanical Mismatch: Rigid implants can cause chronic micromotion disturbances within soft neural tissue, perpetuating the inflammatory response and disrupting stable electrical contact [61] [5].
Q3: How can we design experiments to improve the chronic stability of our implants?
Mitigating signal degradation requires a multi-pronged approach focused on bio-integration:
- Material Selection: Transition from rigid to flexible, compliant substrates like polyimide, parylene-C, or silk fibroin. These materials reduce mechanical mismatch and micromotion [44] [5].
- Advanced Electrode Coatings: Use conductive polymers such as PEDOT:PSS or Polypyrrole (PPy). These coatings offer high charge injection capacity and lower impedance, improving signal-to-noise ratio (SNR) and stability [44].
- Active Anti-fouling Strategies: Investigate drug-eluting coatings or surface modifications that release anti-inflammatory agents to suppress the local immune response [44].
- System Miniaturization: Ultra-small implants, like the 300-micron MOTE, significantly minimize physical disruption to brain tissue, thereby reducing the immune response and enabling chronic recording [62].
Troubleshooting Guides
Rapid Power Drainage in Implanted Systems
| Symptom | Possible Cause | Diagnostic Experiment | Solution |
|---|---|---|---|
| Reduced operational time per charge. | Inefficient power transfer due to misalignment or tissue changes. | Measure power transfer efficiency (PTE) in a saline bath or tissue phantom versus in vivo. | Optimize the alignment of external and internal coils/transducers. Consider closed-loop alignment control. |
| Battery depletes faster than projected. | Higher-than-expected energy consumption by implant electronics. | Characterize power consumption of each sub-circuit (e.g., amplification, processing, transmission) in a benchtop setup. | Implement advanced power gating, use low-power modes during idle periods, and select application-specific integrated circuits (ASICs) for critical functions. |
| Device fails to hold a charge. | Battery degradation or failure of energy storage unit (e.g., supercapacitor). | Perform electrochemical impedance spectroscopy (EIS) on the explanted energy storage unit. | For long-term implants, consider battery-less designs that harvest energy wirelessly. Ensure energy storage components are rated for a sufficient number of charge cycles [61]. |
Chronic Degradation of Data Fidelity
| Symptom | Possible Cause | Diagnostic Experiment | Solution |
|---|---|---|---|
| Gradual increase in signal noise. | Rising electrode impedance due to biofouling or material degradation. | Perform regular electrochemical impedance spectroscopy (EIS) measurements in vivo or post-explanation. | Utilize low-impedance conductive polymer coatings (PEDOT:PSS). Implement flexible substrates to reduce chronic micromotion [44] [5]. |
| Intermittent data dropouts or artifacts. | Failure of hermetic packaging, leading to fluid ingress and circuit failure. | Monitor device functionality in an accelerated aging environment (e.g., elevated temperature and humidity). | Employ robust, long-term encapsulation materials like parylene-C, which has a history of FDA approval and low water permeability [44]. |
| Decreased signal amplitude over time. | Growth of an insulating glial scar tissue layer around the electrode. | Histological analysis of tissue post-explanation to measure glial fibrillary acidic protein (GFAP) marking glial cells. | Minimize implant footprint. Explore bioactive coatings that modulate the immune response to promote better integration [44]. |
Experimental Protocols for Mitigating Signal Degradation
Protocol: In Vivo Electrochemical Impedance Spectroscopy (EIS) for Tracking Electrode Health
Purpose: To non-destructively monitor the stability of the electrode-tissue interface and detect early signs of biofouling or failure in chronic experiments [44].
Materials:
- Potentiostat/Galvanostat with EIS capability.
- Chronically implanted neural electrode array.
- Reference electrode (e.g., Ag/AgCl).
- Data acquisition system.
Methodology:
- Baseline Measurement: Perform EIS on all electrode channels immediately post-implantation in a sterile surgical setting. Measure impedance across a frequency spectrum (e.g., 1 Hz to 100 kHz).
- Chronic Monitoring Schedule: Conduct follow-up EIS measurements at regular intervals (e.g., weekly) for the duration of the experiment.
- Data Analysis:
- Plot impedance magnitude and phase versus frequency for each time point.
- A significant and consistent increase in impedance at 1 kHz is a strong indicator of protein adsorption or glial cell encapsulation.
- Compare the phase angle to identify changes in the capacitive or resistive properties of the interface.
Interpretation: A gradual, monotonic rise in low-frequency impedance suggests stable biofouling. A sudden, large change may indicate electrode delamination or failure.
Protocol: Benchmarking Wireless Power Transfer Efficiency (PTE)
Purpose: To quantitatively evaluate and compare the performance of different wireless powering systems in a biologically relevant environment [61].
Materials:
- External power transmitter (coil, ultrasonic transducer, or laser).
- Implantable receiver unit.
- Simulated biological tissue (e.g., saline phantom, ex vivo tissue) or animal model.
- Network/Impedance Analyzer or precision power meters.
Methodology:
- Benchtop Calibration: Measure the input power to the transmitter and the output power from the receiver in air at a fixed distance to establish a baseline PTE.
- In Phantom/In Vivo Testing: Place the implant at the desired depth within the tissue phantom or animal. Measure the input and output power again.
- Calculation: Calculate PTE as (Output Power / Input Power) * 100%.
- Spatial Mapping: Vary the alignment (lateral/angular) and depth of the implant to create an efficiency map for your system.
Interpretation: This data is critical for determining the practical operating range and alignment tolerances of your power system. It allows for direct comparison with literature values, such as >200-fold amplification for cIGTs or 2% efficiency for a specific RF system [61] [44].
Essential Visualizations
Wireless Power Transfer Pathways
Chronic Signal Degradation Mechanism
Experiment Workflow for Stability Assessment
The Scientist's Toolkit: Research Reagent Solutions
| Item | Function | Example/Specification |
|---|---|---|
| Conductive Polymer Coating (PEDOT:PSS) | Reduces electrode impedance, improves charge injection capacity for stimulation, and enhances signal-to-noise ratio for recording [44]. | Available as aqueous dispersions from companies like Heraeus. Can be electrodeposited onto metal electrodes. |
| Flexible Substrate (Polyimide) | Serves as the mechanical backbone for flexible implants, providing compliance to match neural tissue and reduce micromotion-induced inflammation [44] [5]. | Available as thin films (e.g., <10 µm) for microfabrication of microelectrode arrays. |
| Encapsulation Material (Parylene-C) | Provides a conformal, biocompatible, and moisture-resistant barrier to protect implant electronics from the corrosive physiological environment [44]. | Applied via chemical vapor deposition (CVD) to ensure a uniform, pinhole-free coating. |
| Organic Electrochemical Transistors (OECTs) | Used as front-end amplifiers for neural signals. They offer high intrinsic amplification through ion-electron coupling and excellent mechanical compliance [44]. | Can be fabricated from polymer semiconductors like PEDOT:PSS. |
| Aluminum Gallium Arsenide (AlGaAs) Diode | Core component in optoelectronic implants like the MOTE. Serves a dual role as a photovoltaic power harvester and a light-emitting data transmitter [62]. | Requires specialized semiconductor fabrication facilities. |
| Saline Phantoms | Simulate the electrical and acoustic properties of biological tissue for benchtop testing of power transfer efficiency and system functionality before in vivo studies. | 0.9% NaCl solution is a standard; more complex recipes can match specific tissue properties. |
Benchmarking Progress: Preclinical and Clinical Validation of Chronic Implant Technologies
Comparative Analysis of Signal Decomposition and Denoising Techniques (e.g., VMD, MODWT)
This technical support center provides troubleshooting guidance for researchers working on mitigating signal degradation in chronic neural implants. The analysis and processing of neural signals are paramount for the long-term functionality and reliability of these implants. This resource focuses on two powerful signal processing techniques, Variational Mode Decomposition (VMD) and the Maximal Overlap Discrete Wavelet Transform (MODWT), offering a comparative analysis, detailed experimental protocols, and solutions to common challenges encountered during experimentation. The guidance is structured to assist scientists, engineers, and drug development professionals in selecting and implementing the optimal denoising strategy for their specific research context.
Frequently Asked Questions (FAQs)
1. My neural signal decomposition results in too many noisy, meaningless components with VMD. How can I improve this?
This is typically caused by incorrect selection of the VMD's key parameters: the number of decomposition modes (K) and the penalty factor (α).
- Solution: Use an optimization algorithm to automatically find the optimal [K, α] pair instead of relying on manual selection.
- Recommended Protocol: Employ the Grey Wolf Optimization (GWO) algorithm. Use envelope entropy as the fitness function to evaluate wolf individual fitness. A lower envelope entropy indicates a more ordered and informative intrinsic mode function (IMF). The GWO will iteratively find the [K, α] combination that minimizes the entropy of the resulting modes, ensuring they capture genuine signal components rather than noise [63].
- Alternative Approach: A fusion algorithm combining the Whale Optimization Algorithm (WOA) and Tabu Search (TS) can also be used. In this case, the minimum permutation entropy of the IMFs serves as an effective fitness function [64].
2. The decomposed modes from my VMD analysis appear mixed, meaning a single mode contains multiple frequency components or vice versa. What is the issue?
Mode mixing often occurs when the number of modes, K, is set inappropriately.
- Root Cause: An excessively large
Kvalue will cause a single frequency component to be segmented into multiple modes, while a too-smallKwill lead to different frequencies being mixed into a single mode [63]. - Solution: Carefully determine the optimal
Kvalue using the optimization strategies outlined in FAQ #1. The GWO-VMD method has proven effective in separating and suppressing random noises while preserving valid signal components in applications like seismic processing, which shares similarities with neural signal characteristics [63].
3. Which denoising technique is more robust for handling the high-intensity, non-stationary noise typical in chronic neural recordings?
A comparative study on bridge structural health monitoring, which also deals with non-stationary signals in noisy environments, provides key insights.
- Finding: MODWT demonstrates a distinct advantage in high-intensity white noise environments, a common scenario in real-world monitoring [65].
- Reason: MODWT is not sensitive to the initial offset of the signal and can be computed for series of any length, unlike the standard Discrete Wavelet Transform (DWT), which is restricted to signals of length 2^J [66]. This makes it particularly suitable for long, continuous neural recordings.
- Recommendation: For environments with heavy white noise, MODWT is a robust choice. Its performance can be further evaluated against optimized VMD for your specific neural data set.
4. How do I choose between discarding or keeping an Intrinsic Mode Function (IMF) after VMD decomposition?
A correlation analysis-based method provides a clear, quantitative criterion for this decision.
- Protocol:
- Compute the correlation coefficient (R) between each IMF and the original noisy signal [64].
- Categorize the IMFs:
- Pure Components: IMFs with a correlation coefficient very close to 1. Retain these.
- Complete Noise Components: IMFs with a correlation coefficient close to 0. Discard these.
- Signals Containing Noise: IMFs with intermediate correlation values. These should be further processed using a technique like Wavelet Threshold (WT) denoising before being included in the final reconstructed signal [64].
Quantitative Data Comparison
Table 1: Performance Comparison of Denoising Techniques in Different Applications
| Technique | Application Domain | Key Performance Metrics | Reported Advantages |
|---|---|---|---|
| MODWT [65] | Bridge Strain Signal Denoising | Outperformed time-domain, frequency-domain, and other wavelet filters under heavy white noise. | Superior in high-intensity white noise; handles non-stationary signals; works for any signal length. |
| TS-WOA-VMD-CA-WT [64] | Machine Tool Vibration Denoising | A hybrid method using optimized VMD, correlation analysis, and wavelet thresholding. | Superior generality and performance compared to other existing denoising techniques. |
| GWO-VMD [63] | Seismic Random Noise Suppression | Obtained ~27.78% higher SNR and ~78.82% lower RMSE compared to other methods. | Effectively separates random noise and preserves valid signal components. |
| IVMD (Improved VMD) [67] | ECG Signal Denoising | Achieved SNR of 83 dB, significantly higher than traditional VMD (42 dB). | Uses a dynamic window of variable size, reducing processing time and improving performance. |
Table 2: Optimization Algorithms for VMD Parameter Tuning
| Optimization Algorithm | Fitness Function Used | Key Advantage | Application Context |
|---|---|---|---|
| Grey Wolf Optimization (GWO) [63] | Envelope Entropy | Simple configuration, rapid convergence, powerful competitiveness. | Seismic random noise suppression. |
| Whale Optimization Algorithm (WOA) + Tabu Search (TS) [64] | Permutation Entropy | Fusion algorithm avoids premature convergence and improves search efficiency. | Machine tool vibration signal denoising. |
Detailed Experimental Protocols
Protocol 1: Signal Denoising Using Optimized VMD
This protocol outlines the methodology for denoising signals using VMD with parameters optimized via the GWO algorithm [63].
- Signal Acquisition: Collect the noisy neural signal, ensuring proper preprocessing (e.g., basic filtering, artifact removal).
- Parameter Optimization:
a. Initialize the Grey Wolf Optimization algorithm.
b. Define the search boundaries for the VMD parameters
[K, α]. c. For each candidate[K, α]pair, perform VMD on the signal. d. Calculate the envelope entropy of the resulting IMFs as the fitness value for the GWO. e. Allow the GWO to iterate until it finds the[K, α]pair that minimizes the envelope entropy. - Signal Decomposition: Decompose the original signal using VMD with the optimized parameters obtained in step 2.
- IMF Selection: a. Calculate the correlation coefficient between each IMF and the original signal [64]. b. Classify IMFs as pure signal, noisy signal, or pure noise. c. Discard pure noise IMFs.
- Reconstruction: Reconstruct the denoised signal by summing the pure signal IMFs and the denoised versions of the noisy-signal IMFs (e.g., after wavelet thresholding).
Protocol 2: Signal Denoising Using MODWT
This protocol describes the steps for denoising non-stationary signals using the MODWT technique [65] [66].
- Signal Preparation: Input the noisy neural signal. Note that MODWT does not require the signal length to be a power of two.
- Decomposition: Apply the MODWT to the signal to obtain the wavelet and scaling coefficients across multiple decomposition levels.
- Thresholding: Apply a thresholding rule (e.g., soft thresholding) to the wavelet coefficients at each level. This step suppresses noise, which typically resides in the finer detail coefficients.
- Reconstruction: Perform the inverse MODWT using the thresholded wavelet coefficients and the original scaling coefficients to reconstruct the denoised signal in the time domain.
The Scientist's Toolkit: Research Reagent Solutions
Table 3: Essential Materials and Tools for Signal Denoising Experiments
| Item / Technique | Function / Description | Relevance to Neural Implant Research |
|---|---|---|
| Variational Mode Decomposition (VMD) | Adaptive signal decomposition method that separates a signal into intrinsic mode functions (IMFs) with specific sparsity properties in the frequency domain [64] [67]. | Isolates distinct oscillatory components (e.g., beta, gamma waves) from noisy neural recordings. |
| Maximal Overlap Discrete Wavelet Transform (MODWT) | A redundant wavelet transform that is translation-invariant and can be computed for series of any length, making it less sensitive to signal alignment than DWT [65] [66]. | Robustly analyzes continuous, long-duration neural signals without constraints on data length. |
| Grey Wolf Optimization (GWO) | A meta-heuristic optimization algorithm used to automatically find the optimal parameters for VMD (K and α) [63]. | Eliminates guesswork in parameter tuning, crucial for reproducible and effective denoising of complex neural data. |
| Correlation Analysis | A statistical method used to measure the independence and correlation between the decomposed IMFs and the original signal [64]. | Provides an objective criterion for deciding whether to keep or discard a signal component post-decomposition. |
| Permutation / Envelope Entropy | Fitness functions used in optimization algorithms to quantify the randomness or disorder within a signal component [64] [63]. | Guides the optimization algorithm toward parameter sets that yield more structured and informative IMFs. |
| Wavelet Thresholding | A denoising technique applied to wavelet coefficients (from MODWT) or noisy IMFs (from VMD) to suppress noise [64]. | Fine-tunes the denoising process by removing residual noise from signal components. |
Workflow and Signaling Pathway Visualizations
GWO-VMD Optimization and Denoising Workflow
MODWT Denoising Process
Denoising Technique Selection Guide
Chronic neural implants are powerful tools for recording brain activity over extended periods, enabling research into learning, memory, and neurological disorders. The electrode-to-neuron distance is a critical factor determining recording quality, with signals decaying rapidly as this distance increases. The historical rule of thumb states that electrodes must be within 100 μm of active neurons to record isolated signals effectively [19]. However, all chronically implanted devices face challenges from the biological foreign body response and material failure mechanisms that progressively degrade signal quality over time [9] [68]. This technical resource center provides performance benchmarks, troubleshooting guidance, and experimental protocols for maximizing the longevity and reliability of neural interfaces.
Technology Performance Benchmarks & Failure Modes
Quantitative Performance Comparison
Table 1: Longitudinal Performance Characteristics of Neural Recording Technologies
| Technology | Typical Lifespan | Stable Recording Period | Key Advantages | Primary Failure Modes |
|---|---|---|---|---|
| Utah Array | Average: 622 days; Maximum: 9 years [69] | >40% electrode yield at 1 year (SNR>1.5) [69] | FDA-cleared for human studies; Proven long-term reliability [69] | Iridium oxide outperforms platinum metallization; Connector issues; Insulation failure [69] [15] |
| Neuropixels | Months (reusable across implants) [70] | 100+ units trackable over months; Anterior/ventral regions most stable [70] | High channel count (1000 sites); Reusable design; CMOS integration [70] | Modest noise increase after explantation; Region-dependent stability [70] |
| Emerging CMOS | 6+ months in mice [71] | Multiple single units trackable over months [71] | Minimal tissue damage (26×26 μm shank); Compact design; Scalable [71] | Limited long-term human data; Manufacturing complexity [71] |
Troubleshooting Common Performance Issues
Issue: Progressive decline in signal-to-noise ratio (SNR) over time
- Primary Cause: Gliosis and neuronal death due to chronic foreign body reaction [9]
- Diagnostic Steps:
- Monitor impedance spectroscopy weekly
- Track single-unit yield per electrode
- Compare SNR metrics across sessions
- Mitigation Strategies:
Issue: Sudden loss of signal across multiple channels
- Primary Cause: Mechanical failure of internal components or connector issues [15]
- Diagnostic Steps:
- Verify external connections and cabling
- Check for visible damage under microscopy
- Test impedance across all channels
- Mitigation Strategies:
- Implement strain relief for external connectors
- Regular visual inspection of implant integrity
- Use finite element modeling during design to identify strain concentration points [10]
Issue: Inconsistent recording quality across brain regions
- Primary Cause: Regional differences in brain mechanical properties and movement [70]
- Diagnostic Steps:
- Map signal stability against anatomical locations
- Compare recording quality in cortical vs. subcortical regions
- Analyze tissue response histology post-explant
- Mitigation Strategies:
Experimental Protocols for Chronic Recordings
Surgical Implantation Best Practices
Pre-operative Planning:
- Select appropriate metallization: Iridium oxide demonstrates superior chronic yield compared to platinum [69]
- Plan coordinates to avoid major vasculature, as vessel proximity increases astroglial activity [10]
- For multi-shank arrays, consider dorsoventral and anteroposterior positioning as stability varies systematically by region [70]
Intra-operative Techniques:
- Control insertion speed to minimize acute tissue damage and bleeding [68]
- Utilize stereotactic microdrives with minimal lateral vibration during insertion [72]
- Implement pneumatic insertion systems for consistent penetration velocity [68]
Post-operative Care:
- Allow adequate stabilization period (1-2 weeks) before beginning recordings
- Monitor vital signs and behavior for signs of discomfort or neurological deficit
- Administer prescribed analgesics and anti-inflammatories according to institutional protocols
Chronic Recording Session Protocol
Daily Setup:
- Verify headstage connection integrity and impedance values
- Perform automated signal quality assessment across all channels
- Document environmental factors that may affect recordings (animal behavior, time of day, experimental conditions)
Data Quality Validation:
- Calculate SNR metrics for each channel using standardized processing pipelines
- Track single-unit yield across sessions to identify degradation trends
- Implement automated detection of failing channels for exclusion from analysis
Long-term Maintenance:
- Schedule regular impedance checks to identify failing electrodes
- Maintain detailed logs of signal quality metrics for longitudinal analysis
- For adjustable systems, implement micron-precision vertical adjustment to compensate for tissue changes [72]
Signaling Pathways in Foreign Body Response
Diagram 1: Neural Tissue Response to Implanted Probes
Material Failure Mechanisms & Solutions
Diagram 2: Mechanical Failure Pathways in Chronic Implants
Research Reagent Solutions for Chronic Recordings
Table 2: Essential Materials for Chronic Neural Interface Research
| Material/Reagent | Function | Application Notes |
|---|---|---|
| Iridium Oxide | Electrode tip metallization | Superior chronic yield vs. platinum; optimized for stimulation [69] |
| Polyimide | Flexible substrate insulation | Reduces mechanical mismatch; Young's modulus ~1 GPa [68] |
| Parylene-C | Conformal insulation coating | Protects against moisture and ions; maintains flexibility [68] |
| Silicon Probes | Rigid substrate material | High fracture strength (1800 MPa); enables precise lithography [10] |
| 3D Printed Holders | Probe stabilization & positioning | Customizable designs; enables vertical adjustment with micron precision [72] |
| Anti-inflammatory Coatings | Biocompatibility enhancement | Reduces glial activation; improves chronic integration [68] |
Frequently Asked Questions
Q: What is the realistic lifespan I can expect from Utah arrays in non-human primates? A: Based on analysis of over 6,000 recording datasets, the average lifespan of Utah arrays is 622 days, with approximately 50% of implants maintaining >40% electrode yield at one year. Exceptional cases can last over 1,000 days, with one reported instance of 9 years of recording capability [69].
Q: Are Neuropixels probes reusable, and how does explantation affect performance? A: Yes, Neuropixels probes can be successfully reused across multiple implantation cycles. Testing of explanted probes shows only a modest increase in input-referred noise, which does not significantly impair future single-unit recording quality [70].
Q: How does electrode length affect recording longevity and quality? A: Surprisingly, research findings indicate that electrode length (1.0 mm vs. 1.5 mm) does not significantly impact longevity or recording quality. The electrode tip metallization has a much greater effect on performance [69].
Q: What are the primary biological mechanisms driving signal degradation over time? A: The two main biological mechanisms are: (1) Gliosis - formation of a dense glial scar (composed primarily of reactive astrocytes) that increases electrode-to-neuron distance, and (2) Neuronal death in the immediate vicinity of the probe, eliminating signal sources [9].
Q: How can I maximize the stability of chronic recordings in freely moving animals? A: Implement compact, lightweight implant assemblies that minimize mechanical forces on the probe. For rats, assemblies under 3g with dimensions approximately 43mm height × 25mm width × 10.5mm depth have proven effective. Additionally, target anterior and ventral brain regions which demonstrate greater recording stability [70].
Q: What surgical approaches can reduce initial tissue damage during implantation? A: Master precise craniotomy techniques to avoid damaging the outermost brain layer. Control insertion speed and minimize lateral movements during probe descent. Utilize insertion guides or temporary stiffeners for flexible probes to achieve clean penetration with reduced tissue dimpling [68].
Clinical Validation of Movement and Emotion Decoding in Parkinson's and Depression
Troubleshooting Guides
Guide 1: Addressing Poor Movement Decoding Performance in Parkinson's Disease
Problem: Low balanced accuracy in classifying rest versus movement states from ECoG signals in patients with Parkinson's disease.
Explanation: Suboptimal movement decoding can stem from disease severity, therapeutic deep brain stimulation (DBS) artifacts, or suboptimal feature selection. Parkinson's degeneration directly impacts neural encoding of movement, while DBS therapy can introduce high-frequency artifacts that obscure relevant neural signals if not properly handled [46].
Solution:
- Action 1: Verify and Account for Disease Severity.
- Check the patient's Unified Parkinson's Disease Rating Scale Part III (UPDRS-III) score. A negative correlation exists between UPDRS-III scores and decoding performance (Spearman’s rho = -0.36). For patients with higher severity (UPDRS-III > 50), expect lower baseline decoding accuracy and consider patient-specific model training [46].
- Procedure: Document UPDRS-III score during decoding tasks. Use this clinical metric to set performance expectations and determine if a generalized or patient-specific model is more appropriate.
Action 2: Mitigate DBS Artifact Interference.
- If the patient is undergoing STN-DBS, standard bandpass filtering and period-based artifact removal may not be sufficient and can even degrade performance [46].
- Procedure: Train separate machine learning models for DBS ON and DBS OFF conditions. For real-time decoding during stimulation, use the model trained on data from the corresponding DBS state. Explore advanced artifact suppression techniques beyond basic filtering.
Action 3: Optimize Feature Selection and Channel Localization.
- Ensure the analysis pipeline prioritizes features from the theta (4-8 Hz), high beta (20-30 Hz), and high gamma (>60 Hz) frequency bands, which show the highest importance for movement decoding. Also, ensure recording channels are correctly localized to the sensorimotor cortex [46].
- Procedure: Implement a feature importance analysis (e.g., using permutation importance) to confirm the relevant frequency bands are driving the decoder. Use the
py_neuromodulationplatform for standardized feature extraction. For channel selection, employ a connectomic approach to identify the channel with the highest network overlap with an optimal movement-decoding template [46].
Guide 2: Resolving Inconsistent Emotion Authenticity Recognition in Parkinson's Patients
Problem: Patients with Parkinson's disease can identify basic emotions but perform worse than healthy controls at recognizing whether an emotional expression is authentic or simulated [73].
Explanation: This specific deficit is attributable to the disruption of the extrapiramidal limbic circuit between the ventral striatum and orbitomesial prefrontal cortex. It primarily impacts the embodied simulation mechanism, which is crucial for judging subtle cues of authenticity, rather than the semantic strategy used for labeling prototypical emotions [73].
Solution:
- Action 1: Use Dynamic Stimuli for Assessment.
- Standard static images of posed emotions are insufficient for assessing authenticity recognition. Authentic emotions often involve rapid, subtle micro-expressions [73].
- Procedure: Utilize tests designed for this purpose, such as the Emotional Authenticity Recognition (EAR) test, which uses dynamic stimuli from datasets like the Padova Emotional Dataset of Facial Expressions (PEDFE) [73].
- Action 2: Differentiate Between Emotion and Authenticity Tasks.
- Confirm that the impairment is specific to authenticity. Patients should be able to identify the type of emotion (e.g., happy, sad) but struggle to judge if it is genuine [73].
- Procedure: Administer separate tests for basic emotion recognition and authenticity recognition. A dissociation in performance (preserved emotion identification with impaired authenticity judgment) confirms the expected deficit pattern related to embodied simulation circuits [73].
Guide 3: Managing Signal Degradation in Chronic Neural Implants
Problem: Gradual decline in signal-to-noise ratio (SNR) and increased electrode impedance over the chronic implantation period [24] [2].
Explanation: Signal degradation is primarily caused by the foreign body response, which includes gliosis (formation of a glial scar by reactive astrocytes) and neuronal death around the implant. A mechanical mismatch between the probe and soft brain tissue, along with micromotion, exacerbates chronic inflammation and scar tissue formation, which acts as an insulating layer [9] [2].
Solution:
- Action 1: Monitor Electrode Impedance and Physical Degradation.
- A steady rise in impedance at 1 kHz is a reliable indicator of ongoing physical degradation of the electrode and glial scar formation. Studies of explanted arrays show that Sputtered Iridium Oxide Film (SIROF) electrodes, despite showing more physical damage, are twice as likely to record neural activity than Platinum (Pt) electrodes [24].
- Procedure: Track impedance trends over time. Consider the electrode material when interpreting performance data, as SIROF may offer better chronic performance despite visible wear. Post-explant, Scanning Electron Microscopy (SEM) can quantify physical damage like cracks and pockmarks [24].
- Action 2: Consider Electrode Material and Mechanical Properties.
- The significant stiffness mismatch between rigid silicon-based probes (~102 GPa) and soft brain tissue (~1-10 kPa) is a key driver of the foreign body response [2].
- Procedure: For long-term implants, prioritize flexible electrodes with a lower Young's modulus. These reduce mechanical mismatch and micromotion-induced damage, thereby mitigating chronic inflammation and supporting more stable long-term recordings [23].
Experimental Protocols
Protocol 1: Generalizable Movement Decoding Across Patient Cohorts
Objective: To train and validate a movement decoder that generalizes across different patient cohorts without requiring individual training for each new subject [46].
Methodology:
- Data Acquisition: Record ECoG signals from patients (e.g., with Parkinson's disease or epilepsy) performing upper limb movements. Use ECoG strips placed on the cortical surface.
- Signal Processing: Use the
py_neuromodulationplatform to extract features.- Stream raw data in batches.
- Compute Fast Fourier Transform (FFT) features across eight frequency bands (4-400 Hz) in 1-second segments, updated at 10 Hz with 90% overlap.
- Z-score normalize features using a 30-second rolling window and clip values at ±3 to mitigate artifacts.
- Model Training (Within-Subject Baseline): Train a ridge-regularized logistic regression classifier to distinguish between "rest" and "movement" states. Use 3-fold cross-validation on consecutive data segments. Evaluate using balanced accuracy.
- Across-Subject Generalization: Implement a connectomic decoding approach to eliminate patient-specific training.
- Step 1: Co-register all electrode locations to a standard space (e.g., Montreal Neurological Institute - MNI space).
- Step 2: Generate a "connectomic decoding network map" by calculating voxel-wise correlations between decoding performance and whole-brain connectivity maps from each channel.
- Step 3: For a new patient, select the recording channel that has the highest network overlap with this pre-defined optimal template.
- Step 4: Use a pre-trained model on the selected channel's features for movement classification.
Expected Outcomes: The connectomic approach should achieve significant above-chance balanced accuracy and movement detection rates across cohorts, even when entire cohorts are left out of the training data [46].
Protocol 2: Differentiating Emotion Recognition from Authenticity Judgment
Objective: To assess specific deficits in the recognition of emotion authenticity in Parkinson's disease patients using dynamic stimuli [73].
Methodology:
- Participant Groups: Recruit Parkinson's disease patients and matched healthy control subjects.
- Stimuli: Use the Emotional Authenticity Recognition (EAR) test, which presents dynamic facial expressions from validated datasets like PEDFE. These stimuli include both authentic and simulated (posed) emotions.
- Task: Administer two sequential tasks:
- Emotion Identification Task: Participants identify the basic emotion displayed (e.g., happiness, anger, sadness).
- Authenticity Judgment Task: Participants judge whether the emotional expression is "authentic" or "simulated."
- Analysis: Perform an Analysis of Variance (ANOVA) on the test scores to compare performance between groups and across tasks.
Expected Outcomes: Parkinsonian patients will perform similarly to controls in identifying basic emotions but significantly worse in recognizing the authenticity of those emotions. This confirms the dissociation between semantic and embodied simulation processes [73].
Frequently Asked Questions (FAQs)
Q1: What is the most reliable quantitative metric for predicting movement decoding performance in a new Parkinson's disease patient? The Unified Parkinson's Disease Rating Scale Part III (UPDRS-III) score is a key clinical predictor. Studies show a significant negative correlation (Spearman’s rho = -0.36) where higher disease severity is associated with lower decoding performance [46].
Q2: Why does therapeutic DBS sometimes interfere with movement decoding, and how can this be managed? High-frequency (130 Hz) STN-DBS creates electrical artifacts that can obscure the underlying neural signals used for decoding. Standard artifact removal techniques can be ineffective. The recommended solution is to train separate decoding models for the DBS ON and DBS OFF states and use the appropriate model based on the patient's current therapeutic state [46].
Q3: We observe a rise in electrode impedance over time. Does this always mean the electrode is failing? Not necessarily. A gradual increase in impedance at 1 kHz is correlated with the foreign body response and physical degradation of the electrode. However, the relationship between physical damage and function is complex. Sputtered Iridium Oxide Film (SIROF) electrodes can maintain twice the likelihood of recording neural signals compared to Platinum (Pt) electrodes, even with greater physical degradation. Therefore, functional metrics like Signal-to-Noise Ratio (SNR) should be the primary indicator of performance [24].
Q4: What is the core neurological reason for the specific deficit in emotion authenticity recognition in Parkinson's patients? The impairment is attributed to the dysfunction of the extrapiramidal limbic circuit, specifically the connection between the ventral striatum and the orbitomesial prefrontal cortex. This circuit is critical for embodied simulation—the process of internally re-experiencing an emotion to judge its authenticity—which is disrupted in Parkinson's disease, while circuits supporting semantic labeling of emotions remain relatively intact [73].
Table 1: Movement Decoding Performance Metrics from ECoG Signals [46]
| Metric | Description | Average Performance (Best Channel) | Key Influencing Factor |
|---|---|---|---|
| Balanced Accuracy | Sample-wise classification (rest vs. movement) at 100 ms resolution. | 0.80 ± 0.07 | Negatively correlated with UPDRS-III score (rho = -0.36). |
| Movement Detection Rate | Detection of individual movement entities (≥300 ms consecutive classification). | 0.98 ± 0.04 | Deteriorates under therapeutic DBS in some patients. |
| Across-Patient Decoding | Performance using connectomic template without patient-specific training. | Significant above chance (p < 0.05) | Depends on network overlap with optimal template. |
Table 2: Electrode Degradation and Chronic Recording Performance [24]
| Parameter | Observation | Correlation with Function |
|---|---|---|
| Impedance at 1 kHz | Increases over time post-implantation. | Significantly correlates with all physical damage metrics and recording performance. |
| Electrode Material (SIROF vs. Pt) | SIROF electrodes showed greater physical degradation. | SIROF electrodes were twice as likely to record neural activity than Pt. |
| Stimulation Effect | A new "pockmarked" degradation type observed on stimulated electrodes. | No significant link found between degradation level and amount of charge delivered. |
The Scientist's Toolkit: Research Reagent Solutions
Table 3: Essential Materials for Neural Decoding and Interface Research
| Item | Function in Research |
|---|---|
| Neuropixels Probe | High-density silicon-based neural probe for large-scale, single-neuron resolution recording from deep brain structures [9]. |
| py_neuromodulation Platform | An open-source, modular software platform for standardized feature extraction and machine-learning-based brain signal decoding [46]. |
| Emotional Authenticity Recognition (EAR) Test | A behavioral test using dynamic facial stimuli to assess the ability to recognize both emotions and their authenticity, crucial for studying social cognition [73]. |
| Sputtered Iridium Oxide Film (SIROF) | An electrode coating material that offers superior charge injection capacity and functional longevity for chronic neural recordings, despite showing physical wear [24]. |
| Flexible Neural Electrodes | Probes made of soft, compliant materials to reduce mechanical mismatch with brain tissue, thereby mitigating chronic immune response and improving long-term signal stability [23]. |
Evaluating Decoder Generalization Across Cohorts and Recording Conditions
Troubleshooting Guides
FAQ: Decoder Performance and Generalization
1. Why does my decoder perform well in one patient cohort but fail in another?
This is often due to cohort-specific differences in neurophysiology, electrode placement, or disease pathology. Decoders trained on data from one cohort may not generalize due to these underlying variations [46]. A connectomics-informed approach can significantly improve cross-cohort generalization. By using functional or structural connectivity fingerprints from recording locations in a standardized normative space, you can identify an optimal connectomic template for decoding that is consistent across diverse patient groups [46].
2. What are the major causes of chronic signal degradation in neural implants, and how do they impact decoder performance?
Chronic signal degradation primarily results from the brain's foreign body response [12]. The key issues are:
- Glial Scar Formation: The insertion of a neural implant breaches the blood-brain barrier, activating microglia and astrocytes. Over weeks, these cells form a dense glial sheath around the implant [12] [23]. This sheath acts as an insulating layer, increasing the distance between neurons and recording sites, which leads to a progressive attenuation of signal amplitude and a sharp rise in impedance [12] [23].
- Neuronal Loss: Neuronal cell death and neurite degeneration can occur within a 150 μm radius of the implanted device, reducing the population of neurons available for recording [12].
This degradation directly impacts decoders by causing a slow but consistent drift in signal features, which can render a decoder trained on baseline data obsolete over time [74] [12].
3. How does therapeutic Deep Brain Stimulation (DBS) affect the decoding of brain states?
Therapeutic high-frequency DBS can create large stimulation artefacts that contaminate local field potentials (LFPs) recorded from the stimulation target, making it "impossible to capture the different features" [74]. Furthermore, the electrical stimulation itself may alter neural encoding and the content of neural signals over time [74] [46]. It is recommended to train separate decoder models for stimulation ON and OFF conditions or to develop artefact-robust feature sets to mitigate this issue [46].
4. Are cortical or subcortical signals better for building generalizable adaptive decoders?
Cortical signals, such as electrocorticography (ECoG), offer several advantages for chronic, adaptive decoding [74]:
- Higher Signal Quality: Cortical LFPs have a larger signal amplitude and a richer spectral range compared to subcortical LFPs [74].
- Spatial Specificity: Signals of interest are spatially separated on the cortical surface, allowing for more precise decoding with standard electrode arrays [74].
- Stability: Cortical biomarkers can remain stable for years, whereas subcortical signals may be unstable over months [74].
- Artefact Avoidance: Cortical recordings are physically distant from subcortical DBS stimulation sites, avoiding the massive stimulation artefacts that can dominate recordings from the stimulation target [74].
5. What experimental strategies can improve the long-term stability of my recordings?
Improving the biocompatibility of the neural interface is key to long-term stability [23]:
- Flexible Electrodes: Use electrodes with a low Young's modulus (flexible materials) to reduce mechanical mismatch with brain tissue, which minimizes chronic inflammation and micromotion-induced damage [23].
- Minimized Cross-Section: Design electrodes with smaller cross-sectional areas (e.g., filament or nanowire electrodes) to reduce acute implantation injury and promote better integration with tissue [23].
- Surface Functionalization: Employ passive surface coatings to enhance biocompatibility or active drug-release systems to locally deliver anti-inflammatory compounds, modulating the tissue response [23].
Table 1: Comparison of Signal Recording Locations for Decoding
| Signal Location | Signal Amplitude | Spectral Richness | Stability (Long-term) | Vulnerability to Stimulation Artefacts |
|---|---|---|---|---|
| Cortical (ECoG) | Larger [74] | Wider, richer [74] | High (years) [74] | Low (distant from source) [74] |
| Subcortical (LFP) | Lower [74] | Narrower [74] | Low (can be unstable over months) [74] | High (at the source) [74] |
Table 2: Impact of Foreign Body Response on Recorded Signals [12]
| Time Post-Implantation | Cellular Events | Impact on Signal |
|---|---|---|
| Acute (Minutes to 24h) | Microglia activation, process extension, and cell body migration to the site. | Introduction of biological noise, local changes in neurochemistry. |
| Chronic (Weeks to Months) | Persistent microglial activation, astrocyte proliferation, and formation of a compact glial sheath. Neuronal death within ~150 μm. | Signal amplitude attenuation, increased impedance, reduced number of detectable units. |
Experimental Protocols
Protocol 1: Implementing a Connectomics-Informed Cross-Cohort Decoding Pipeline
This methodology enables the development of decoders that generalize across patient cohorts without individual training, as demonstrated in [46].
Workflow Diagram:
Detailed Methodology:
- Data Acquisition and Localization: Collect invasive brain signal data (e.g., ECoG) from multiple cohorts. Pre-process signals and localize each recording contact in a standard stereotaxic space (e.g., Montreal Neurological Institute - MNI space) [46].
- Connectivity Fingerprinting: For each recording contact, use its MNI coordinates as a seed to extract a whole-brain functional or structural connectivity map from a normative connectome database [46].
- Identify Connectomic Decoding Network Map: Calculate voxel-wise correlations between decoding performance (e.g., movement classification accuracy) and the whole-brain connectivity maps across all participants. This identifies a consensus network map optimal for the decoding task [46].
- A Priori Channel Selection: For a new patient, select the recording channel whose individual connectivity fingerprint has the highest spatial overlap with the pre-defined optimal connectomic template map. This selects the best channel without patient-specific model training [46].
- Feature Extraction and Embedding: Extract a versatile set of features from the selected channel, including oscillatory power in standard frequency bands, waveform shape, and aperiodic components. Transform these features into a lower-dimensional embedding using a contrastive learning approach (e.g., with a convolutional neural network trained using a Noise-Contrastive Estimation loss) to enhance cross-participant consistency [46].
- Model Training and Validation: Train a machine learning model (e.g., ridge-regularized logistic regression) on the embedded features from the source cohorts. Validate the model's performance on held-out data from the same cohorts and, critically, on entirely new cohorts to test generalization [46].
Protocol 2: Assessing the Impact of Therapeutic Stimulation on Decoding
This protocol evaluates and mitigates the impact of electrical stimulation on decoder stability.
Workflow Diagram:
Detailed Methodology:
- Data Collection: Record neural signals (e.g., cortical ECoG or subcortical LFP) while the patient performs a behavioral task. Repeat recordings with the therapeutic stimulation (e.g., DBS) turned OFF and ON [46].
- Artefact Mitigation Testing: Apply signal processing techniques to the ON condition data to mitigate stimulation artefacts. Common methods include using a bandpass filter to remove the stimulation frequency and its harmonics, or period-based artefact removal. Evaluate the quality of the cleaned signal [46].
- Decoder Training Strategies:
- Dual-Model Approach: Train two separate decoder models, one on the OFF-state data and another on the ON-state data. During operation, switch models based on the stimulation state [46].
- Single Robust Model: Train a single decoder model on a combined dataset that includes data from both OFF and ON states. This model may learn to be invariant to the stimulation-induced changes [46].
- Performance Evaluation: Evaluate all trained models on a held-out test set of ON-state data. Compare the performance (e.g., balanced accuracy, detection rate) of the dual-model and single-model approaches against a baseline model trained only on OFF-state data [46].
The Scientist's Toolkit
Table 3: Research Reagent Solutions for Neural Decoding Studies
| Item / Reagent | Function / Application |
|---|---|
py_neuromodulation Platform |
An open-source, modular Python software for standardized brain signal decoding. It enables extraction of oscillatory dynamics, waveform shape, coherence, and other features for machine learning [46]. |
| Flexible Polymer Electrodes | Neural interfaces made from polyimide or similar flexible materials with a low Young's modulus. They reduce mechanical mismatch with brain tissue, thereby minimizing chronic immune response and supporting long-term signal stability [23]. |
| Normative Connectome Database | A dataset of group-averaged brain connectivity (e.g., from the Human Connectome Project). Used for extracting connectivity fingerprints of electrode locations to enable cross-patient decoding models [46]. |
| Cortical Electrocorticography (ECoG) Strips | Electrode arrays placed on the cortical surface. They provide stable, high-amplitude signals for chronic recordings and are less susceptible to artefacts from subcortical stimulation, making them ideal for adaptive DBS biomarkers [74]. |
Troubleshooting Guides & FAQs
Why is my Signal-to-Noise Ratio (SNR) declining over time?
A declining SNR is often caused by biotic and abiotic factors affecting the electrode-tissue interface.
Probable Causes & Solutions:
- Increased Electrode Impedance: This can be due to protein fouling or the formation of a glial scar (encapsulation tissue) around the electrode, which electrically insulates it.
- Solution: Consider using electrodes with micro/nanoscale surface modifications. Materials like platinum black, iridium oxide, or conductive polymers (e.g., PEDOT) can significantly increase the effective surface area, lowering impedance and improving SNR [75].
- Chronic Immune Response: The body's prolonged reaction to the implanted device can lead to persistent inflammation, neuronal death, and increased biological noise [75].
- Solution: Utilize hyperflexible electrodes that minimize mechanical mismatch with brain tissue. One study showed that a hyperflexible array (SHEA) maintained a stable SNR between 10 and 30 for over 9 weeks in mice, with minimal immune response [76].
- Increased Electrode Impedance: This can be due to protein fouling or the formation of a glial scar (encapsulation tissue) around the electrode, which electrically insulates it.
Experimental Protocol for Monitoring SNR:
- Calculation: SNR is typically calculated as: ( \frac{V{max} - V{min}}{2 \cdot RMS} ), where ( V{max} - V{min} ) is the peak-to-peak amplitude of the neural signal and RMS is the root mean square of the background noise [75].
- Monitoring: Regularly measure the RMS of the noise floor during periods of quiet (no neural activity) and track the peak-to-peak amplitude of identified single-unit action potentials. A rising RMS or falling amplitude indicates a degrading SNR.
How can I maintain a high Single-Unit Yield in long-term experiments?
Single-unit yield degradation is frequently linked to mechanical tissue damage and the ensuing immune response.
Probable Causes & Solutions:
- Mechanical Mismatch: Stiff electrodes cause micromotions that chronically injure surrounding neurons and activate immune cells [75] [76].
- Solution: Transition to ultrathin, hyperflexible electrodes. One study using a 1 µm thick probe demonstrated the ability to record single units stably for over 2 months, with a high yield of approximately 32 single units per session initially, stabilizing to around 12 after several weeks [76].
- Glial Scar Formation: Activated microglia and astrocytes form a physical barrier that isolates neurons from the recording sites.
- Solution: While material biocompatibility is key, a minimally invasive surgical implantation technique is also critical to reduce initial tissue damage and the acute immune response [76].
- Mechanical Mismatch: Stiff electrodes cause micromotions that chronically injure surrounding neurons and activate immune cells [75] [76].
Experimental Protocol for Quantifying Yield:
- Definition: Single-unit yield is the number of distinct, isolatable single neurons recorded per active electrode channel in a session.
- Procedure: Use a standardized spike sorting pipeline (e.g., MountainSort, Kilosort) after each recording session. Manually curate the results to ensure only well-isolated units with clear refractory periods in their autocorrelograms are counted. Track this count per electrode over time.
My decoding accuracy is dropping. Is it the model or the signal?
A drop in decoding performance can stem from signal degradation, a suboptimal model, or both.
Troubleshooting Steps:
- Check Signal Quality Metrics: First, correlate the decoding performance timeline with your recorded SNR and Single-Unit Yield. A concurrent decline strongly points to a signal quality issue [75] [52].
- Investigate Model Robustness: If signal metrics are stable, the model may be failing to generalize.
- Solution: Implement signal imputation algorithms to handle degraded data. A recent study introduced Confidence-Weighted Bayesian Linear Regression (CW-BLR) to impute missing or degraded multi-unit activity (MUA) and local field potential (LFP) features. This method was shown to restore decoding accuracy for kinematic trajectories when compared to simple mean imputation [52].
- Solution: For clinical applications, use connectomic decoding. One platform improved cross-patient decoding by using individual electrode locations to select channels that overlap with an optimal, group-derived brain network for the decoded behavior, reducing reliance on patient-specific model training [46].
Experimental Protocol for Isolving the Issue:
- Perform a bias-variance decomposition on your model's error to determine if the problem is overfitting (high variance) or underfitting (high bias) to the training data.
- Retrain your decoder on a small, recent dataset to test if it has adapted to the new signal characteristics. If performance recovers, the model was the primary issue.
| Metric | Baseline (Week 1-3) | Long-Term (Week 4-9) | Notes |
|---|---|---|---|
| Single-Unit Yield | ≈ 32 units per session | ≈ 12 units per session | Yield stabilized at a lower but consistent level. |
| Signal-to-Noise Ratio (SNR) | 10 - 30 | 10 - 30 | Remained stable throughout the 9-week period. |
| Spike Amplitude | 89 - 260 µV | 89 - 260 µV | Remained stable for each mouse over time. |
| Electrode Impedance | Gradually increased | Stabilized at ~1 MΩ after 4 weeks |
| Scaling Factor | Method | Impact on Top-10 Decoding Accuracy |
|---|---|---|
| Training Data | Increasing number of subjects | Performance increases, following a log-linear trend. |
| Test Data | Averaging predictions from multiple trials of the same word | Performance steadily increases, with a two-fold improvement observed (up to ~80% accuracy with 8 trials). |
Experimental Protocols
This protocol details the methodology for long-term single-unit recording from the spinal cord.
- Electrode Fabrication: Fabricate a hyperflexible electrode array (e.g., SHEA) using nanofabrication technologies. Key parameters: 1 µm thickness, 128 channels, recording sites of 20-30 µm diameter.
- Surgical Implantation: Implant the array into the target region (e.g., spinal cord ventral horn) of an anesthetized mouse. Use a surgical procedure that minimizes the electrode track to tens of micrometers to reduce initial damage.
- Chronic Recording: Conduct recording sessions multiple times per week over the desired period (e.g., 9+ weeks).
- Signal Processing: Amplify and filter signals (e.g., 300 Hz - 6 kHz for spikes). Perform spike sorting to isolate single units.
- Performance Tracking: In each session, record impedance, calculate SNR, count sorted single units, and measure spike amplitudes.
- Histological Validation: After the terminal session, perfuse the animal and section the neural tissue. Perform immunostaining for neurons (NeuN), astrocytes (GFAP), and microglia (CD68) to quantify glial scarring and neuronal density around the implant.
This protocol uses a confidence-weighted imputation model to handle signal degradation in implantable BMIs.
- Data Collection: Train animals to perform a behavioral task (e.g., forelimb reaching). Simultaneously, record neural signals (MUA and LFP) over many days using an implanted array.
- Establish Baseline: Use the first 7 days of high-quality data to train a neural decoder (e.g., a kernel-sliced inverse regression - kSIR - model) to predict behavior (e.g., movement velocity).
- Induce and Monitor Degradation: Continue recordings as signal quality naturally degrades in subsequent days (e.g., days 8-27).
- Impute Degraded Features: For each degraded channel, calculate a quality metric (e.g., SNR for MUA, Coherence for LFP). Use the CW-BLR algorithm to impute the missing or corrupted neural features (binned spike counts, LFP power), weighting the imputation by the channel's quality metric.
- Evaluate Decoding: Feed the imputed neural features into the pre-trained kSIR decoder and compare the decoding accuracy for the behavioral task against the performance achieved with non-imputed (degraded) data and other imputation methods (e.g., mean imputation).
Signaling Pathways & Workflows
Diagram 1: The pathway from implantation to signal degradation and key mitigation strategies.
Diagram 2: Workflow for using signal imputation to maintain decoding accuracy.
The Scientist's Toolkit: Research Reagent Solutions
Table 3: Essential Materials for Chronic Neural Interface Experiments
| Item | Function | Example / Rationale |
|---|---|---|
| Hyperflexible Electrode Array | Chronic neural recording with minimal tissue damage. | Ultrathin (e.g., 1 µm) probes made of polyimide or parylene, which drastically reduce mechanical mismatch and inflammatory response [76]. |
| Low-Impedance Coating Materials | To improve the electrode-tissue interface and boost SNR. | Platinum black, Iridium Oxide (IrOx), or conductive polymers like PEDOT:PSS. These create micro/nanostructures that increase the effective surface area [75]. |
| Signal Imputation Algorithm (CW-BLR) | A software tool to restore degraded neural features for decoding. | Confidence-Weighted Bayesian Linear Regression uses quality metrics (SNR, Coherence) to intelligently impute missing MUA and LFP data, recovering decoding performance [52]. |
| Connectomic Decoding Platform | For generalizable decoding across patients with different implant locations. | Software (e.g., py_neuromodulation) that uses normative brain connectomes to select optimal recording channels for decoding specific behaviors, reducing need for patient-specific training [46]. |
| Immunohistochemistry Antibodies | To validate biocompatibility and quantify immune response post-study. | Antibodies against GFAP (astrocytes), CD68/Iba1 (microglia), and NeuN (neurons) are essential for quantifying glial scarring and neuronal loss around the implant [76]. |
Conclusion
The path to stable, chronic neural implants requires a deeply interdisciplinary approach that seamlessly integrates advancements in biomaterials, probe design, and intelligent signal processing. The key takeaway is that no single solution is sufficient; progress hinges on simultaneously addressing the biological interface with softer, more biocompatible materials to reduce the foreign body response, and the computational challenge with robust, adaptive algorithms that can compensate for inevitable signal degradation. Future research must focus on creating closed-loop systems that are not only responsive to brain states but also self-calibrating to maintain performance over decades. The convergence of AI-driven neural decoding, such as connectomic frameworks that generalize across patients, with novel implantable hardware will be pivotal. Ultimately, these coordinated efforts are essential for realizing the full potential of BCIs in delivering lifelong therapies for neurological and psychiatric disorders, transforming them from research tools into reliable clinical solutions.
References
- 1. Engineering strategies towards overcoming bleeding and glial ... [https://pmc.ncbi.nlm.nih.gov/articles/PMC8975777/]
- 2. Revolutionizing brain‒computer interfaces - PubMed Central [https://pmc.ncbi.nlm.nih.gov/articles/PMC12243264/]
- 3. Glial responses to implanted electrodes in the brain - PMC [https://pmc.ncbi.nlm.nih.gov/articles/PMC6261524/]
- 4. Inflammatory Foreign Body Response Induced by Neuro- ... [https://www.frontiersin.org/journals/neuroscience/articles/10.3389/fnins.2021.646914/full]
- 5. Advances in flexible high-density microelectrode arrays for ... [https://www.sciencedirect.com/science/article/pii/S0956566325009790]
- 6. The relationship between glial cell mechanosensitivity and ... [https://www.sciencedirect.com/science/article/pii/S0142961214000544]
- 7. Computational Assessment of Neural Probe and Brain Tissue Interface under Transient Motion - PMC [https://www.ncbi.nlm.nih.gov/pmc/articles/PMC4931487/]
- 8. Micromotion - an overview | ScienceDirect Topics [https://www.sciencedirect.com/topics/engineering/micromotion]
- 9. Material and design strategies for chronically-implantable ... [https://www.nature.com/articles/s41427-025-00613-8]
- 10. Mechanical failure modes of chronically implanted planar ... [https://pmc.ncbi.nlm.nih.gov/articles/PMC4312222/]
- 11. Mechanical failure modes of chronically implanted planar ... [https://www.sciencedirect.com/science/article/abs/pii/S0142961214010874]
- 12. Brain Tissue Responses to Neural Implants Impact Signal ... [https://pmc.ncbi.nlm.nih.gov/articles/PMC4304489/]
- 13. Peripheral inflammation and blood–brain barrier disruption [https://pmc.ncbi.nlm.nih.gov/articles/PMC7804893/]
- 14. The blood–brain barrier in systemic infection and ... [https://www.nature.com/articles/s41423-021-00757-x]
- 15. Overcoming failure: improving acceptance and success of ... [https://bioelecmed.biomedcentral.com/articles/10.1186/s42234-025-00168-7]
- 16. Blood–Brain Barrier Disruption in Preclinical Mouse Models of ... [https://pmc.ncbi.nlm.nih.gov/articles/PMC9595391/]
- 17. Chronic inflammatory pain leads to increased blood-brain ... [https://pmc.ncbi.nlm.nih.gov/articles/PMC4638185/]
- 18. A Comprehensive Review of Current Issues with Neural Devices [https://pmc.ncbi.nlm.nih.gov/articles/PMC11468537/]
- 19. Signal Considerations for Chronically Implanted Electrodes for ... [https://www.ncbi.nlm.nih.gov/books/NBK3931/]
- 20. Enhancing biocompatibility of the brain-machine interface [https://www.sciencedirect.com/science/article/pii/S2452199X24003724]
- 21. Photoinitiated CVD antifouling coatings enable long-term ... [https://www.sciencedirect.com/science/article/pii/S0142961225004739]
- 22. Novel method to improve the biocompatibility and chronic ... [https://www.news-medical.net/news/20250630/Novel-method-to-improve-the-biocompatibility-and-chronic-stability-of-neural-electrode-implants.aspx]
- 23. Long-term stability strategies of deep brain flexible neural ... [https://www.nature.com/articles/s41528-025-00410-x]
- 24. Quantifying physical degradation alongside recording and ... [https://www.sciencedirect.com/science/article/pii/S1742706125001151]
- 25. Recent Advances in Neural Electrode-Tissue Interfaces - PMC [https://pmc.ncbi.nlm.nih.gov/articles/PMC5798641/]
- 26. Recent advances in neural electrode–tissue interfaces [https://www.sciencedirect.com/science/article/abs/pii/S2468451117300478]
- 27. Predicting Corrosion Delamination Failure in Active ... [https://pmc.ncbi.nlm.nih.gov/articles/PMC8773110/]
- 28. Technical Support (FAQ) [https://microprobes.com/support-and-download/technical-support]
- 29. Progress and challenges of implantable neural interfaces ... [https://pmc.ncbi.nlm.nih.gov/articles/PMC8077843/]
- 30. Engineering aspects and materials for next generation ... [https://www.sciencedirect.com/science/article/pii/S1877117325001279]
- 31. Advances in bioelectronics for neural interfacing [https://link.springer.com/article/10.1557/s43579-025-00822-w]
- 32. Toward guiding principles for the design of biologically ... [https://pmc.ncbi.nlm.nih.gov/articles/PMC7523527/]
- 33. Chronically Implanted Intracranial Electrodes: Tissue ... [https://www.mdpi.com/2072-666X/9/9/430]
- 34. 3D-printed flexible neural probes for recordings at single- ... [https://www.sciencedirect.com/science/article/pii/S2666998624004198]
- 35. Understanding Medical Coatings: Complete Guide [https://hydromer.com/understanding-medical-coatings-complete-guide/]
- 36. Immunomodulating Red Blood Cell Coating for Mitigation ... [https://www.sciencedirect.com/science/article/pii/S2666138125000143]
- 37. Smart biomaterials: as active immune modulators to shape pro ... [https://pmc.ncbi.nlm.nih.gov/articles/PMC12558899/]
- 38. An automatic spike sorting algorithm based on adaptive ... [https://www.nature.com/articles/s41598-021-93088-w]
- 39. A new evolutionary approach for neural spike detection ... [https://www.sciencedirect.com/science/article/abs/pii/S095741741400445X]
- 40. Real-time, neural signal processing for high-density brain- ... [https://pubmed.ncbi.nlm.nih.gov/40682086/]
- 41. Brain implants that don't leave scars [https://news.harvard.edu/gazette/story/2025/08/brain-implants-that-dont-leave-scars/]
- 42. A modular, adaptable, and accessible implant kit for chronic ... [https://pmc.ncbi.nlm.nih.gov/articles/PMC12539253/]
- 43. Generalizable, real-time neural decoding with hybrid state- ... [https://arxiv.org/html/2506.05320v1]
- 44. Emerging Implantable Sensor Technologies at the Intersection ... [https://pmc.ncbi.nlm.nih.gov/articles/PMC12650648/]
- 45. Advances in Neuromodulation and Digital Brain–Spinal ... [https://www.mdpi.com/1422-0067/26/13/6021]
- 46. Invasive neurophysiology and whole brain connectomics ... [https://www.nature.com/articles/s41551-025-01467-9]
- 47. A new approach for neural decoding by inspiring of ... [https://www.nature.com/articles/s41598-024-74681-1]
- 48. Neural Decoding and Feature Selection Techniques for ... - PMC [https://pmc.ncbi.nlm.nih.gov/articles/PMC11185693/]
- 49. Invasive neurophysiology and whole brain connectomics for neural decoding in patients with brain implants - PMC [https://pmc.ncbi.nlm.nih.gov/articles/PMC10543023/]
- 50. Neuromorphic algorithms for brain implants: a review [https://www.frontiersin.org/journals/neuroscience/articles/10.3389/fnins.2025.1570104/full]
- 51. Mapping the Brain to Improve Deep Brain Stimulation [https://advances.massgeneral.org/neuro/article.aspx?id=1551]
- 52. Degradation-aware neural imputation: Advancing decoding ... [https://pmc.ncbi.nlm.nih.gov/articles/PMC12005879/]
- 53. Advancing decoding stability in brain machine interfaces [https://pubmed.ncbi.nlm.nih.gov/40247859/]
- 54. Removing deep brain stimulation artifacts from the ... [https://www.sciencedirect.com/science/article/abs/pii/S1388245718311842]
- 55. Periodic Artifact Removal With Applications to Deep Brain ... [https://pmc.ncbi.nlm.nih.gov/articles/PMC9553325/]
- 56. A Real-time Artifact Removal System for Closed-loop Deep ... [https://pubmed.ncbi.nlm.nih.gov/40815592/]
- 57. Unraveling the mechanisms of deep-brain stimulation ... [https://www.nature.com/articles/s41467-023-41026-x]
- 58. Advancements in neural implant research enhance durability [https://www.sciencedaily.com/releases/2025/01/250107140908.htm]
- 59. Signal properties and stability of a chronically implanted ... [https://www.medrxiv.org/content/10.1101/2025.09.19.25335897v1]
- 60. Real-time, neural signal processing for high-density brain ... [https://pmc.ncbi.nlm.nih.gov/articles/PMC12275325/]
- 61. Comparative analysis of energy transfer mechanisms for neural ... [https://pmc.ncbi.nlm.nih.gov/articles/PMC10825050/]
- 62. Wireless Neural Smaller Than a Grain of Salt Monitors Brain Implant [https://scienmag.com/wireless-neural-implant-smaller-than-a-grain-of-salt-monitors-brain-activity/]
- 63. Seismic random noise separation and suppression based on ... [https://journals.plos.org/plosone/article?id=10.1371/journal.pone.0330988]
- 64. Denoising method of machine tool vibration signal based ... [https://www.nature.com/articles/s41598-023-28404-7]
- 65. Strain signal denoising in bridge SHM: A comparative ... [https://www.sciencedirect.com/science/article/pii/S2772991525000180]
- 66. The Maximal Overlap Discrete Wavelet Scattering ... [https://arxiv.org/html/2506.12039v1]
- 67. Electrocardiogram Signals Denoising Using Improved ... [https://pmc.ncbi.nlm.nih.gov/articles/PMC8253313/]
- 68. Neural Probes for Chronic Applications - PMC - PubMed Central [https://pmc.ncbi.nlm.nih.gov/articles/PMC6190051/]
- 69. Longevity and Reliability of Chronic Unit Recordings using ... [https://pmc.ncbi.nlm.nih.gov/articles/PMC8981395/]
- 70. An approach for long-term, multi-probe Neuropixels ... [https://pmc.ncbi.nlm.nih.gov/articles/PMC7721443/]
- 71. ChroMOS: a “microwire-like” CMOS neural probe for ... [https://www.sciencedirect.com/science/article/pii/S0956566325008188]
- 72. A modular, adaptable, and accessible implant kit for ... [https://www.sciencedirect.com/science/article/pii/S2667237525001821]
- 73. Are patients with Parkinson's disease impaired in the ... [https://pmc.ncbi.nlm.nih.gov/articles/PMC12424116/]
- 74. Challenges and opportunities of acquiring cortical ... [https://pmc.ncbi.nlm.nih.gov/articles/PMC12413772/]
- 75. Implantable intracortical microelectrodes: reviewing the ... [https://www.nature.com/articles/s41378-022-00451-6]
- 76. A Hyperflexible Electrode Array for Long‐Term Recording ... [https://pmc.ncbi.nlm.nih.gov/articles/PMC10667843/]