High-Resolution MRI vs. Standard MRI: A Deep Dive into Tissue Specificity for Research and Drug Development
This article explores the transformative impact of high-resolution and ultra-high-field Magnetic Resonance Imaging (MRI) on tissue specificity, a critical factor for researchers and drug development professionals.
High-Resolution MRI vs. Standard MRI: A Deep Dive into Tissue Specificity for Research and Drug Development
Abstract
This article explores the transformative impact of high-resolution and ultra-high-field Magnetic Resonance Imaging (MRI) on tissue specificity, a critical factor for researchers and drug development professionals. We cover the foundational physics behind resolution and signal-to-noise ratio (SNR) gains at higher field strengths. The piece details methodological hardware advancements, such as high-performance gradient coils and multi-channel receiver arrays, and their application in neurology, oncology, and musculoskeletal imaging. It also addresses key challenges like intensity standardization and artifacts, providing optimization strategies. Finally, we examine the validation of high-resolution MRI through its role as a qualified biomarker in clinical trials and its comparative performance against standard MRI, synthesizing how these advances de-risk and accelerate the drug development pipeline.
The Fundamental Principles: How Magnetic Field Strength and Resolution Dictate Tissue Contrast
In magnetic resonance imaging (MRI), the pursuit of higher spatial resolution is fundamentally constrained by the signal-to-noise ratio (SNR). The relationship between SNR and the main magnetic field strength (B0) serves as a critical foundation for technological advancement in neuroimaging, particularly in research requiring exquisite anatomical detail. The intrinsic SNR gain at higher fields enables researchers to achieve superior spatial resolution within practically feasible scan times, thereby facilitating more precise visualization of neural structures and pathological features. This principle is especially relevant for high-resolution MRI studies focused on tissue specificity, where the ability to discriminate fine anatomical details can significantly impact the detection and characterization of neurological disorders [1]. The following sections will explore the fundamental physics underlying the B0-SNR relationship, present experimental validations across various field strengths, detail the advanced hardware that exploits this principle, and examine practical applications in contemporary neuroscience and clinical research.
The Fundamental Physics of SNR and Field Strength Dependence
The signal-to-noise ratio in MRI has a well-established theoretical dependence on the main magnetic field strength. The fundamental relationship is often described as SNR ∝ B0, suggesting a linear improvement with increasing field strength [1]. However, empirical measurements in practical imaging scenarios frequently reveal a more complex, supralinear relationship. At ultra-high fields (≥7T), the intrinsic SNR has been shown to increase with B0 raised to a power greater than one, with studies reporting exponents of approximately 1.65 [2]. This supralinear gain is a key motivation for developing ultra-high-field MRI systems for research applications.
The physical basis for this relationship stems from the population difference between nuclear spin states aligned with and against the main magnetic field. This difference, which determines the net measurable magnetization, increases approximately linearly with B0 according to the principles of quantum mechanics. Consequently, the available signal for image formation is greater at higher fields. The practical realization of this theoretical gain is modulated by several factors, including changes in tissue relaxation times (T1, T2, T2) and increasing technical challenges related to B0 and B1 field inhomogeneity at higher field strengths [2] [1]. For instance, T1 relaxation times lengthen with increasing B0, which can affect contrast mechanisms, while T2 values shorten, influencing the signal in gradient-echo-based sequences.
Figure 1: The Fundamental Relationship Between Magnetic Field Strength and Image Quality. This diagram illustrates the direct relationship between increasing main magnetic field strength (B₀) and improvements in both signal-to-noise ratio (SNR) and the resulting image quality parameters, underpinned by fundamental physical principles.
Experimental Validation and Quantitative Data
Empirical Evidence from Multi-Field Strength Studies
Experimental measurements consistently validate the theoretical supralinear gain in SNR with increasing field strength. A comprehensive 2024 study systematically evaluated SNR across five field strengths from 3T to 14.1T using small surface coils relevant for animal imaging. Before coil sensitivity correction, the observed SNR increase in non-conductive samples was highly supralinear, ranging from B0^1.6 to B0^2.7 depending on the distance from the coil. In conductive samples, which better mimic biological tissues, the growth was approximately linear near the coil surface and increased up to a B0^2.0 dependence at greater distances. After correcting for coil sensitivity, the ultimate intrinsic SNR increase was independent of sample loading with a consistent B0^2.1 dependence, confirming the substantial benefit of higher magnetic fields [3].
High-Resolution Structural Imaging at Ultra-High Field
The practical benefit of increased SNR is most directly realized through enhanced spatial resolution. As summarized in Table 1, the improved SNR at 7T enables routine acquisition of structural images at sub-millimeter resolutions that are challenging to achieve at lower field strengths. For example, 7T MRI can visualize the hippocampal formation at 450-μm in-plane resolution, revealing anatomical details critical for epilepsy research [1]. The next-generation 7T scanner described by [4] pushes this further, achieving functional imaging studies at 0.35–0.45 mm isotropic resolution, which begins to approach the scale of cortical columns and layers.
Table 1: Typical Structural Imaging Resolutions Achievable at Different Field Strengths
| Field Strength | Typical Isotropic Resolution (mm) | Voxel Volume (μL) | Key Applications |
|---|---|---|---|
| 1.5T | 1.0 × 1.0 × 1.0 | 1.0 | Clinical standard, general neuroimaging |
| 3.0T | 0.8 × 0.8 × 0.8 | 0.51 | Pre-surgical planning, detailed anatomy |
| 7.0T | 0.6 × 0.6 × 0.6 | 0.22 | Mesoscale imaging, cortical layers |
| Next-Gen 7T | 0.35 × 0.35 × 0.35 | 0.04 | Cortical columns, laminar fMRI |
The Resolution-SNR Trade-Off in MRS
The relationship between voxel size and SNR becomes more complex at high magnetic fields. A foundational 2001 study challenged the conventional wisdom that SNR is linearly proportional to voxel volume in proton MR spectroscopy (¹H-MRS). When voxel dimensions were halved (reducing volume eightfold), the metabolite SNR decreased only fourfold due to a commensurate twofold decrease in local linewidths (Δυ). This T2 increase with smaller voxels occurs because regional B0 inhomogeneities (ΔB0), which dominate linewidths at high fields, are averaged more effectively in smaller voxels. This phenomenon means that both spatial and spectral resolution can be doubled at a significantly smaller-than-expected SNR penalty, enabling quality high spatial resolution (0.75 × 0.75 × 0.75 cm³) metabolic maps in clinically feasible acquisition times [5].
Advanced Hardware for Exploiting the B0-SNR Relationship
Next-Generation Gradient Systems
Maximizing the benefit of high field strength requires complementary advances in gradient performance. A next-generation 7T scanner described by [4] features an asymmetric head-only gradient coil with a third layer of windings, achieving performance metrics an order of magnitude greater than standard 7T systems: 200 mT/m maximum amplitude and 900 T/m/s slew rate. This enhanced gradient performance enables higher resolution diffusion imaging, reduces echo spacing in EPI sequences to minimize T2* blurring and geometric distortion, and permits shorter echo times for increased signal [4].
High-Density Receiver Array Coils
Radiofrequency receiver technology plays a crucial role in translating field strength advantages into measurable signal. The same next-generation 7T system implements a 128-channel receiver system with both 64- and 96-channel receiver coil arrays. Compared to a standard 32-channel array, these high-density arrays provide approximately 30% higher SNR in cortical regions due to smaller coil elements (∼4 cm diameter) that better match the tissue geometry of the human head. Additionally, the accelerated parallel imaging capability of these arrays reduces the g-factor noise penalty, enabling higher acceleration factors for faster acquisition [4].
Table 2: Key Hardware Components for Maximizing SNR at Ultra-High Field
| Component | Standard 7T Performance | Next-Generation 7T Performance | Impact on SNR/Resolution |
|---|---|---|---|
| Gradient Strength | 80 mT/m (AC84) | 200 mT/m (Impulse) | ↑ Encoding resolution, ↓ TE |
| Gradient Slew Rate | 400-500 T/m/s | 900 T/m/s | ↑ Acquisition speed, ↓ distortions |
| Receiver Channels | 32 channels | 128 channels | ↑ Parallel imaging acceleration |
| Coil Element Size | ~6-8 cm diameter | ~4 cm diameter | ↑ Cortical SNR by ~30% |
Methodologies for SNR Measurement and Sequence Optimization
Standardized SNR Measurement Protocols
Consistent methodology is essential for valid comparison of SNR across platforms and field strengths. The most common approach involves region-of-interest (ROI) measurements:
- Place the first ROI on homogeneous tissue with high signal intensity (e.g., white matter)
- Place the second ROI outside the tissue in the image background
- Calculate SNR = Signalmean / Noisestandard_deviation [6]
For dynamic studies like DCE-MRI, an alternative definition uses repeated measurements: SNR = Signalmean / Standarddeviationacrossbaselineimageframes [7]. This approach accounts for temporal stability in addition to spatial noise characteristics.
Sequence Parameter Optimization for SNR
Beyond field strength, numerous acquisition parameters influence the final image SNR:
- Slice Thickness: Increasing slice thickness from 2mm to 6mm can increase SNR by approximately 125% (from 40% to 90% relative SNR), though with reduced spatial resolution and increased partial volume effects [6]
- Receiver Bandwidth: Halving the receiver bandwidth increases SNR by approximately 30%, though at the cost of increased susceptibility artifacts and longer scan times [6]
- Repetition Time (TR) and Echo Time (TE): Increasing TR enhances SNR but reduces T1 weighting; decreasing TE increases SNR but reduces T2 weighting [6]
Applications in Neuroimaging Research
Mesoscale Imaging of Cortical Architecture
The enhanced SNR at 7T enables visualization of brain architecture at an unprecedented scale. As illustrated in Figure 2, next-generation 7T scanners achieve sufficient resolution to resolve cortical layers and columns, which are fundamental functional units of cerebral organization. With human cortical thickness varying between 1.5 and 4.5 mm, and cortical columnar features measuring 0.6–1.0 mm, resolutions of 0.3–0.6 mm are required to adequately sample these structures while minimizing partial volume effects [4].
Figure 2: Research Applications Enabled by High-SNR Ultra-High Field MRI. This workflow diagram illustrates how the increased SNR available at ultra-high magnetic fields enables mesoscale imaging, which in turn facilitates specific research applications with direct clinical impact.
Advanced Contrast Mechanisms and Multinuclear Imaging
Ultra-high-field MRI extends beyond anatomical imaging to leverage novel contrast mechanisms and multinuclear spectroscopy:
- Susceptibility-Weighted Imaging (SWI): Sensitivity to susceptibility effects scales with B0, dramatically improving visualization of venous microvasculature, microbleeds, and iron deposits [1]
- Time-of-Flight Angiography: The combination of higher SNR and longer T1 values at 7T enhances background suppression, increasing vessel-to-tissue contrast and enabling visualization of smaller arterial branches [1]
- MR Spectroscopic Imaging: Spectral separation of metabolite peaks increases linearly with B0, improving quantification of neurotransmitters and metabolic markers in disorders like brain tumors [1]
- Multinuclear Imaging: SNR gains make non-proton nuclei (²³Na, ³¹P) accessible, providing insights into cellular energetics and ion homeostasis in pathological states [1]
The Scientist's Toolkit: Essential Research Reagents and Materials
Table 3: Essential Hardware and Methodological Components for High-Resolution Neuroimaging Research
| Component | Function/Role | Research Application |
|---|---|---|
| High-Density Receiver Coils | Increase signal reception proximity to cortex | Maximize SNR for cortical surface imaging |
| High-Performance Gradients | Enable faster spatial encoding | Reduce distortion in EPI; enable high-resolution DTI |
| Parallel Transmission Systems | Mitigate B1+ inhomogeneity at UHF | Improve image uniformity in body regions |
| Motion Correction Systems | Enable long acquisitions without degradation | Facilitate ultra-high resolution (<0.5 mm) imaging |
| Deep Learning Super-Resolution | Enhance lower-field images computationally | Harmonize multi-site data (1.5T→3T quality) [8] |
| Adiabatic RF Pulses | Overcome B1+ inhomogeneity | Accurate spectral localization in MRSI [1] |
In the realms of neuroimaging, oncology, and drug development, the precise definition of spatial sampling scale—determined by the interplay between spatial resolution and voxel volume—fundamentally shapes the interpretation of biological phenomena. Spatial resolution defines the smallest distinguishable distance between two points, while voxel volume represents the three-dimensional pixel size that constitutes the fundamental unit of digital image data. These parameters establish the boundaries of what can be observed and quantified across macroscopic to mesoscopic biological scales, directly impacting the detection of pathological changes, assessment of therapeutic efficacy, and validation of drug targets. For researchers and pharmaceutical developers, the selection of imaging parameters represents a critical tradeoff between field of view, sampling granularity, signal-to-noise ratio, and practical constraints. This guide objectively compares the performance of high-resolution magnetic resonance imaging (MRI) against standard-resolution approaches, supported by experimental data quantifying their differential impacts on measurement accuracy, biological specificity, and clinical relevance.
Technical Foundations: Voxel Geometry and Its Biological Interpretation
Fundamental Principles of Voxel-Based Sampling
In medical imaging, a voxel (volume pixel) represents the smallest unit of a three-dimensional image, with dimensions defined by field of view, matrix size, and slice thickness according to the relationship: Voxel Volume = (Field of View / Matrix Size) × Slice Thickness [9]. This geometric definition establishes the fundamental sampling scale that governs the detection and quantification of biological structures. The partial volume effect occurs when a single voxel contains multiple tissue types, resulting in a signal average that obscures anatomical boundaries and reduces measurement accuracy [10]. This effect becomes particularly problematic when voxel dimensions approach or exceed the size of structures under investigation, such as small brain nuclei or thin cortical layers.
The signal-to-noise ratio (SNR) in MRI maintains an inverse relationship with voxel size at fixed acquisition times, creating a fundamental tradeoff that imaging protocols must optimize for specific applications [11]. While smaller voxels provide finer spatial resolution, they simultaneously reduce SNR, potentially obscuring subtle contrast differences in soft tissues. Furthermore, voxel geometry—whether isotropic (equal dimensions in all axes) or anisotropic (unequal dimensions)—significantly impacts the accuracy of volumetric measurements and edge detection, particularly for small, complex anatomical structures [10].
Biological Context Determines Optimal Voxel Parameters
The optimal voxel size varies substantially across biological applications, with different structures imposing distinct resolution requirements as summarized in Table 1. For instance, the subthalamic nucleus and internal globus pallidus—key targets for deep brain stimulation in Parkinson's disease—exhibit post-mortem volumes of approximately 130mm³ and 377mm³ respectively [10]. To ensure deviations remain within an acceptable range (Dice coefficient > 0.75), simulation studies indicate that isotropic voxel volumes should not exceed 5% of the total structure volume [10]. Similar considerations apply to cortical layer imaging, where high-resolution 4D vascular space occupancy (VASO) MRI at 7 Tesla employs submillimeter resolution to distinguish microvascular volumetric pulsatility across six cortical layers [12].
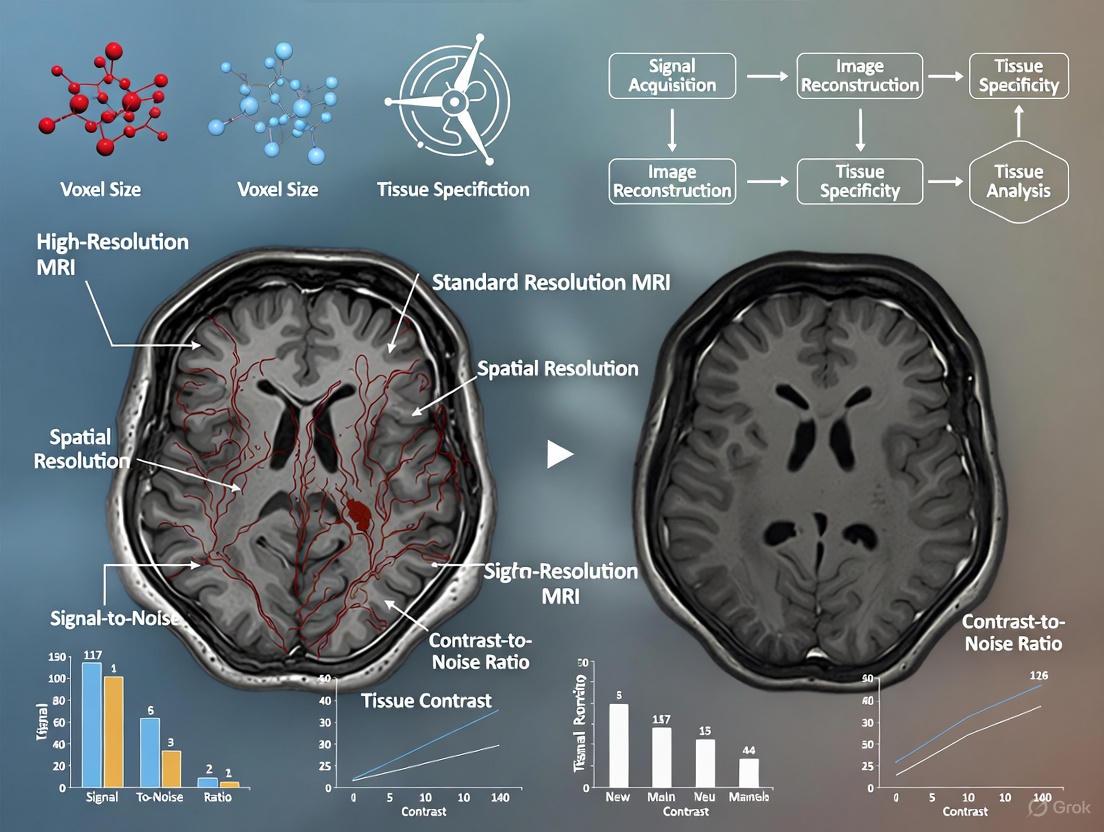
Figure 1: Fundamental relationships between imaging parameters and data quality. Voxel volume is determined by acquisition parameters, which collectively influence spatial resolution and signal-to-noise ratio. These factors subsequently impact critical image quality metrics relevant to biological interpretation.
Comparative Performance: High-Resolution vs. Standard MRI
Tissue Specificity Across Resolution Scales
Table 1: Performance Comparison of MRI Resolution Scales Across Biological Contexts
| Biological Context | Standard Resolution (Typical Parameters) | High Resolution (Typical Parameters) | Quantifiable Impact on Measurement |
|---|---|---|---|
| Cortical Layer Analysis | 1mm isotropic voxels [13] | 0.6-0.8mm isotropic at 7T [12] | Enables differentiation of 6 cortical layers with distinct microvascular pulsatility profiles (mvPI: 0.18±0.04 in pial mater vs. 0.08±0.02 in middle layers) [12] |
| Small Brain Nuclei (STN/GPi) | 1mm³ isotropic [10] | 0.6-0.8mm isotropic [10] | Dice similarity coefficients decline from >0.9 to <0.75 when voxel volume exceeds 5% of structure volume [10] |
| Vestibular Schwannoma Volumetry | 1.2×0.9×4.0mm anisotropic [9] | 0.5×0.5×0.8mm isotropic [9] | Segmentation accuracy decreases by 22-35% with larger voxels; AI-based methods outperform manual segmentation at all resolutions [9] |
| Microvascular Pulsatility | Limited to large vessels [12] | 0.75mm isotropic 4D VASO at 7T [12] | Reveals laminar mvPI gradient from pial surface (0.18±0.04) to white matter (0.06±0.02); detects aging effects in deep WM (P=0.006) [12] |
| Multisite VBM Studies | 1-1.5mm isotropic [13] | 0.8-1mm isotropic [13] | Pipeline choice alone alters location of reported group differences; only 10.98% spatial overlap in sex differences across 4 pipelines [13] |
Quantitative Impacts on Measurement Accuracy
The transition from standard to high-resolution imaging produces quantifiable improvements in measurement precision across diverse applications. In neurofibromatosis type 2-related schwannomatosis (NF2-SWN), vestibular schwannoma volumetry demonstrates significantly improved accuracy with smaller voxel dimensions. A systematic evaluation of segmentation performance across varying voxel sizes revealed that larger voxels (1.2 × 0.9 × 4.0 mm) reduced segmentation accuracy by 22-35% compared to high-resolution acquisitions (0.5 × 0.5 × 0.8 mm), with AI-based segmentation outperforming manual methods particularly at coarser resolutions [9]. These findings highlight the critical importance of voxel optimization for longitudinal tumor monitoring in clinical trials.
In cerebral microvasculature imaging, high-resolution 4D vascular space occupancy (VASO) at 7 Tesla enables quantification of microvascular volumetric pulsatility index (mvPI) across cortical layers—a measurement inaccessible to standard-resolution approaches [12]. This technique reveals a pronounced laminar gradient in mvPI, with highest values at the pial surface (0.18 ± 0.04) that progressively decrease through gray matter to white matter. Critically, this spatial resolution enables detection of aging-related changes, demonstrating significantly elevated deep white matter mvPI in older participants (P = 0.006) [12]. Furthermore, the method reveals territory-specific pulsatility patterns, with middle cerebral artery regions exhibiting higher mvPI than anterior or posterior cerebral artery territories across cortical layers [12].
The reproducibility of voxel-based morphometry (VBM) findings exhibits pronounced dependency on processing pipelines, with substantial variability introduced by software choices alone. A systematic comparison of four commonly used VBM pipelines (CAT, FSLVBM, FSLANAT, sMRIPrep) revealed generally low spatial similarity between processed gray matter maps from the same participants across different pipelines [13]. When examining sex differences, only 10.98% spatial overlap was observed across all four pipelines at a conventional cluster-level threshold (pFWE < 0.05), indicating that analytical choices alone can substantially alter the anatomical localization of reported group differences [13].
Experimental Protocols for Resolution-Specific Validation
High-Resolution Microvascular Pulsatility Mapping
The protocol for assessing cerebral microvascular volumetric pulsatility employs high-resolution 4D VASO MRI at 7 Tesla with simultaneous pulse recording to achieve the necessary spatiotemporal resolution for microvascular assessment [12]. The methodology involves several critical stages:
Image Acquisition: Implement 0.75mm isotropic resolution using a 3D turbo-FLASH (TFL) pseudo-continuous arterial spin labeling (pCASL) sequence at 7 Tesla with cardiac synchronization to resolve pulsatility across the cardiac cycle [12].
Tissue Segmentation: Derive laminar profiles from T1-weighted MRI, segmenting gray matter into six equi-volume layers from superficial to deep, plus separate pial mater and superficial white matter layers. Deep white matter regions are obtained by subtracting superficial white matter from total white matter [12].
Hemodynamic Calculation: Compute cerebral blood flow (CBF) from ASL data, then estimate baseline cerebral blood volume (CBV0) using the relationship CBV0 = CBF × arterial transit time. Calculate CBV changes across cardiac cycles (ΔCBV = CBVmax - CBVmin) from VASO signals [12].
Pulsatility Quantification: Derive microvascular volumetric pulsatility index (mvPI) as mvPI = ΔCBV / CBV0, representing the fractional volume change of microvasculature between systolic and diastolic phases [12].
Validation: Perform test-retest scans with long intervals (3-8 months), non-parametric reliability testing, and simulations to demonstrate reproducibility and accuracy [12].
Figure 2: Experimental workflow for high-resolution microvascular pulsatility mapping. This protocol enables layer-specific quantification of volumetric pulsatility across cardiac cycles, revealing gradients inaccessible to standard-resolution approaches.
Voxel Size Impact Assessment in Tumor Volumetry
The systematic evaluation of voxel size effects on segmentation accuracy employs a resampling approach to quantify performance degradation across resolution scales [9]:
Subject Population: Include patients with NF2-SWN with vestibular schwannomas, acquiring high-resolution T1 post-contrast MRI scans as ground truth reference.
Multi-resolution Simulation: Use linear interpolation to resample original high-resolution images (e.g., 0.5 × 0.5 × 0.8 mm) to progressively larger voxel sizes (0.8 × 0.8 × 0.9 mm, 0.8 × 0.8 × 1.6 mm, and 1.2 × 0.9 × 4.0 mm) representing clinically common protocols [9].
Segmentation Methods: Apply both manual segmentation by trained researchers (with neuroradiologist review) and AI-based auto-segmentation using convolutional neural networks to all resolution levels.
Accuracy Quantification: Calculate percentage volume change relative to original high-resolution segmentation, Dice similarity coefficients for spatial overlap, and Hausdorff distances for boundary agreement [9].
Statistical Analysis: Employ Wilcoxon signed-rank tests to compare segmentation performance across voxel sizes and between methods (AI vs. manual), with visualization using R ggplot2 and tidyverse packages [9].
Implementation Framework for Research and Development
Research Reagent Solutions for High-Resolution Imaging
Table 2: Essential Research Materials and Analytical Tools for Resolution-Specific Studies
| Category | Specific Solution | Research Application | Performance Consideration |
|---|---|---|---|
| Imaging Hardware | 7 Tesla MRI Scanner | Ultra-high field imaging for cortical layer analysis [12] | Enables <0.8mm isotropic resolution; essential for microvascular pulsatility mapping |
| Pulse Sequences | 3D turbo-FLASH (TFL) pCASL | Cerebral blood flow and volume quantification [12] | Provides 0.75mm isotropic resolution with cardiac synchronization |
| Segmentation Software | Simpleware (Synopsys) | Manual and AI-based tumor volumetry [9] | "Paint by Threshold" tool with AI auto-segmentation capability |
| Voxel-Based Morphometry | CAT12 (SPM), FSLVBM, FSLANAT, sMRIPrep | Gray matter volume analysis [13] | Pipeline choice significantly affects results; CAT shows higher within-pipeline homogeneity |
| Spatial Transcriptomics | Visium HD, Xenium, MERFISH | Spatial gene expression correlation with imaging [14] | 55μm to subcellular resolution; bridges molecular and structural analysis |
| Motion Quantification | Voxel Volume Overlap (VVO) | Motion artifact assessment in fMRI [15] | Voxel-size sensitive motion metrics; superior to traditional displacement parameters |
Integration Guidelines for Drug Development Applications
The implementation of resolution-optimized imaging in pharmaceutical research requires strategic consideration of multiple factors:
Target Structure Dimensions: Match voxel volume to biological scale of interest, ensuring isotropic voxels do not exceed 5% of total structure volume for acceptable accuracy (Dice > 0.75) [10]. For small nuclei (<150mm³), this typically requires submillimeter isotropic resolution.
Longitudinal Sensitivity: Optimize SNR-resolution tradeoff for detection of subtle change over time. For vestibular schwannoma monitoring, high-resolution protocols (0.5 × 0.5 × 0.8 mm) significantly improve growth detection sensitivity compared to clinical standard acquisitions [9].
Multimodal Correlation: Integrate high-resolution MRI with emerging spatial transcriptomics technologies like Visium HD (55μm resolution) or Xenium (subcellular) to bridge imaging findings with molecular mechanisms in drug target validation [14].
Analytical Consistency: Standardize VBM processing pipelines across multi-site trials to minimize software-introduced variability, as pipeline differences can alter the anatomical localization of reported group differences [13].
Motion Management: Implement voxel-volume-overlap (VVO) metrics rather than traditional displacement parameters for motion quantification in high-resolution functional studies, as motion effects are highly dependent on voxel dimensions [15].
The comparative analysis of high-resolution versus standard MRI establishes that voxel volume and spatial resolution parameters fundamentally constrain biological interpretation across research and drug development applications. High-resolution approaches (0.5-0.8mm isotropic) at 7 Tesla provide unprecedented access to laminar architecture, microvascular dynamics, and small structure volumetry, enabling detection of subtle pathological changes and aging effects inaccessible to standard protocols. However, these advances require careful optimization of the SNR-resolution tradeoff and standardized analytical pipelines to ensure reproducible findings. For pharmaceutical researchers, the strategic selection of voxel parameters should be guided by target biology, required measurement precision, and integration with complementary spatial molecular technologies. As imaging continues to evolve toward mesoscopic scales, the precise definition of sampling volume remains foundational to accurate biomarker quantification and therapeutic efficacy assessment.
Magnetic resonance imaging (MRI) at high magnetic field strengths offers a powerful window into tissue microstructure and composition by leveraging intrinsic contrast mechanisms. Unlike methods relying on external contrast agents, techniques such as T1 mapping, T2* imaging, and quantitative susceptibility mapping (QSM) derive contrast from the inherent magnetic properties of biological tissues themselves [16] [17]. The strength of these signals is significantly enhanced at higher fields (e.g., 3 Tesla and above), providing improved signal-to-noise ratio (SNR) and contrast-to-noise ratio (CNR) crucial for resolving fine anatomical details [18] [17]. This guide objectively compares these core intrinsic contrast mechanisms, framing them within ongoing research on high-resolution MRI for superior tissue specificity, with particular relevance for neuroscience and drug development.
Core Principles of Intrinsic Contrast Mechanisms
Intrinsic MRI contrast originates from how tissue water protons interact with their local molecular environment following radiofrequency excitation in a magnetic field. The signal is governed by several key physical processes, each providing unique biological information.
- T1 (Longitudinal Relaxation): T1 relaxation time represents the rate at which protons recover their magnetization along the main magnetic field (B0) after excitation. It is sensitive to the presence of macromolecules like proteins and lipids, with myelin content being a primary determinant in the brain [19] [20].
- T2* (Effective Transverse Relaxation): T2* reflects the rate of signal decay due to a combination of static magnetic field inhomogeneities (spin-spin relaxation and local magnetic susceptibilities) and true T2 relaxation [19] [17]. It is particularly sensitive to paramagnetic substances such as iron stored in ferritin and deoxyhemoglobin in venous blood [19] [17].
- Magnetic Susceptibility (χ): Magnetic susceptibility is a fundamental property of a material that quantifies its degree of magnetization in response to an external magnetic field. In tissues, variations in susceptibility arise from differences in the concentration of diamagnetic (e.g., myelin, calcium) and paramagnetic (e.g., iron, deoxygenated blood) components [16] [17]. Quantitative Susceptibility Mapping (QSM) is a dedicated technique to map this property in three dimensions by solving an inverse problem from the magnetic field map derived from MRI phase images [16].
The following diagram illustrates the core principles and primary tissue sources of these three intrinsic contrast mechanisms.
Comparative Analysis of T1, T2*, and Magnetic Susceptibility
The following table provides a direct, data-driven comparison of the three intrinsic contrast mechanisms, summarizing their biophysical basis, primary applications, key advantages, and inherent limitations for tissue characterization.
Table 1: Comparative analysis of intrinsic MRI contrast mechanisms at high field
| Feature | T1 Mapping | T2* Mapping | Quantitative Susceptibility Mapping (QSM) |
|---|---|---|---|
| Biophysical Basis | Longitudinal recovery of proton magnetization; sensitive to interactions with macromolecules/lattice [20]. | Signal decay from spin-spin interactions & local magnetic field inhomogeneities [19]. | Quantifies tissue bulk magnetic susceptibility from magnetic field perturbations [16]. |
| Primary Tissue Sources | Myelin content, water-bound macromolecules [19]. | Tissue iron (ferritin), deoxygenated blood (deoxyhemoglobin) [19] [17]. | Paramagnetic iron (ferritin, hemosiderin), diamagnetic myelin & calcium [16] [17]. |
| Key Applications | Tissue segmentation (GM/WM/CSF), detection of cortical lesions, myelin quantification [19]. | Detection of cerebral microbleeds, venous vasculature imaging, BOLD fMRI [21] [19]. | Differentiating iron from myelin, quantifying iron deposition, mapping brain oxygen extraction [16] [17]. |
| Advantages at High Field | Improved SNR, better grey-white matter contrast [18]. | Stronger susceptibility effects, enhanced CNR for veins and iron [17]. | Increased contrast-to-noise, superior quantification of susceptibility sources [16] [17]. |
| Limitations/Challenges | Sensitive to RF transmit field (B1+) inhomogeneities [19]. | Sensitive to B0 inhomogeneity; signal loss in regions near air/tissue interfaces [21]. | Ill-posed inverse problem requiring sophisticated processing; streaking artifacts [16]. |
Experimental Protocols for Simultaneous Multi-Parametric Mapping
Advanced MRI sequences now enable the simultaneous acquisition of T1, T2*, and magnetic susceptibility maps within a single, time-efficient scan, ensuring perfect spatial co-registration of parameters. Below are detailed methodologies for two prominent approaches.
Multi-Echo MP2RAGE (ME-MP2RAGE)
The ME-MP2RAGE sequence combines the B1+-insensitive T1 mapping of the standard MP2RAGE sequence with a multi-echo readout to simultaneously capture T2* and susceptibility data [19].
Detailed Protocol [19]:
- Pulse Sequence: A magnetization-prepared rapid gradient-echo sequence featuring an adiabatic inversion pulse followed by two separate GRE readout blocks.
- Multi-Echo Readout: Each GRE block acquires multiple gradient echoes (e.g., 4-6 echoes) at different echo times (TEs) after a single radiofrequency excitation.
- Key Parameters (7T Example):
- Resolution: Up to 0.6 mm isotropic nominal resolution.
- Readout: Echo times (TEs) are distributed across the readout to adequately sample the T2* decay curve.
- Inversion Times: TI,1 and TI,2 are optimized for robust T1 fitting at the target field strength.
- Data Processing:
- T1 Map: Calculated from the two images acquired at inversion times TI,1 and TI,2 using the standard MP2RAGE signal model [19].
- T2* Map: Obtained by fitting the signal decay across the multiple echo times within each readout block to a mono-exponential decay model.
- Susceptibility Map (QSM): The phase data from the multi-echo readout is used to compute a field map, which is then processed using QSM algorithms (e.g., threshold-based k-space division or regularized inversion) to yield a quantitative susceptibility map [16] [19].
- Acquisition Time: Approximately 19 minutes for a whole-brain dataset at 7T [19].
MR Multitasking
The MR Multitasking framework provides an alternative method for simultaneous multi-parametric mapping by efficiently capturing data across multiple contrast dimensions.
Detailed Protocol [22]:
- Pulse Sequence: Utilizes hybrid T2-prepared inversion-recovery pulse modules combined with multi-echo GRE readouts.
- Data Structure: The underlying image is represented as a six-dimensional low-rank tensor, encompassing three spatial dimensions and three temporal dimensions corresponding to T1 recovery, T2 decay, and multi-echo T2* behavior.
- Key Parameters:
- Scan Time: A single 9.1-minute scan for whole-brain coverage.
- Outputs: Co-registered quantitative maps of T1, T2, T2*, and magnetic susceptibility.
- Data Processing: The high-dimensional data is reconstructed and then fitted using a dictionary-based or model-based approach to generate the final parametric maps.
- Validation: Phantom studies have shown substantial consistency with reference methods (R² > 0.98) [22].
The workflow for these simultaneous mapping techniques, from data acquisition to the generation of quantitative maps, is summarized below.
The Scientist's Toolkit: Essential Research Reagents and Materials
Successful implementation of high-field intrinsic contrast imaging requires both specific hardware and specialized software tools.
Table 2: Essential materials and tools for high-field intrinsic contrast research
| Item | Function & Importance |
|---|---|
| High-Field MRI Scanner (≥3T) | Provides the foundational high magnetic field necessary for enhanced SNR and CNR, making subtle susceptibility and relaxation contrasts detectable [18] [17]. |
| Multi-Channel RF Coils | Advanced coil arrays are critical for parallel imaging, which accelerates data acquisition and increases SNR, enabling high-resolution studies within feasible scan times. |
| Optimized Pulse Sequences | Prototype or product sequences like ME-MP2RAGE [19] and MR Multitasking [22] are essential for efficient, simultaneous multi-parametric data collection. |
| Gadolinium-Based Contrast Agents | Used in Dynamic Susceptibility Contrast (DSC) perfusion studies, which exploit T2* effects to measure cerebral blood volume and flow [23]. A preload is often used to minimize T1 leakage effects in tumor studies [23]. |
| Phantom Validation Kits | Materials with known relaxation times and magnetic susceptibilities are indispensable for validating the accuracy and quantifying the performance of mapping sequences [22] [19]. |
| QSM Reconstruction Software | Specialized software (e.g., MEDI, STAR-QSM) is required to solve the ill-posed inverse problem in QSM, involving steps like phase unwrapping, background field removal, and dipole inversion [16]. |
The intrinsic contrast mechanisms of T1, T2, and magnetic susceptibility provide a powerful, non-invasive toolkit for characterizing tissue microstructure at high magnetic field strengths. T1 mapping offers insights into myelin and macromolecular structure, T2 is sensitive to iron and blood oxygenation, and QSM allows for the precise quantification of tissue magnetic susceptibility, helping to disentangle the contributions of iron and myelin. While each mechanism has distinct strengths and limitations, the development of integrated sequences like ME-MP2RAGE and MR Multitasking enables the efficient acquisition of co-registered multi-parametric maps. This comprehensive quantitative approach is proving invaluable in both basic neuroscience research and the development of new therapeutic agents, providing robust imaging biomarkers for tissue characterization in health and disease.
The human brain functions through intricately organized neural circuits that operate at a scale finer than whole brain regions but larger than individual neurons. This intermediate level, known as the mesoscale, encompasses cortical layers, columns, and fine anatomic structures that form the fundamental processing units of cognition. For decades, the investigation of these structures in living humans remained largely inaccessible, trapped between the resolution limits of non-invasive macroscale imaging and the invasive nature of microscopic techniques. The mesoscale represents a critical gap in our understanding, as it is precisely at this level that functional specialization emerges through specific laminar and columnar architectures.
The development of ultra-high field Magnetic Resonance Imaging (MRI) systems, particularly 7 Tesla (7T) scanners and beyond, has begun to bridge this methodological divide. This comparison guide objectively examines the capabilities of current mesoscale imaging technologies, focusing specifically on how high-resolution MRI compares against standard resolution approaches in resolving cortical layers, columns, and fine anatomical structures. We present quantitative performance data, detailed experimental protocols, and analytical frameworks that enable researchers to select appropriate methodologies for investigating the brain's mesoscale organization, with significant implications for basic neuroscience and drug development programs targeting specific neural circuits.
Technical Specifications and Performance Comparison
Resolution and Hardware Capabilities
The pursuit of mesoscale imaging has driven innovations in MRI hardware to overcome the inherent signal-to-noise and spatial encoding limitations of conventional systems. The table below compares the key performance characteristics of a standard 7T system, a next-generation 7T system, and a 9.4T experimental system.
Table 1: Performance comparison of MRI systems for mesoscale imaging
| System Component | Standard 7T Scanner | Next-Gen 7T Scanner | 9.4T Experimental System |
|---|---|---|---|
| Maximum Gradient Strength | 80 mT/m | 200 mT/m | Not specified |
| Maximum Slew Rate | 200 T/m/s | 900 T/m/s | Not specified |
| Receiver Channels | 32-channel | 128-channel (96-ch Rx coil) | Not specified |
| Typical fMRI Resolution (Isotropic) | 0.8-1.0 mm | 0.35-0.45 mm | 0.35 mm (demonstrated) |
| Cortical SNR Improvement | Baseline | ~30% in cortex | High (specifics not provided) |
| Key Limitations | PNS limits, lower SNR in cortex | Acoustic noise, specialized design | Limited availability, technical challenges |
The next-generation 7T scanner exemplifies the hardware advances required for mesoscale imaging, featuring a head-only asymmetric gradient coil with an additional third layer of windings that enables dramatically improved performance—200 mT/m maximum gradient strength and 900 T/m/s slew rate compared to 80 mT/m and 200 T/m/s in standard 7T systems [4]. This enhanced gradient performance directly enables higher spatial resolution by permitting shorter echo spacing (0.58 ms at 0.6 mm isotropic versus 1.21 ms with standard gradients), which reduces T2* blurring and geometric distortion [4]. Furthermore, the increased channel count in receiver systems (up to 128 channels versus standard 32-channel arrays) with smaller coil elements (~4 cm diameter) significantly boosts signal in the cerebral cortex while reducing g-factor noise for accelerated acquisitions [4].
Functional and Structural Resolution Comparison
The improved hardware capabilities directly translate to enhanced performance in functional and structural imaging of mesoscale structures, as quantified in the table below.
Table 2: Mesoscale structure imaging capabilities comparison
| Imaging Target | Standard Resolution (3T/7T) | High Resolution (7T+) | Biological Reference |
|---|---|---|---|
| Ocular Dominance Columns (ODCs) | Not resolvable | Localized with 1 mm isotropic fMRI [24] | 0.7-1.0 mm width in humans |
| V2 Thin/Thick Stripes | Indirect inference only | Direct mapping at 0.8 mm isotropic [25] | 1.5-2.0 mm width in humans |
| Cortical Layers | Partial depth sampling | Full laminar profiling across all layers | 1.5-4.5 mm total thickness |
| Hippocampal Subfields | Limited by partial volume effects | Subfield differentiation possible [26] | <2 mm for most subfields |
| Functional Connectivity | Between regions | Between columns and layers [24] | Horizontal fibers span up to 8 mm |
The functional imaging advances are particularly notable. High-resolution fMRI at 7T can now resolve ocular dominance columns (ODCs) in human primary visual cortex using 1 mm isotropic resolution, demonstrating stronger functional connectivity between columns of similar ocular polarity—a finding consistent with anatomical studies in animals but previously unobservable in humans [24]. In the secondary visual cortex (V2), functional mapping of thin and thick stripes has been achieved using 0.8 mm isotropic resolution by exploiting their differential sensitivity to color and binocular disparity, respectively [25]. Quantitative MRI techniques applied at these resolutions can subsequently probe microstructural differences between these functional compartments, revealing lower longitudinal relaxation rates (R1) in thin and thick stripes compared to pale stripes—indicative of higher myelination in the latter [25].
Experimental Protocols for Mesoscale Imaging
Functional Mapping of Cortical Columns
The reliable identification of cortical columns requires specialized experimental paradigms that exploit known functional specializations. For ODC mapping, dichoptic stimulation protocols present different visual inputs to each eye separately [24]. The subsequent analysis employs an ocular dominance index (ODI) to quantify voxel-wise preference for one eye over the other. In resting-state paradigms, functional connectivity between voxels can be analyzed as a function of their ocular preference, revealing stronger correlations between similarly-tuned columns even over distances up to 35 mm—far exceeding the reach of single horizontal fibers [24].
For V2 stripe mapping, color-selective thin stripes are localized using isoluminant color stimuli compared to luminance-matched achromatic stimuli, while disparity-selective thick stripes are identified using stimuli with varying binocular disparity [25]. The resulting activation patterns show the characteristic stripe-like organization running perpendicular to the V1/V2 border, with center-to-center distances of approximately 4-8 mm in humans. The robustness of these functional maps can be confirmed through test-retest reliability across multiple scanning sessions [24].
Cortical Depth and Laminar Analysis
Mesoscale imaging necessitates specialized cortical sampling strategies to resolve depth-dependent organization. The cortical grid approach provides advantages over standard surface meshes for local applications by creating regular 2D grids directly in gray matter at specified spatial resolutions [27] [28]. This method better reflects local distances and angles when quantitatively analyzing functional data, as each vertex is surrounded by four neighbors at constant distances with 90-degree angles between edges—unlike the variable geometry of standard triangulated meshes [27].
Two primary approaches exist for defining cortical depth:
- Equidistant sampling: Places surfaces at equal distances between white matter and pial boundaries, preserving geometric distance but varying the volume of tissue represented at different depths [27] [28].
- Equi-volume sampling: Adjusts depth level spacing to preserve the volume of tissue represented within each surface, accounting for the changing surface area through the cortical ribbon [27] [28].
Current evidence suggests that equi-volume sampling yields a slight advantage over equidistant sampling given limitations in fMRI voxel size, participant motion, coregistration, and segmentation accuracy [27] [28]. This approach particularly improves the correspondence between functional activation profiles and underlying laminar anatomy.
Acquisition Sequences for High-Resolution fMRI
Achieving mesoscale resolution requires specialized acquisition sequences that balance spatial resolution, signal-to-noise ratio, and imaging speed. The 3D Echo Planar Time- and Dynamic-resolved Imaging (TIDY) sequence represents a recent advancement that addresses key challenges in high-resolution fMRI [29]. This approach leverages a multi-dimensional encoding design with time- and dynamic-resolved reconstruction to achieve distortion-free fMRI at ultra-high spatiotemporal resolutions, enabling whole-brain coverage at 500 μm isotropic resolution with 885 ms volume TR, or partial-brain imaging at 340 μm isotropic resolution [29].
For laminar fMRI, the choice of contrast mechanism is crucial. While traditional gradient-echo BOLD remains widely used, its sensitivity to large venous structures can introduce vascular biases. Recent simulations suggest that small voxel sizes (<0.8 mm) reduce extravascular dephasing from large veins in gradient-echo BOLD at 7T, potentially improving neuronal specificity [30]. Alternative approaches include VASO (Vascular Space Occupancy), which aims to suppress blood signal to enhance specificity to parenchymal tissue, though it suffers from lower SNR that can be mitigated with denoising techniques like NORDIC [30].
Table 3: Essential research reagents and resources for mesoscale imaging
| Resource Category | Specific Examples | Function/Application | Key Considerations |
|---|---|---|---|
| Ultra-High Field Scanners | 7T MRI with high-performance gradients; 9.4T experimental systems | Provide fundamental SNR and resolution for mesoscale studies | Gradient performance (strength, slew rate) determines practical resolution limits |
| Multi-Channel Receiver Coils | 64-channel head coils; 96-channel arrays | Increase SNR in cerebral cortex and enable parallel imaging acceleration | Smaller coil elements (~4cm) improve cortical signal [4] |
| Cortical Analysis Tools | FreeSurfer; CBS High-Res Brain Processing Tools | Surface reconstruction, cortical depth sampling, and alignment | Regular grid approaches advantageous for quantitative spatial analysis [27] |
| Pulse Sequences | 3D TIDY-EPI; Multi-echo GRE; VASO | Optimized acquisition for high-resolution fMRI | Balance resolution, distortion, and SNR; TIDY enables distortion-free sub-0.5mm imaging [29] |
| Quantitative MRI Protocols | Multi-parameter mapping (MPM); Quantitative Susceptibility Mapping (QSM) | Derive microstructural parameters (R1, R2*, MWF) related to myelin and iron | R1 values serve as myelin surrogate; can differentiate V2 stripe types [25] |
Data Analysis Frameworks and Computational Tools
Analytical Approaches for Columnar and Laminar Signals
The analysis of mesoscale fMRI data presents unique challenges that require specialized approaches. For laminar fMRI, layer-dependent regional homogeneity (ReHo) provides a model-free method for characterizing mesoscale functional structure across layers and columns without requiring predefined regions of interest [30]. This technique measures local, short-distance time course similarities across cortical depth, generating depth-dependent similarity matrices that can quantify laminar separability in high-resolution fMRI data [30].
The analysis of functional connectivity between cortical columns requires careful consideration of distance effects and ocular preference. Studies of ODC connectivity typically bin vertex pairs by distance and compare functional correlation strength between those with alike versus unalike ocular polarity [24]. A consistent finding shows that while functional connectivity decreases with distance, the selectivity for similarly-tuned columns persists across relatively long distances (up to 35 mm) without significant interaction between distance and selectivity effects [24].
Validation Approaches and Multi-Modal Correlation
A critical challenge in mesoscale imaging is the validation of inferred neural features against ground truth histological methods. The CLARITY tissue clearing technique provides one validation pathway by enabling 3D mapping of fluorescently labeled neurofilaments and vasculature throughout intact tissue samples [31]. Comparisons between diffusion MRI fiber orientation estimates and CLARITY neurofilament orientations in human thalamic samples show mean angular differences of approximately 19°±15°, supporting the validity of dMRI for mesoscale structural mapping [31]. This multi-modal validation approach is particularly valuable for establishing the biological specificity of MRI-based mesoscale measurements.
For hippocampal subfield imaging, methodological considerations become particularly important due to the small size of these structures. While anatomical segmentation based on cytoarchitectonic probabilistic atlases is widely used, current imaging resolution at 3T makes it difficult to avoid partial volume effects for layers less than 2 mm thick [26]. Alternative functional segmentation approaches based on the anterior-posterior axis of the hippocampus may better reflect the structure's functional and molecular heterogeneity, though this remains an area of active methodological development [26].
The quest for mesoscale imaging has transformed from a technological aspiration to an achievable scientific enterprise with the advent of ultra-high field MRI systems and specialized acquisition methodologies. The performance comparisons presented in this guide demonstrate that next-generation 7T scanners with high-performance gradients and multi-channel receiver arrays now provide sufficient resolution and signal-to-noise ratio to resolve cortical layers, columns, and fine anatomical structures that were previously accessible only through invasive methods in animal models or post-mortem human tissue.
The implications for research and drug development are substantial. Mesoscale imaging enables the in vivo investigation of circuit-level pathologies in neurological and psychiatric disorders, potentially identifying novel biomarkers and treatment targets. The ability to track laminar-specific activity patterns may illuminate pathological information flow in conditions such as schizophrenia, while columnar-level functional connectivity mapping could reveal circuit disruptions in autism spectrum disorders. As these technologies continue to evolve, with even higher field systems (10.5T, 11.7T) under development and increasingly sophisticated analysis tools emerging, the mesoscale frontier in human neuroscience is poised to yield transformative insights into brain organization in health and disease.
Hardware Innovations and Imaging Techniques Powering Specificity in Research and Clinical Trials
Advancements in magnetic resonance imaging (MRI) are fundamentally reshaping neuroscience and drug development research by enabling the visualization of the human brain at an unprecedented scale. Traditional fMRI studies typically operate at spatial resolutions around 3.0 mm isotropic, sufficient for mapping broad functional territories but inadequate for deciphering the brain's fine-grained mesoscale circuitry—the level of cortical layers and columns that form the essential architecture of neural computation [4]. To bridge this gap, researchers require a significant leap in spatial resolution, down to 0.3–0.6 mm, which demands a comprehensive re-engineering of MRI hardware, particularly the gradient coils responsible for spatial encoding [4]. This guide objectively compares a key innovation in this domain—asymmetric head gradient coils—against standard alternatives, providing researchers with the experimental data and methodological context needed to evaluate their potential for high-resolution tissue specificity research.
Hardware Showdown: Quantitative Performance Comparison
Gradient Coil Performance Specifications
Next-generation asymmetric head gradient coils represent a radical departure from conventional whole-body and symmetric head coil designs. Unlike symmetric coils, which place the region of interest (ROI) at the geometric center, asymmetric coils shift the ROI toward one end (e.g., the patient end) to better accommodate the human head and shoulders while maximizing performance within limited space [32]. This configuration, often featuring novel designs like connected primary and shielding layers at one end, allows for more efficient wire patterns, improved cooling system access, and superior electromagnetic performance [33] [32].
The following table summarizes the performance characteristics of key gradient coil designs, highlighting the transformative potential of asymmetric head coils.
Table 1: Performance Comparison of MRI Gradient Coils
| Gradient Coil Model / Type | Maximum Strength (Gmax in mT/m) | Maximum Slew Rate (SR in T/m/s) | Key Application / Distinguishing Feature |
|---|---|---|---|
| Standard Whole-Body (SC72) [4] | 80 | 200 | Clinical whole-body imaging; baseline for comparison |
| Head-Only Asymmetric (AC84) [4] | 80 | 400 | Early high-performance head imaging |
| NexGen 'Impulse' Asymmetric Head Coil [4] | 200 | 900 | Ultra-high-resolution human brain imaging (0.35-0.45 mm) |
| NeuroFrontier Proposed Head Coil [34] | 650 | 600 | Ultra-high-gradient neuroimaging; highest reported Gmax |
| Typical Head Gradient Benefit [35] | Higher than whole-body | Higher than whole-body | Reduced PNS limitations, enabling faster switching |
Imaging Performance and Outcomes
The performance gains translate directly into superior imaging capabilities. The core advantage lies in the ability to generate stronger magnetic field gradients (Gmax) and switch them more rapidly (slew rate). This directly enhances the spatial and temporal encoding processes at the heart of MRI.
Table 2: Experimental Imaging Outcomes with High-Performance Gradients
| Performance Metric | Standard Whole-Body Gradient (SC72) | Next-Gen Asymmetric Head Gradient ('Impulse') |
|---|---|---|
| Achievable Isotropic Resolution (EPI) [4] | 0.7 mm | 0.45 mm |
| Echo Spacing (EPI at 0.5 mm) [4] | 1.41 ms | 0.68 ms |
| Minimum TE (EPI at 0.5 mm) [4] | ~45 ms (∼40% signal loss) | ~23 ms (minimal signal loss) |
| Point Spread Function (PSF) [4] | Larger blurring at high resolution | Smaller blurring, maintains integrity up to ~0.5 mm |
| Geometric Distortion [4] | Higher due to longer echo spacing | Reduced due to shorter echo spacing |
| g-factor Noise Penalty [4] | Higher with 32-channel array | Lower with 64-/96-channel arrays, enabling higher acceleration |
Experimental Deep Dive: Methodology and Protocols
Characterizing Peripheral Nerve Stimulation (PNS) Thresholds
A critical physiological constraint of high-performance gradients is PNS, which causes involuntary muscle twitches and can limit usable performance. Experimental protocols are essential to safely map these thresholds.
Objective: To empirically determine the PNS thresholds for each gradient axis (X, Y, Z) of a high-performance head coil and investigate the impact of subject position and variability [36].
Methodology:
- Participants: Studies typically involve 20-30 healthy adult volunteers under approved ethical guidelines [36].
- Stimulation Sequence: A train of 128 alternating bipolar trapezoidal pulses (mimicking an EPI readout) is played for each gradient axis separately. The rise time (τ) is varied (e.g., 0.1, 0.22, 0.3, 0.5 ms) while the gradient amplitude is progressively increased until the subject first reports a sensation [36].
- Threshold Definition: The PNS threshold is identified as the lowest gradient amplitude (in mT/m) that elicits a sensation for a given rise time.
- Positioning Variants: The process is repeated with the subject's head positioned at isocenter and then moved in steps (e.g., 2 cm, 4 cm) toward the feet to assess sensitivity to position [36].
Key Findings:
- PNS thresholds can be axis-dependent; for the 'Impulse' coil, the X-axis threshold was significantly lower than predicted by initial models [36].
- Thresholds are sensitive to head position within the coil; the X-axis threshold increased by approximately 20 mT/m per centimeter moved toward the foot end [36].
- Significant inter-subject variability exists, influenced by factors such as age, underscoring the need for robust safety models that incorporate experimental data [36].
The experimental workflow for PNS characterization and its integration into coil design is systematic and multi-staged, as shown below.
Evaluating Ultra-High-Resolution Functional and Diffusion Imaging
The primary application of these coils is pushing the boundaries of resolution in fMRI and diffusion MRI (dMRI).
Objective: To demonstrate the feasibility and advantages of sub-millimeter and sub-0.5 mm isotropic resolution imaging for neuroscience applications [4] [34].
Protocol for High-Resolution fMRI:
- Pulse Sequence: Multi-band or single-shot Echo-Planar Imaging (EPI).
- Spatial Resolution: Acquisition of data at resolutions ranging from 0.8 mm down to 0.35 mm isotropic [4].
- Performance Leverage: The high slew rate of the 'Impulse' coil is used to minimize the echo spacing (ES) and echo time (TE), thereby reducing T2* signal decay and geometric distortion. This enables shorter echo train lengths and less image blurring (a narrower Point Spread Function) [4].
- Outcome Analysis: Visualization of layer-specific functional activity and columnar organization, which is otherwise obscured by partial volume effects at standard resolutions.
Protocol for High-Angular Resolution dMRI:
- Pulse Sequence: Diffusion-weighted EPI or advanced sequences like oscillating gradient spin echo [34].
- Performance Leverage: The very high Gmax (e.g., 200-650 mT/m) enables the application of strong diffusion-sensitizing gradients. This permits the use of very high b-values (e.g., >3000 s/mm²) for better sensitivity to restricted diffusion and short diffusion times for probing smaller cellular structures [34].
- Outcome Analysis: Improved estimation of white matter tract integrity and cortical microstructure, providing enhanced contrast for lesions and more accurate metrics for neurite density and orientation dispersion [34].
Table 3: Key Research Reagent Solutions for Ultra-High-Field Neuroimaging
| Tool / Resource | Function & Relevance to High-Resolution Research |
|---|---|
| High-Performance Head Gradient Coil (e.g., 'Impulse', 'NeuroFrontier') | Core hardware providing Gmax > 200 mT/m and SR > 600 T/m/s for sub-millimeter spatial encoding and reduced TE [4] [34]. |
| Ultra-High-Density RF Receiver Array (e.g., 64-, 96-, 128-channel) | Boosts signal-to-noise ratio (SNR) in the cerebral cortex and reduces g-factor noise, enabling parallel imaging acceleration to compensate for high-resolution's intrinsic SNR penalty [4]. |
| Multi-Channel RF Transmit System (e.g., 8- or 16-channel) | Improves B1+ field uniformity at ultra-high fields (7T and above), crucial for obtaining homogeneous images across the entire brain at high resolution [4]. |
| AI-Empowered Reconstruction & CS | Artificial Intelligence and Compressed Sensing algorithms enable drastic acceleration of acquisitions by reconstructing high-quality images from highly undersampled data, mitigating the long scan times associated with high-resolution protocols [34]. |
| Optical Motion Tracking System | Provides prospective motion correction in real-time. This is essential for sub-millimeter imaging, where even micron-scale head movements can introduce severe artifacts and obscure subtle biological signals [34]. |
Discussion: Implications for Tissue Specificity and Therapeutic Development
The integration of asymmetric head gradient coils into modern MRI systems marks a pivotal shift from macroscopic to mesoscopic brain mapping. For neuroscientists and drug development professionals, this enhanced resolution directly translates to improved tissue specificity. Researchers can now begin to dissect unique functional or structural profiles within individual cortical layers, which are known to have distinct genetic expression, connectivity, and roles in information processing [4]. In neurodegenerative diseases like Alzheimer's, where pathology may originate in specific layers, or in psychiatry, where circuit-based therapeutics are emerging, this granularity is invaluable.
Furthermore, the ability of ultra-strong gradients to probe tissue microstructure with dMRI provides a non-invasive window into cellular-level changes. For drug developers, this offers a potential biomarker for treatment efficacy, sensitive to alterations in neurite density, axon diameter, or cellularity that precede gross volumetric changes detectable on standard scanners [34]. The relationship between hardware capability and biological insight is a positive feedback loop, driving discovery and therapeutic innovation.
While challenges remain—including managing physiological limits like PNS, acoustic noise, and the high costs associated with these advanced systems—the trajectory is clear. The ongoing innovation in asymmetric and PNS-optimized coil designs, coupled with AI-driven acquisition and analysis, is firmly establishing ultra-high-resolution MRI as an indispensable tool for unlocking the secrets of the human brain and accelerating the pace of therapeutic discovery.
Functional magnetic resonance imaging (fMRI) has become the mainstay of human imaging in neuroscience, yet typical studies utilizing isotropic spatial resolution on the order of 3.0 mm (27 μl voxel volume) lack the granularity to explore neural circuits at the scale of cerebral columns and cortical layers [4]. With human cortex thickness varying between 1.5 and 4.5 mm and cortical columnar features being 0.6–1.0 mm, advancing resolution to the mesoscale (0.3–0.6 mm) is essential to adequately sample cortical layers and columns while minimizing partial volume averaging of surrounding tissues [4]. This resolution leap requires substantial improvements in the signal-to-noise ratio (SNR), which can be achieved through higher magnetic field strengths and advanced radiofrequency (RF) hardware, particularly high-density receiver array coils [4] [37].
Over years, improvements to major MRI scanner system components have led to higher SNR and higher resolution imaging, but such hardware advancements were often developed in isolation [4]. The integration of ultra-high field systems (≥7 Tesla) with dedicated high-performance hardware creates a synergistic effect, pushing the boundaries of what is achievable in human neuroimaging [4]. This review comprehensively examines the role of high-density receiver array coils in advancing cortical imaging, providing objective performance comparisons with experimental data, and situating these technological advances within the broader context of high-resolution MRI research.
Fundamental Principles of High-Density Array Coils
Physical Basis of Signal Reception in MRI
The signal-to-noise ratio (SNR) represents the fundamental metric for image quality in magnetic resonance imaging. SNR improvements enable either higher spatial resolution through smaller voxel sizes, faster acquisition times, or improved contrast-to-noise ratio for functional studies. The principle underlying surface coil technology is that coil sensitivity is highly dependent on proximity to the tissue of interest – the closer a coil element is placed to tissue, the better its SNR performance [37]. This relationship explains why standard volume coils (e.g., birdcage coils), while providing relatively uniform sensitivity, cannot match the peak SNR achievable with surface coils placed directly adjacent to the cortex.
High-density array coils capitalize on this principle by utilizing multiple small coil elements arranged in conformal patterns around the head. Each small coil element offers high sensitivity to nearby tissues but with a limited penetration depth. By combining signals from numerous such elements, it becomes possible to achieve both high SNR in cortical regions and comprehensive brain coverage [4]. The penetration depth of surface coils is roughly equivalent to their diameter, meaning that reducing coil diameter increases SNR close to the surface at the cost of decreased sensitivity in deeper tissues [38]. However, this limitation can be mitigated by increasing the number of receive elements, creating a dense array that maintains high surface SNR while preserving adequate sensitivity at depth through the composite image formed from all channels [38].
Technical Evolution from Single Channel to Multi-Channel Arrays
The progression from single-channel surface coils to modern high-density arrays represents one of the most significant advancements in MRI hardware. Early array coils with just 4 irregularly shaped receivers demonstrated the potential of this approach, showing SNR improvements of 1-1.5 times in central brain areas and 2-3 times in cortical regions compared to volume coils [37]. This foundational work established that array coils could dramatically increase quality and resolution over large brain volumes while maintaining compatibility with standard neuroimaging configurations.
Modern high-density arrays have expanded this concept dramatically, with channel counts growing from 4 to 32, 64, 96, and now 128 channels [4] [39]. This progression has been enabled by advances in coil decoupling techniques, preamplifier design, and digital receiver systems capable of processing numerous parallel channels. Each technological iteration has brought reductions in individual coil element size, with optimal loop diameters of approximately 4 cm at 7T for maximizing cortical signal [4]. The development of self-decoupled coil designs, including recent toroidal configurations, further facilitates dense packing by eliminating traditional decoupling limitations [40].
Performance Comparison: High-Density Arrays vs. Standard Alternatives
Quantitative SNR and g-Factor Analysis
Table 1: Performance Comparison of Different Receiver Array Coils at 7 Tesla
| Array Configuration | Cortical SNR Improvement | g-Factor Performance | Acceleration Capability | Key Applications |
|---|---|---|---|---|
| 32-channel (standard) | Reference level | Higher noise penalty | Moderate acceleration | General neuroimaging |
| 64-channel array | ~30% improvement [4] | Reduced g-factor [4] | R = 4-5 [4] | High-resolution fMRI |
| 96-channel array | ~30% improvement [4] | Superior g-factor [4] | R = 5-8 [4] | Laminar fMRI, diffusion imaging |
| 72-channel Connectome | 1.4x higher SNR [39] | Improved g-factor [39] | High acceleration for diffusion | Connectomics, high-b-value DWI |
| Dedicated cerebellar array | 2-3x surface SNR [38] | Significant g-factor gains [38] | Accelerated cerebellar imaging | Cerebellar fMRI, cognitive studies |
The performance advantages of high-density arrays are quantifiable across multiple metrics. Compared to standard 32-channel arrays, 64-channel and 96-channel configurations demonstrate approximately 30% higher SNR in cortical regions [4]. This improvement is not uniform throughout the brain but is particularly pronounced in peripheral regions adjacent to the coil elements. The center of the coil array does not show significantly higher SNR for higher channel count arrays, highlighting the importance of targeted coil design for cortical applications [4].
Beyond raw SNR improvements, high-density arrays excel in parallel imaging performance, characterized by the g-factor, which represents the noise amplification resulting from accelerated acquisition. Arrays with higher channel counts and reduced coil loop sizes consistently demonstrate lower g-factor penalties, enabling higher acceleration factors (R) without prohibitive SNR loss [4]. This capability is particularly valuable for high-resolution EPI sequences used in fMRI, where shorter echo trains reduce T2* blurring and geometric distortions [4].
Specialized Array Configurations for Targeted Imaging
Table 2: Specialized High-Density Array Configurations and Applications
| Array Type | Configuration | Target Region | Performance Advantages |
|---|---|---|---|
| Asymmetric head array | 96-ch Rx, 16-ch Tx [4] | Whole-brain cortex | Improved image uniformity, reduced power deposition |
| Cerebellar array | 3Tx/32Rx [38] | Cerebellum and brainstem | Improved B1+ and SNR at cerebellar surface |
| Flexible supplemental coil | Elliptical flex coil [41] | Frontal and subcortical | Recovers signal in half-volume coil configurations |
| Connectome array | 72-ch with field monitoring [39] | Whole-brain connectomics | Enables high-b-value diffusion with field correction |
| Implantable coils | Single-loop or figure-8 [42] | Preclinical deep structures | 100-500% SNR increase over surface arrays |
Not all imaging applications require whole-brain coverage, and targeted high-density arrays can provide optimized performance for specific neuroanatomical regions. For cerebellar imaging – particularly challenging due to its location at the brain's base and small structural features – dedicated arrays combining 3-channel transmit with 32-channel receive elements have demonstrated substantial improvements in B1+ transmit efficiency and SNR [38]. These specialized arrays address the specific challenges of ultra-high field imaging in the cerebellum, where traditional volume coils produce signal cancellation.
Similarly, flexible array designs enable novel configurations that balance SNR with practical experimental requirements. When front-face clearance is needed for visual stimulation devices or virtual reality systems, a half-volume head coil supplemented with a forehead flex coil can recover the SNR losses in frontal and subcortical regions that would otherwise occur with a posterior-only array [41]. This configuration maintains the ability to detect task-related fMRI signals in regions critical for emotional decision-making and perception, such as the amygdala [41].
Experimental Protocols and Methodologies
Bench-Level Characterization of Array Performance
Comprehensive evaluation of high-density array coils begins with RF bench-level metrics before progressing to imaging experiments. Standard characterization includes measurements of quality factor (Q), tuning, matching, and inter-element coupling [39]. The quality factor represents the efficiency of energy storage in the coil relative to energy loss, with higher Q factors generally indicating better coil performance. Proper tuning ensures the coil resonates at the Larmor frequency of the scanner (e.g., 298 MHz for 7T), while matching optimizes power transfer between the coil and the transmission line.
Inter-element coupling measurements are particularly critical for high-density arrays, as electromagnetic interactions between adjacent coil elements can degrade performance. Contemporary arrays minimize coupling through overlap optimization, low-input-impedance preamplifiers, and in some designs, common-mode suppression techniques [39]. The effectiveness of decoupling is quantified through scattering (S)-parameter measurements, with S12 values below -15 dB generally indicating sufficient isolation between elements. Additional bench tests include evaluation of active detuning circuits, which must effectively decouple receive elements during the transmit phase to prevent perturbation of the B1+ field and ensure patient safety.
In Vivo Imaging Protocols for Performance Validation
Following bench characterization, array performance is validated through a series of in vivo imaging experiments designed to quantify SNR, parallel imaging capability, and ultimate image quality. Standard protocols include:
SNR Mapping: Multiple techniques exist for SNR quantification, including the multiple replica method (repeated identical acquisitions) and difference method (subtraction of two acquisitions) [39]. These measurements are performed throughout the brain to characterize the spatial distribution of signal sensitivity, with particular attention to cortical regions.
Parallel Imaging Evaluation: The acceleration capability of arrays is quantified through g-factor mapping, typically performed by comparing fully sampled reference data with retrospectively or prospectively accelerated acquisitions [4] [39]. This evaluation includes both in-plane (e.g., SENSE, GRAPPA) and through-plane (e.g., multiband) acceleration techniques, with contemporary high-density arrays supporting combined acceleration factors of R=8 or higher with acceptable g-factor penalties [4].
Functional and Structural Imaging: Ultimate validation comes from high-resolution fMRI and structural imaging protocols. For fMRI, the critical metric is temporal SNR (tSNR), which incorporates both thermal noise and physiological fluctuations [38]. High-density arrays consistently demonstrate tSNR improvements in cortical regions, directly translating to enhanced detection sensitivity for BOLD activation [38]. For structural imaging, qualitative assessment of cortical architecture visualization provides compelling evidence of improved spatial resolution, with some studies demonstrating clear visualization of the stria of Gennari in visual cortex [37].
Integration with Complementary Technologies
Synergy with High-Performance Gradient Systems
The benefits of high-density receiver arrays are magnified when combined with advanced gradient systems. Next-generation MRI scanners designed for ultra-high-resolution human brain imaging incorporate asymmetric head-only gradient coils capable of reaching 200 mT/m amplitude and 900 T/m/s slew rates [4]. These performance characteristics represent approximately five-fold improvement over standard whole-body gradient systems [4].
The synergy between high-performance gradients and dense arrays is particularly evident in echo-planar imaging (EPI), the workhorse sequence for fMRI. The Impulse gradient coil achieves shorter echo spacing (0.58 ms at 0.6 mm resolution versus 1.21 ms with body gradients), resulting in reduced T2* blurring and geometric distortion [4]. When combined with the acceleration capabilities of high-density arrays, this enables high-resolution EPI with minimal distortion, crucial for layer-specific fMRI where precise spatial localization is paramount.
Field Monitoring and Correction Systems
Advanced diffusion imaging with strong diffusion-sensitizing gradients presents particular challenges due to nonlinear spatiotemporal magnetic field disturbances. The integration of field monitoring systems directly into high-density array coils addresses this limitation by enabling real-time measurement and correction of field perturbations [39]. These systems typically employ 16-channel field monitoring arrays based on NMR field cameras that concurrently measure magnetic field dynamics during image acquisition [39].
The combination of high-density receiver arrays with integrated field monitoring creates a powerful platform for high-resolution diffusion imaging, substantially reducing geometric distortions, blurring, and ghosting in high-b-value DWI [39]. This integration has proven particularly valuable for Connectome-style scanners, where the goal is mapping brain microstructure with sub-millimeter isotropic resolution throughout the entire brain [39].
The Researcher's Toolkit: Essential Technologies
Table 3: Research Reagent Solutions for High-Density Array Experiments
| Technology Category | Specific Solutions | Function and Application |
|---|---|---|
| High-channel-count arrays | 64-ch, 96-ch, 128-ch head arrays [4] | Boost cortical SNR and enable parallel imaging acceleration |
| Dedicated transmit arrays | 8-ch, 16-ch transmit systems [4] [38] | Improve B1+ uniformity and reduce SAR at ultra-high field |
| Flexible coil elements | Elliptical flex coils, stretchable arrays [42] [41] | Provide conformal placement and patient-specific optimization |
| Cryogenic coil technology | Liquid nitrogen-cooled arrays [42] | Reduce electronic noise for ~3x SNR improvement |
| Field monitoring systems | 16-ch field camera integration [39] | Correct spatiotemporal field perturbations during diffusion encoding |
| Decoupling technologies | High-impedance preamps, self-decoupled designs [40] | Minimize inter-element coupling in dense arrays |
| Modular coil systems | Wearable modular designs, "piecing coils together" [40] | Enable customizable anatomical coverage and flexible configurations |
Research Applications and Functional Outcomes
Laminar and Columnar Resolution fMRI
The primary application driving the development of high-density array coils is high-resolution fMRI at the scale of cortical layers and columns. Conventional fMRI at 3.0 mm isotropic resolution cannot resolve these mesoscopic features, limiting investigations to coarse-scale functional localization. With the combination of ultra-high fields (7T and above) and high-density arrays, researchers can now routinely achieve 0.35–0.45 mm isotropic spatial resolution, sufficient to discriminate the six neuronal layers of human cerebral cortex [4].
This resolution advancement enables entirely new research domains in human neuroscience, including direct investigation of cortical processing hierarchies through layer-specific activation patterns and mapping of functional columnar organization in sensory cortices. The improved spatial specificity also enhances the biological interpretability of fMRI findings by reducing partial volume effects between gray matter, white matter, and cerebrospinal fluid [4].
High-Angular Resolution Diffusion Imaging
Beyond functional applications, high-density arrays significantly advance diffusion MRI for mapping structural connectivity. The enhanced SNR facilitates high-angular-resolution diffusion imaging (HARDI) with stronger diffusion weighting (higher b-values), improving the resolution of crossing fibers in white matter pathways [4]. When combined with the acceleration capabilities of parallel imaging, these arrays enable comprehensive diffusion spectrum imaging (DSI) within practical acquisition times [39].
For Connectome-style projects, specialized high-density arrays with integrated field monitoring have proven particularly valuable, enabling high-b-value diffusion imaging (>30,000 s/mm²) with sub-millimeter isotropic resolution [39]. These technical capabilities provide unprecedented insights into human brain connectivity and tissue microstructure, supporting investigations into both normal brain organization and pathological alterations in neurological and psychiatric disorders.
Technological Roadmap and Future Directions
Emerging Trends in Array Technology
The field of high-density array development continues to evolve rapidly, with several emerging trends shaping future systems. Wireless coil technology represents a significant innovation, with recent prototypes demonstrating microwave links for data transmission, potentially streamlining patient setup and improving comfort [40]. Similarly, modular wearable coil designs enable flexible, patient-specific arrays that can be "pieced together" without geometric adjustment or complex decoupling electronics [40].
Integration of artificial intelligence into coil design and optimization processes is another promising direction. Recent work has demonstrated fully automatic pipelines for designing receive coils that approach the ultimate intrinsic signal-to-noise ratio, potentially accelerating the development of optimized array configurations for specific anatomical regions or applications [40]. These AI-driven approaches may overcome traditional design limitations and yield novel coil geometries with enhanced performance characteristics.
Translation to Preclinical and Specialized Applications
While this review has focused primarily on human neuroimaging, parallel advancements are occurring in preclinical MRI systems. High-density arrays for animal models exhibit similar benefits, with specialized designs including stretchable receive coils showing 40% increases in SNR and expanded coverage [42]. More radically, implantable radiofrequency coils provide extraordinary SNR gains of 100-500% over surface arrays, though these require surgical implantation and may induce tissue damage or susceptibility artifacts [42].
Beyond neuroscience, specialized high-density arrays are being developed for various clinical applications, including prostate imaging with flexible body arrays, intraoral coils for dental MRI, and multi-layer designs optimized for knee imaging and sodium spectroscopy [40]. Each application presents unique challenges requiring tailored solutions, but all benefit from the fundamental advantages of dense array technology: improved SNR, accelerated acquisition, and enhanced spatial resolution.
High-density receiver array coils represent a transformative technology in the quest for mesoscale human brain imaging. Through objective performance comparison, we have demonstrated that arrays with elevated channel counts (64-96 channels) provide approximately 30% higher SNR in cortical regions and superior parallel imaging performance compared to standard 32-channel configurations [4]. These technical advantages directly translate to improved functional imaging sensitivity, enabling resolution of cortical layers and columns previously inaccessible to non-invasive human neuroimaging.
When integrated with complementary technologies including high-performance gradient systems and field monitoring arrays, high-density receiver coils form part of a comprehensive approach to pushing spatial resolution boundaries in MRI. The continued innovation in array design – including flexible, wireless, and modular configurations – promises to further expand applications while improving patient comfort and experimental flexibility. For researchers pursuing high-resolution investigations of brain function and structure, investment in advanced RF systems featuring high-density arrays remains essential for maintaining competitive capabilities at the frontiers of human neuroscience.
Synergy of Technologies for Cortical Imaging
Functional and molecular magnetic resonance imaging (MRI) techniques have revolutionized the non-invasive investigation of biological processes, enabling researchers and clinicians to probe both physiology and pathology in living organisms. Blood Oxygen Level-Dependent functional MRI (BOLD fMRI), Diffusion-Weighted Imaging (DWI), and Dynamic Contrast-Enhanced MRI (DCE-MRI) represent three cornerstone methodologies in this domain, each providing unique and complementary insights into tissue structure, function, and microenvironment. This guide provides a comprehensive comparative analysis of these imaging modalities, focusing on their performance characteristics, experimental requirements, and applications within the context of high-resolution MRI research aimed at enhancing tissue specificity.
The pursuit of greater spatial specificity drives innovation in functional neuroimaging. While BOLD fMRI has become a neuroscience workhorse, its reliance on neurovascular coupling means the signal reflects macrovascular changes that are not strictly confined to areas of increased neural activity, thus limiting spatial precision [43]. This fundamental limitation has motivated the development and refinement of alternative and complementary techniques like DWI and DCE-MRI, which offer different pathways to investigating tissue microstructure and vascular function with potentially superior localization of pathological and physiological events.
Technical Principles and Physiological Basis
BOLD fMRI (Blood Oxygen Level-Dependent Functional MRI)
The BOLD effect originates from the different magnetic properties of hemoglobin. Oxyhemoglobin is diamagnetic, while deoxyhemoglobin is paramagnetic. During neuronal activation, a localized increase in cerebral blood flow outweighs the increase in oxygen consumption, leading to a relative decrease in deoxyhemoglobin concentration in venules and capillary beds. This reduction in paramagnetic content decreases magnetic susceptibility differences, increasing T2* and causing a signal increase on T2-weighted images [43]. The BOLD signal is an indirect measure of neuronal activity, mediated by neurovascular coupling, and is most often acquired using T2-weighted Gradient Echo (GE) Echo-Planar Imaging (EPI) sequences [44].
DWI (Diffusion-Weighted Imaging) and DTI (Diffusion Tensor Imaging)
DWI measures the random Brownian motion (diffusion) of water molecules within biological tissues. The degree of water diffusion is influenced by cellular density, membrane integrity, and microstructure. The apparent diffusion coefficient (ADC) is a quantitative measure of this diffusivity. In highly cellular environments like malignant tumors, water movement is restricted, appearing as high signal on DWI and low signal on ADC maps [45]. Diffusion Tensor Imaging (DTI), an extension of DWI, models diffusion as a three-dimensional ellipsoid, enabling the visualization of white matter tract orientation and integrity through metrics like fractional anisotropy (FA) [46]. Newer non-Gaussian models, such as fractional diffusion representation, introduce parameters like the spatial fractional exponent (γ), which shows sensitivity to local magnetic susceptibility and diffusion multi-compartmentalization, offering potential for enhanced specificity in functional experiments [43].
DCE-MRI (Dynamic Contrast-Enhanced MRI)
DCE-MRI involves the rapid, sequential acquisition of T1-weighted images before, during, and after the intravenous administration of a gadolinium-based contrast agent. As the contrast agent passes through the tissue vasculature and leaks into the extravascular extracellular space (EES) in areas of altered vascular permeability, it causes a shortening of T1 relaxation time, leading to increased signal intensity. Analysis of the signal-time curves can be performed using semi-quantitative parameters (e.g., time-to-peak, initial area under the curve) or via pharmacokinetic modeling to derive quantitative parameters such as Ktrans (volume transfer constant), ve (extravascular extracellular volume fraction), and vp (blood plasma volume) [47]. These parameters provide insights into tissue perfusion and microvascular permeability.
Table 1: Fundamental Principles and Key Metrics of Imaging Modalities
| Imaging Modality | Primary Physiological Basis | Key Quantitative Metrics | Primary Contrast Mechanism |
|---|---|---|---|
| BOLD fMRI | Neurovascular coupling, changes in blood oxygenation | BOLD signal change (%), tSNR (temporal SNR), fCNR (functional CNR) [44] | T2* changes from deoxyhemoglobin concentration |
| DWI | Brownian motion of water molecules | ADC (Apparent Diffusion Coefficient), Kurtosis, γ (fractional exponent) [43] [45] | Signal attenuation from restricted diffusion |
| DCE-MRI | Tissue perfusion & vascular permeability | Ktrans, ve, vp, Fp (Plasma Flow), PS (Permeability-Surface Area) [47] | T1 shortening from Gadolinium contrast agent |
Comparative Performance and Applications
Diagnostic Performance in Oncology
The differential strengths of BOLD fMRI, DWI, and DCE-MRI are prominently displayed in oncologic imaging. DCE-MRI excels in lesion characterization, particularly in breast cancer, where kinetic curve analysis (persistent, plateau, washout) provides critical diagnostic information. One study reported a diagnostic AUC of 0.89 for DCE-MRI, with 98% sensitivity and 81% specificity in differentiating benign from malignant breast masses [48]. DWI complements this by reflecting tissue cellularity; malignant lesions often show restricted diffusion with significantly lower ADC values than benign tissues [45]. While BOLD fMRI is less used for primary cancer diagnosis, it is invaluable for mapping functional areas adjacent to tumors in presurgical planning [46].
Functional and Microstructural Interrogation in Neuroscience
A key limitation of BOLD fMRI is its limited spatial specificity, as the signal reflects macrovascular changes that can be displaced from the actual site of neural activity [43]. This has motivated the use of DW-fMRI to detect microstructural changes associated with neuronal activation, such as cell swelling. Advanced diffusion models like fractional diffusion representation show promise, with the parameter γ providing complementary information to conventional BOLD and demonstrating higher sensitivity and specificity in task-based activation of the human visual cortex [43]. DTI is the standard for non-invasively mapping white matter integrity and structural connectivity in the brain [46].
Technical and Practical Considerations
Each modality presents unique technical demands. Preclinical BOLD fMRI, for instance, requires high magnetic fields (≥7T) and high-performance gradients to achieve the high spatial and temporal resolution needed to map the weak hemodynamic response [44]. High-temporal-resolution DCE-MRI (e.g., 1.695 s/dynamic) is crucial for reliable parameter estimation in pharmacokinetic models like the Two-Compartment Uptake (2CU) model, which can differentiate prostate cancer from healthy tissue based on parameters like plasma flow (Fp) [47]. DWI sequences are technically simpler but can be confounded by artifacts from large susceptibility variations.
Table 2: Comparative Analysis of Technical Requirements and Clinical/Research Utility
| Aspect | BOLD fMRI | DWI | DCE-MRI |
|---|---|---|---|
| Key Clinical/Research Utility | Mapping brain function, functional connectivity | Assessing cellularity, characterizing strokes, tracing white matter tracts (DTI) | Characterizing tumor angiogenesis, monitoring treatment response |
| Spatial Specificity | Limited (macrovascular contribution) [43] | High (links to tissue microstructure) [43] [45] | High (microvascular level) [47] |
| Key Technical Challenge | Achieving high fCNR at high resolution; mitigating physiological noise [44] | Overcoming distortion artifacts; modeling non-Gaussian diffusion [43] | High temporal resolution for accurate modeling; arterial input function determination [47] |
| Preclinical Hardware Needs | Ultrahigh fields (≥7T), cryogenic coils, dedicated animal cradles [44] | High gradient strengths for high b-values | Fast gradient systems for high temporal resolution |
| Safety & Limitations | Non-invasive, no ionizing radiation | Non-invasive, no contrast agent | Requires gadolinium contrast (risk of NSF) |
Experimental Protocols and Methodologies
Preclinical BOLD fMRI Protocol
Optimizing a preclinical BOLD fMRI study requires careful consideration of hardware and acquisition parameters. Recommendations based on current advanced practices include [44]:
- Magnetic Field Strength: Use ultrahigh fields (e.g., 9.4T, 11.7T, or higher) for a supra-linear increase in functional contrast-to-noise ratio (fCNR).
- Gradient System: Employ high-performance gradients with strengths of 400-1000 mT/m and high slew rates (>1000 T/m/s) to enable rapid EPI acquisitions.
- Radiofrequency (RF) Coils: Utilize multi-channel phased-array coils or cryogenically cooled coils to maximize signal-to-noise ratio (SNR) and tSNR. Implantable coils can offer further SNR gains but require surgery.
- Animal Preparation: Use a dedicated MRI cradle with precise head fixation (e.g., tooth and ear bars) to minimize motion. Anesthesia (e.g., isoflurane, medetomidine) is standard, but awake imaging setups are possible with habituation.
- EPI Sequence Optimization: Key parameters include:
- Spatial Resolution: Isotropic voxels of 100-500 µm, depending on the species and brain region.
- Temporal Resolution: Sufficiently fast (e.g., TR = 1-2 s) to adequately sample the hemodynamic response function.
- Other Parameters: Use partial Fourier and parallel imaging to reduce echo time (TE) and EPI echo spacing, thereby minimizing geometric distortions and signal loss.
High-Resolution DWI for Functional Microstructure Interrogation
To probe microstructural changes during neural activation, a DW-fMRI protocol can be implemented as follows [43]:
- Scanner: A 3T clinical scanner or higher.
- Diffusion Encoding: Use bipolar diffusion gradients or a double spin-echo EPI sequence to minimize confounding effects from internal magnetic field gradients (Gi).
- b-values: Acquire data with multiple b-values, including high b-values up to 3000 s/mm², to probe non-Gaussian diffusion.
- Modeling: Employ the fractional diffusion representation to estimate the spatial fractional exponent γ, which is sensitive to cellular morphology changes and magnetic susceptibility variations.
- Experimental Design: Interleave DWI acquisitions with a block or event-related task paradigm (e.g., visual stimulation).
Ultrafast DCE-MRI for Prostate Cancer Characterization
A protocol for high-temporal-resolution DCE-MRI to derive quantitative parameters for prostate cancer assessment includes [47]:
- Scanner: 3T MR scanner.
- Sequence: 3D gradient echo sequence (e.g., DISCO) optimized for ultrafast acquisition.
- Temporal Resolution: ≤ 2 seconds per dynamic (e.g., 1.695 s) for at least the first two minutes post-contrast to accurately capture first-pass kinetics.
- Contrast Agent: Gadolinium-based agent (0.1 mmol/kg) injected at 3 mL/s via a power injector.
- Analysis:
- Pharmacokinetic Modeling: Fit the 2CU model to derive parameters like plasma flow (Fp), permeability-surface area product (PS), and plasma mean transit time (MTTp).
- Empirical Mathematical Model (EMM): Alternatively, fit data to sigmoidal or exponential EMMs to extract descriptive parameters like enhancement rate and time-to-peak.
The Scientist's Toolkit: Essential Research Reagents and Materials
Table 3: Key Reagents and Equipment for Advanced Functional and Molecular MRI
| Item Name/ Category | Function / Purpose | Specific Examples / Notes |
|---|---|---|
| Ultrahigh-Field Preclinical Scanner | Provides high baseline SNR and enhanced BOLD contrast for fCNR [44] | 7T, 9.4T, 11.7T, or 18.0 Tesla systems with wide, homogeneous bores |
| High-Performance Gradient System | Enables high spatial resolution and fast EPI/DWI acquisitions; reduces distortion [44] | Gradient strengths: 400-1000 mT/m; Slew rates: 1000-9000 T/m/s |
| Cryogenic RF Coils | Increases SNR by reducing electronic noise through cooling [44] | Liquid nitrogen or cryogenic helium-cooled array coils |
| Dedicated Animal Cradle & Monitoring | Ensures animal welfare, stable physiology, and minimal motion during scanning [44] | Integrated systems for anesthesia delivery, respiratory monitoring, and temperature control |
| Gadolinium-Based Contrast Agent | Shortens T1 relaxation time, creating signal enhancement in DCE-MRI for perfusion/permeability analysis [47] | Dotarem (Gadoterate Meglumine); dose: 0.1 mmol/kg |
| Power Injector | Ensures consistent, sharp bolus profile for reliable DCE-MRI pharmacokinetic modeling [47] | Injection rate typically 2-4 mL/s, followed by saline flush |
| Fractional Diffusion Modeling Software | Analyzes non-Gaussian diffusion data to extract novel biomarkers like fractional exponent (γ) [43] | Custom or commercial software implementing Continuous-Time Random Walk (CTRW) models |
Visualizing Experimental Workflows and Physiological Mechanisms
BOLD fMRI and Fractional DW-fMRI Experimental Pipeline
The following diagram illustrates the integrated workflow for conducting a functional MRI study that combines conventional BOLD and advanced fractional diffusion imaging.
DCE-MRI Physiological Basis and Kinetic Modeling
This diagram outlines the underlying physiology captured by DCE-MRI and the corresponding mathematical modeling process.
BOLD fMRI, DWI, and DCE-MRI constitute a powerful trio of non-invasive imaging techniques, each contributing distinct and vital information about tissue physiology and pathology. BOLD fMRI remains the primary method for mapping brain function, DWI is unparalleled in assessing tissue microstructure and cellularity, and DCE-MRI provides unique insights into vascular permeability and perfusion. The ongoing evolution of these modalities, particularly through the adoption of ultrahigh fields, advanced biophysical models, and high-temporal-resolution acquisition, is steadily overcoming their traditional limitations. The integration of these techniques, combined with emerging approaches like fractional diffusion imaging, promises a future where in vivo imaging can delineate functional and pathological processes with ever-greater spatial specificity and biological accuracy, thereby accelerating both neuroscientific discovery and pharmaceutical development.
While high-resolution proton (¹H) MRI excels at depicting anatomical structure, a new frontier in molecular imaging is unlocked by moving beyond protons to nuclei like sodium (²³Na) and phosphorus (³¹P). This shift is central to the ongoing research thesis comparing high-resolution anatomical imaging with standard-resolution methods that offer superior tissue specificity by probing metabolism and cellular energetics directly. For researchers and drug development professionals, multinuclear MRI provides a non-invasive window into real-time metabolic processes, offering biomarkers for disease diagnosis, treatment response, and therapeutic development that are invisible to conventional MRI.
Table 1: Key Nuclei in Metabolic MRI and Their Biological Significance
| Nucleus | Gyromagnetic Ratio (MHz/T) | Key Metabolic Probes | Primary Biological Significance | Representative Diseases Studied |
|---|---|---|---|---|
| Hydrogen (¹H) | 42.58 | NAA, Choline, Creatine, Lactate | Anatomical structure, cellular markers [49] | Tumors, Multiple Sclerosis, Stroke [50] |
| Sodium (²³Na) | 11.26 | Tissue Sodium Concentration (TSC) | Cellular viability, integrity, and ion homeostasis [51] | Stroke, Lymphatic Disease, Tumors, Neurodegeneration [52] [51] |
| Phosphorus (³¹P) | 17.25 | ATP, PCr, Pi, PMEs, PDEs | Energy metabolism (ATP), phospholipid cell membrane turnover [51] | Tumors, Muscular Disorders, Neurodegenerative Diseases [51] |
| Carbon (¹³C) | 10.71 | [1-¹³C]Pyruvate, [1-¹³C]Lactate, [1-¹³C]Bicarbonate | Real-time glycolytic and oxidative metabolism (via hyperpolarization) [49] [53] | Cancer, Traumatic Brain Injury, Metabolic Diseases [49] [53] |
Direct Metabolic Interrogation with Sodium and Phosphorus MRI
Sodium (²³Na) MRI: A Biomarker of Tissue Viability and Inflammation
Sodium MRI shifts the focus from anatomy to cellular integrity. While conventional MRI struggles to distinguish between different causes of tissue swelling, sodium MRI provides a direct measure of tissue sodium content, a key indicator of cellular health and inflammation.
- Clinical Application – Lymphatic Disease: Researchers at Vanderbilt University Institute of Imaging Science (VUIIS) use 3T sodium MRI to study lipedema and lymphedema. Their work has shown that these patients retain significant salt in adipose tissue, a finding that objectively distinguishes their condition from common obesity [52]. This non-invasive measurement of tissue sodium can also monitor therapy efficacy, as studies have demonstrated visible sodium mobilization following compression therapy [52].
- Experimental Protocol: A typical sodium MRI exam can be integrated into a clinical workflow. At VUIIS, a dedicated sodium radiofrequency coil is used. Sodium and proton imaging protocols are combined into a single ExamCard, allowing technologists to run the multi-nuclei exam without specialized training. To overcome sodium's inherently low signal-to-noise ratio, ultra-short echo time (UTE) imaging techniques are employed [52].
Phosphorus (³¹P) MRSI: Mapping Energetic and Phospholipid Metabolism
Phosphorus MR Spectroscopic Imaging (MRSI) provides a direct window into cellular energy metabolism and membrane synthesis by measuring concentrations of key phosphorus-containing metabolites.
- Clinical Application – Tumor Metabolism: ³¹P-MRSI is highly sensitive to the energy status and phospholipid metabolism of tissues. It can detect alterations in adenosine triphosphate (ATP), phosphocreatine (PCr), and inorganic phosphate (Pi), which are often dysregulated in tumors. Furthermore, the levels of phosphomonoesters (PMEs) and phosphodiesters (PDEs), involved in cell membrane turnover, can serve as early biomarkers of therapy response in cancer [51].
- Experimental Protocol: A cutting-edge protocol for comprehensive metabolic characterization involves the interleaved acquisition of ³¹P-MRSI and ²³Na-MRI. A 2025 study at 7 Tesla demonstrated the feasibility of this approach. The sequence interleaves a 3D radial ²³Na-MRI scan with a ³¹P free-induction decay MRSI acquisition within a single repetition time (TR). This method efficiently captures complementary metabolic data—sodium for cell integrity and phosphorus for energy status—within a single scan session, while adhering to specific absorption rate (SAR) limits [51].
Hyperpolarized ¹³C MRI: Real-Time Metabolic Flux Imaging
A revolutionary advancement in multinuclear MRI is the use of hyperpolarization (HP), which can boost the signal of certain nuclei by >10,000-fold. This allows for the real-time tracking of metabolic substrates as they are converted into products within the body.
- Clinical Application – Traumatic Brain Injury (TBI) and Oncology: HP [1-¹³C]pyruvate MRI is a powerful tool for assessing real-time enzyme activity. After injection, the conversion of hyperpolarized [1-¹³C]pyruvate to [1-¹³C]lactate (via lactate dehydrogenase, LDH) and [1-¹³C]bicarbonate (via pyruvate dehydrogenase, PDH) is monitored. A 2024 study on a porcine mild TBI model found significantly increased lactate-to-pyruvate ratios in the injured brain region at 2 hours and 2 days post-injury, revealing a shift toward anaerobic glycolysis that was not detectable by other methods [53]. Similarly, in oncology, this technique can map glycolytic flux in tumors, a hallmark of cancer metabolism [49].
- Experimental Protocol: The protocol involves the dissolution dynamic nuclear polarization (DNP) process to hyperpolarize a [1-¹³C]pyruvate substrate. The hyperpolarized solution is rapidly injected intravenously into the subject (animal or human). Immediately following injection, a rapid ¹³C spectroscopic imaging sequence is executed to dynamically track the conversion of pyruvate to lactate and bicarbonate in the target organ [53].
Technical Considerations and the Research Toolkit
Adopting multinuclear imaging requires specific hardware, software, and methodological considerations beyond standard proton MRI.
Key Research Reagent Solutions
| Item | Function in Multinuclear Research |
|---|---|
| Multi-Nuclei RF Coils | Dedicated radiofrequency coils tuned to the specific Larmor frequency of nuclei like ²³Na and ³¹P are essential for transmission and signal reception [52] [51]. |
| Hyperpolarizer System | A dynamic nuclear polarization (DNP) instrument is required to achieve the massive signal enhancement needed for hyperpolarized ¹³C studies [49] [53]. |
| Multi-Nuclei ExamCard/Sequence | Pulse sequences must be configured for non-proton nuclei, often employing UTE for sodium and spectroscopic imaging for phosphorus [52]. Software enabling interleaved acquisition is also key [51]. |
| X-Nuclei Contrast Phantoms | Phantoms with known concentrations of target nuclei (e.g., sodium chloride solutions) are critical for calibrating systems and quantifying in vivo results [54]. |
Methodological and Hardware Workflows
The following diagram illustrates the core workflow for a hyperpolarized carbon-13 experiment, from sample preparation to metabolic imaging.
Implementing these techniques requires specific hardware configurations. The diagram below outlines two common setups for acquiring multinuclear data.
Metabolic Pathways in Multinuclear MRI
The power of multinuclear MRI lies in its ability to interrogate specific metabolic pathways. The following diagram maps the key pathways accessible with these technologies.
Multinuclear MRI represents a paradigm shift from purely anatomical imaging to functional, metabolic characterization. While high-resolution proton MRI remains the gold standard for depicting structure, techniques like sodium MRI, phosphorus MRSI, and hyperpolarized ¹³C MRI provide unparalleled tissue specificity for probing cellular energetics, viability, and real-time metabolic flux. For researchers and drug developers, these tools offer critical biomarkers for understanding disease mechanisms, stratifying patients, and objectively evaluating novel therapies targeting metabolism, thereby bridging a crucial gap between molecular biology and clinical application.
Imaging biomarkers have become indispensable tools in central nervous system (CNS) drug development, providing non-invasive methods to visualize anatomic specificity, physiology, and drug activity in ways not possible with other biomarker approaches [55]. These biomarkers address significant challenges in therapeutic development for neurological and psychiatric disorders, where heterogeneity in clinical phenomenology, variable progression rates, and difficulty identifying presymptomatic individuals have historically impeded success [56]. The U.S. Food and Drug Administration has recognized the importance of improving drug development efficiency through biomarkers, deeming them a top priority in its Critical Path Initiative [55].
The roles of imaging biomarkers in clinical trials are varied and critical for establishing therapeutic efficacy. They provide objective, quantifiable measures for demonstrating target engagement, aiding dose selection determinations, establishing proof-of-concept, enriching patient cohorts, confirming diagnoses, monitoring disease progression, and even serving as efficacy endpoints [55] [56]. As drug development increasingly focuses on early intervention in disease processes—particularly for neurodegenerative disorders like Alzheimer's and Parkinson's disease—imaging biomarkers offer the unique capability to identify pathological changes during presymptomatic stages when treatments may be most effective [57] [56].
Classification and Applications of Imaging Biomarkers
Imaging biomarkers derive from multiple platforms, including magnetic resonance imaging (MRI), positron emission tomography (PET), single photon emission computed tomography (SPECT), and computerized tomography, each offering distinct advantages for specific applications in the drug development pipeline [55]. These biomarkers can be categorized into three primary applications along the drug development continuum: (1) fit-for-purpose biomarkers for internal decision-making in early-phase development; (2) qualified biomarkers for specific contexts of use; and (3) regulatory-accepted endpoints that serve as surrogates for clinical outcomes [55].
Table 1: Categories of Imaging Biomarkers in Drug Development
| Category | Primary Applications | Regulatory Status | Examples |
|---|---|---|---|
| Fit-for-Purpose Biomarkers | Target engagement, dose selection, proof-of-concept, internal decision-making | Used for internal decisions | Gadolinium-enhanced T1-lesions in multiple sclerosis [55] |
| Qualified Biomarkers | Patient enrichment, specific contextual uses | Regulatory qualification for specific context | Hippocampal volume in Alzheimer's disease [55] |
| Regulatory-Accepted Endpoints | Surrogate endpoints for clinical outcomes | Regulatory acceptance as endpoint | Total kidney volume in polycystic kidney disease [55] |
Table 2: Disease-Specific Applications of Imaging Biomarkers
| Disease Area | Biomarker/Technology | Application in Drug Development | Impact |
|---|---|---|---|
| Alzheimer's Disease | Amyloid and tau PET [56], Hippocampal volume/MRI [55] | Patient stratification, efficacy assessment, target engagement | Clinical trial patient stratification for predementia stages [55] |
| Multiple Sclerosis | Gd-enhanced T1- and T2-lesions/MRI [55] | Proof of concept | De-risking pivotal studies [55] |
| Parkinson's Disease | Dopamine transporter (DAT) SPECT [55] | Patient enrichment | Reducing sample size by excluding non-progressing subjects [55] |
| Polycystic Kidney Disease | Total kidney volume/MRI [55] | Patient enrichment, efficacy | Reducing sample size and shortening study duration [55] |
Technical Comparison of Imaging Modalities
Magnetic Resonance Imaging (MRI) Platforms
MRI provides exceptional soft tissue contrast without ionizing radiation, making it ideal for repeated measures in longitudinal clinical trials [58]. Different field strengths offer distinct advantages for various applications in drug development:
Ultra-High Field MRI (7T and above) enables increased spatial resolution and sensitivity for detecting subtle pathological changes. The enhanced signal-to-noise ratio at higher field strengths permits visualization of cortical layer determination, subtle vascular structures, and neurotransmitter metabolism that are not feasible at lower field strengths [58]. These systems are particularly valuable for early assessment of neurological disorders including neurodegeneration, multiple sclerosis, and epilepsy [58].
High-Resolution MRI (HRMRI) at standard field strengths (3T) has emerged as a powerful technique for evaluating cerebrovascular disease through direct assessment of vessel walls and cerebral arterial disease [59]. HRMRI can identify stroke mechanisms, determine the extent and pathology of stenosis, and recognize plaque characteristics not visible through conventional imaging methods [59]. This technology enables quantitative measurement of plaque volume and composition, particularly for identifying vulnerable plaques with high-risk features such as lipid-rich necrotic cores, intraplaque hemorrhage, and thin fibrous caps [59].
Nuclear Medicine Imaging: PET and SPECT
PET and SPECT imaging offer unparalleled sensitivity for measuring molecular targets and pathways, playing different roles in multicenter clinical treatment trials for neurodegenerative disorders [56]. The development of protein-specific radiotracers for pathological proteins such as beta-amyloid and tau in Alzheimer's disease has transformed clinical trial design and implementation [56].
The process for developing these molecular imaging biomarkers mirrors pharmaceutical development, progressing through four distinct stages: (1) discovery of promising chemical structures with high affinity and selectivity for the target; (2) assessment of radiotracer properties including brain penetration, metabolic stability, and signal-to-noise ratio; (3) validation through kinetic modeling and reproducibility testing; and (4) application in clinical research trials with established distribution networks and standardized acquisition protocols [56].
Comparative Technical Specifications
Table 3: Technical Comparison of Imaging Modalities for Biomarker Applications
| Parameter | MRI | High-Resolution MRI | PET/SPECT |
|---|---|---|---|
| Spatial Resolution | ~1-2 mm (3T) [58] | Submillimeter for vessel wall [59] | ~4-8 mm [56] |
| Molecular Sensitivity | Micromolar to millimolar (MRS) [58] | Limited | Nanomolar to picomolar [56] |
| Primary Applications | Structural integrity, functional connectivity, perfusion [60] [58] | Plaque characterization, vessel wall imaging [59] | Target engagement, protein pathology [56] |
| Key Advantages | No ionizing radiation, multi-parametric capability [58] | Non-invasive plaque component analysis [59] | High molecular sensitivity, quantitative capability [56] |
Methodological Protocols for Key Applications
Multicenter Standardization for Functional Connectivity Biomarkers
Development of reliable functional connectivity biomarkers requires specialized methodologies to address challenges in multicenter settings. Recent research has revealed hierarchical variations in individual functional connectivity, with variability attributed to multiple factors including within-subject across-run variations (median magnitude: 0.138), individual differences (median: 0.107), disease effects, inter-scanner discrepancies (median: 0.026), and protocol differences (median: 0.016) [60].
Advanced computational methods employing ensemble sparse classifiers can effectively prioritize disease effects through three distinct mechanisms: (1) optimal selection of functional connections; (2) weighted summation of selected connections; and (3) ensemble averaging [60]. This approach can improve the signal-to-noise ratio (disorder effect/participant-related variabilities) by nearly 15-fold, rendering functional connectivity biomarkers practical for clinical applications [60].
MRI Intensity Standardization Protocol
Intensity standardization represents a critical preprocessing step for multicenter MRI studies where scanner-dependent intensity variations can confound analysis. The STandardization of Intensities (STI) technique provides superior performance compared to conventional histogram-matching approaches by incorporating tissue spatial intensity information [61].
The STI protocol involves:
- Preprocessing: Nonlocal means noise removal, intensity inhomogeneity correction, linear and nonlinear registration to standard image space [61]
- Intensity Clamping: Setting values below the 0.01 percentile to zero and above the 99.99 percentile to 100, with linear interpolation between limits [61]
- Joint Histogram Analysis: Using spatial correspondence from nonlinear registration to compute joint intensity histograms between standard and input images [61]
- Transfer Function Computation: Determining intensity correspondence in each tissue type between input and standard images [61]
This method has demonstrated significantly better intensity matching for brain white matter compared to histogram-matching techniques in large multicentric datasets including the Alzheimer's Disease Neuroimaging Initiative (ADNI) [61].
High-Resolution Vessel Wall Imaging Protocol
HRMRI protocols for atherosclerotic plaque characterization utilize multiple contrast weightings to differentiate plaque components [59]:
- 3D Time-of-Flight (TOF) MRA: Provides high-resolution images of cerebral vasculature without contrast agents using flow-related enhancement of blood [59]
- Multi-Contrast Weighted Imaging: T1-weighted imaging (T1WI), T2-weighted imaging (T2WI), contrast-enhanced T1-weighted imaging (CE-T1WI), and proton density-weighted imaging (PDWI) provide complementary information for tissue characterization [59]
- Plaque Component Analysis: Different plaque components demonstrate characteristic signal patterns across sequences enabling identification of lipid cores (isointense on TOF, isointense/hyperintense on T1WI, hypointense on T2WI), fibrous caps (enhancement on CE-T1WI), and intraplaque hemorrhage (temporal evolution of signal characteristics) [59]
Experimental Data and Validation
Performance Metrics for Biomarker Applications
Imaging biomarkers have demonstrated significant impacts on clinical trial efficiency across multiple disease areas. In Alzheimer's disease trials, amyloid PET has seen rapid growth in implementation, with the number of publications utilizing this biomarker increasing substantially from 2010 through 2021 [56]. Analysis of clinicaltrials.gov data reveals that amyloid-targeted PET represents the primary imaging biomarker in completed trials, while tau and other targets constitute a larger component of recruiting projects, indicating an evolving spectrum of imaging targets in clinical development [56].
For peripheral nerve pathologies, comparative studies have demonstrated sensitivity of 94% for ultrasound versus 78% for MRI in detecting peripheral nerve lesions, with ultrasound showing superior capability in identifying multifocal neural pathologies [62]. This performance advantage is particularly notable for small lesions (1-2 cm), where ultrasound detected lesions in 22% of patients that were not identified using MRI [62].
Multicenter Validation Studies
Large-scale multicenter studies have provided critical validation for imaging biomarker implementation. The Alzheimer's Disease Neuroimaging Initiative (ADNI), a public-private partnership involving over 50 sites, has established standardized protocols for MRI and PET acquisition and analysis that have supported numerous therapeutic trials [61]. Similarly, traveling-subject studies involving 84 participants across 29 sites have quantified the relative contributions of different variability sources to functional connectivity measures, informing standardization approaches for multicenter trials [60].
Integration Pathways and Logical Frameworks
Imaging Biomarker Development and Application Workflow
Essential Research Reagent Solutions
Table 4: Key Research Reagents for Imaging Biomarker Applications
| Reagent Category | Specific Examples | Primary Applications | Mechanism/Function |
|---|---|---|---|
| Paramagnetic Contrast Agents | Gadolinium-based complexes (Gd-DTPA, Gd-DOTA) [63] | Contrast-enhanced MRI, perfusion imaging | Shorten T1 relaxation time, increasing signal intensity on T1-weighted images [63] |
| Superparamagnetic Contrast Agents | Ferumoxides (SPIO), Ferumoxtran (USPIO) [63] | Liver lesion detection, molecular imaging | Shorten T2 relaxation time, decreasing signal intensity on T2-weighted images [63] |
| Molecular Tracers for PET | Amyloid tracers (florbetapir, flutemetamol), Tau tracers (flortaucipir) [56] | Target engagement, protein pathology quantification | High-affinity binding to specific protein aggregates enabling quantification of disease burden [56] |
| Calcium-Sensitive MRI Agents | Manganese (Mn2+), BAPTA-based gadolinium complexes [64] | Functional brain imaging, neuronal activity mapping | Calcium mimetic properties or calcium-dependent relaxivity changes for mapping brain activation [64] |
| Genetically-Encoded Contrast Agents | Ferritin, engineered transferrin receptors [64] | Gene expression tracking, cellular imaging | Iron storage proteins or engineered receptors that accumulate iron for contrast enhancement [64] |
Imaging biomarkers have transformed CNS drug development by providing objective, quantifiable measures of pathophysiology that overcome limitations of traditional clinical assessments. The integration of these biomarkers into clinical trials supports target validation, dose optimization, patient stratification, and treatment response monitoring [55] [56]. As therapeutic development increasingly focuses on early disease stages and premanifest populations, imaging biomarkers will play an even more critical role in identifying appropriate candidates for intervention and demonstrating disease-modifying effects.
Future developments will likely focus on multimodal integration of complementary imaging techniques, enhanced standardization for multicenter studies, and creation of increasingly specific molecular probes for novel therapeutic targets [60] [56] [58]. The continued qualification of imaging biomarkers for specific contexts of use through regulatory pathways will further solidify their role in precision medicine approaches to CNS drug development [55] [56]. As these technologies evolve, they promise to enhance the efficiency of therapeutic development and ultimately improve outcomes for patients with neurological and psychiatric disorders.
Overcoming Technical Hurdles: Artifacts, Standardization, and Accelerated Acquisition
The pursuit of higher spatial and temporal resolution in magnetic resonance imaging (MRI) is fundamentally constrained by three intertwined physical challenges: Peripheral Nerve Stimulation (PNS), significant acoustic noise, and eddy currents. These phenomena present a critical trade-off; the advanced gradient systems required for high-resolution imaging, particularly in neuroscientific and drug development research, also intensify these effects, potentially limiting clinical applicability and compromising data quality [65] [36] [66]. This guide provides an objective comparison of how these challenges manifest across different MRI system performance levels, detailing the experimental methodologies used for their quantification and the mitigation strategies employed in contemporary scanner design. Understanding these trade-offs is essential for researchers selecting appropriate systems for high-resolution versus standard-resolution studies aimed at elucidating tissue-specific contrasts in disease models.
Performance Comparison of MRI System Challenges
The table below summarizes the characteristics and impacts of PNS, acoustic noise, and eddy currents across different performance tiers of MRI systems, from standard clinical to ultra-high-performance head-only gradients.
Table 1: Performance Comparison of Key Physical Challenges in MRI Systems
| Challenge | Standard/Whole-Body Systems (e.g., ~50 mT/m, 200 T/m/s) | High-Performance Head Gradient Systems (e.g., MAGNUS, Impulse) | Experimental & Modeling Data |
|---|---|---|---|
| Peripheral Nerve Stimulation (PNS) | Lower threshold, broader body exposure [67]. PNS limits are a primary constraint for fast imaging sequences like Echo-Planar Imaging (EPI) [68]. | Higher threshold (2-3 fold), but stimulation localized to head/shoulders [36] [67]. Modern head coils (e.g., 200 mT/m, 900 T/m/s) still experience PNS as a limiting factor, sometimes at levels lower than predicted by models [36]. | Thresholds: Vary by coil axis and subject position (e.g., ~20 mT/m/cm Z-offset measured for one x-axis coil) [36].Model Accuracy: Discrepancies exist; one study found measured x-axis thresholds "significantly below" model predictions [36]. |
| Acoustic Noise | Intense sound pressure, typically 110-130 dB for sequences like EPI. 3T systems are generally noisier than 1.5T systems [69]. | Can be exacerbated by higher slew rates. One ultra-high-performance system required RF coil shield modifications to reduce noise by 10 dB [36]. | Safety Limits: OSHA recommends <115 dB for 15 min exposure; IEC requires ear protection to reduce levels below 99 dB [69].Physiological Impact: Can cause temporary or permanent hearing threshold shifts and induce parasympathetic nervous system activity [70] [69]. |
| Eddy Currents | Induced in scanner conductors and patient, causing image artifacts (shearing, shading, ghosting), Bo field shifts, and Joule heating [66]. | Problematic in short-TE sequences, EPI, and diffusion-weighted imaging, leading to geometric distortions and spuriously high ADC values [66]. | Mitigation Strategies: Active gradient shielding, pre-emphasis of input currents, and image post-processing correction [66]. |
Experimental Protocols for Characterization and Analysis
Quantifying Peripheral Nerve Stimulation (PNS) Thresholds
The determination of PNS thresholds is critical for establishing safe operational limits for gradient systems, particularly ultra-high-performance coils.
- Volunteer Stimulation Studies: The established protocol involves playing a train of bipolar trapezoidal pulses (e.g., 128 pulses mimicking an EPI readout) on each gradient axis separately [36]. The gradient amplitude is progressively increased in steps (e.g., 20 mT/m coarse, then 2 mT/m refinements) until volunteers first report a sensation, defined as the PNS threshold. The pulse rise time (τ) is varied (e.g., 0.1 ms to 0.5 ms) to characterize the strength-duration relationship [36]. Factors such as subject position, age, and sex are recorded, as thresholds are known to be sensitive to these variables [36] [71].
- Computational PNS Prediction Workflow: To incorporate PNS considerations directly into the coil design phase, a sophisticated simulation framework is used [65] [68]. The workflow integrates several components:
- Electromagnetic Simulation: The electric field (E-field) induced in a detailed, heterogeneous human body model by a candidate gradient coil design is computed using a quasi-static solver [68] [67].
- Nerve Atlas Integration: The simulated E-fields are superimposed on a comprehensive atlas of peripheral nerve fibers embedded within the body model [68].
- Neurodynamic Modeling: The induced E-field along each nerve segment is used as an input to a neurodynamic model (e.g., a modified McIntyre-Richardson-Grill model) to determine the minimum gradient amplitude required to initiate an action potential in that nerve [71] [68]. The lowest threshold among all nerves defines the overall PNS threshold for the coil design.
This computational approach allows for the optimization of coil windings to minimize PNS propensity before physical prototypes are built [65].
Measuring Acoustic Noise and Physiological Effects
Characterizing the auditory and autonomic impacts of MRI acoustic noise is essential for patient safety and comfort.
- Acoustic Noise Measurement: Sound pressure levels are measured using calibrated microphones inside the scanner bore during the operation of various pulse sequences, following standards such as those from the National Electrical Manufacturers Association (NEMA) [69]. The root-mean-square (RMS) sound pressure level is reported in A-weighted decibels (dBA) to account for human hearing sensitivity.
- Assessment of Autonomic Nervous System Activity: The physiological impact of noise can be quantified by measuring heart rate variability (HRV) [70]. In one experimental protocol, electrocardiogram (EKG) recordings are taken from healthy subjects under three conditions: silence, exposure to white noise, and exposure to recorded fMRI acoustic noise. HRV metrics are then extracted from the R-R intervals, with specific indices used to represent parasympathetic (PNS) and sympathetic (SNS) nervous system activity. Studies have shown that rhythmic fMRI noise can significantly enhance parasympathetic activity compared to silence or white noise [70].
Analyzing Eddy Current-Induced Artifacts
Eddy currents are primarily assessed through their impact on image quality.
- Imaging Phantoms and Volunteers: The effects of eddy currents are evaluated using standardized imaging protocols known to be sensitive to them, such as echo-planar imaging (EPI), diffusion-weighted imaging (DWI), and MR spectroscopy [66]. Characteristic artifacts analyzed include the Nyquist N/2 ghost, image shearing, scaling, shading, and spatial misregistration. In DWI, eddy currents can cause inaccurate calculation of apparent diffusion coefficient (ADC) values [66].
- Field Camera Validation: Tools like magnetic field cameras (e.g., Skope MRT) can directly measure the magnetic field dynamics in real-time, providing independent validation of gradient fidelity and quantifying the distortions caused by eddy currents [36]. This data is also used to calibrate pre-emphasis filters that actively compensate for eddy current effects.
Visualization of Workflows and Relationships
PNS Threshold Prediction and Coil Design Workflow
The following diagram illustrates the integrated computational and experimental process for analyzing and managing PNS in gradient coil design.
Interrelationship of MRI Performance and Physical Challenges
This diagram maps the causal relationships where increased gradient performance for high-resolution MRI intensifies physical challenges, leading to specific impacts on research and clinical applications.
The Scientist's Toolkit: Essential Research Reagents and Materials
The table below details key computational and experimental resources used in the field for analyzing MRI's physical challenges.
Table 2: Key Reagents and Resources for PNS, Acoustic Noise, and Eddy Current Research
| Category | Item/Model Name | Specific Function in Research |
|---|---|---|
| Computational Human Body Models | Yoon-Sun (female) & Jeduk (male) V 4.0 [71]; Zygote Model [68] | Posable, anatomically detailed models with embedded nerve trajectories for simulating induced electric fields and predicting PNS thresholds in different postures [71] [68]. |
| Neurodynamic Simulation Software | NEURON Solver; Sim4Life [71] | Software platforms that implement mathematical models of nerve electrophysiology (e.g., MRG model) to determine if a simulated E-field will trigger an action potential [71]. |
| Electromagnetic Simulation Platforms | CST Studio Suite; Sim4Life [68] [67] | Commercial software used to perform finite-element method (FEM) calculations of electric and magnetic fields generated by coils within complex, heterogeneous body models [68] [67]. |
| Gradient Coil Design & Optimization Tools | Boundary Element Method Stream Function (BEM-SF) [65] | The industry-standard mathematical framework for optimizing gradient coil winding patterns to achieve target magnetic fields while respecting constraints like inductance, torque, and now, PNS via a "PNS oracle" [65]. |
| Experimental Validation Equipment | Skope Field Camera [36] | A magnetic field monitoring system that independently and directly measures the spatiotemporal characteristics of the gradient magnetic field produced by the coil, validating performance and eddy current effects [36]. |
| Image Quality Control Software | Computational Anatomy Toolbox (CAT12) [72] | Provides an Image Quality Rating (IQR) metric, which is a composite measure of noise, bias, and resolution used to automatically and objectively assess the impact of artifacts (e.g., from eddy currents) on structural images [72]. |
Magnetic resonance imaging serves as a critical tool in both clinical diagnostics and preclinical research, enabling non-invasive visualization of soft tissue with exceptional contrast. However, the fidelity of MRI is compromised by several persistent artifacts, including geometric distortion, ghosting, and inhomogeneous fat suppression [73]. These artifacts present substantial challenges in quantitative imaging and can severely impact the validity of scientific conclusions, particularly in drug development studies where accurate measurement of tissue changes is paramount [74]. The pursuit of high-resolution MRI to enhance tissue specificity intensifies these challenges, as many artifacts become more pronounced at higher resolutions and field strengths [75]. This guide objectively compares contemporary MRI techniques for artifact mitigation, providing researchers with experimental data and protocols to optimize imaging for specific applications.
Artifact Origins and Impact on Research
Geometric Distortion
Geometric distortion in MRI arises primarily from static magnetic field (B₀) inhomogeneities, particularly at tissue-air interfaces such as the sinuses and ear canals [75] [76]. In echo-planar imaging (EPI)—the backbone of diffusion-weighted imaging (DWI)—these inhomogeneities cause signal misregistration along the phase-encoding direction, leading to spatial inaccuracies that can obscure anatomy and distort measurements [75] [77]. The severity of distortion escalates with higher field strengths (e.g., 3T and above) and with sequences using long readout times, such as single-shot EPI (ss-EPI) [78].
Ghosting
Ghosting artifacts manifest as duplicated images displaced along the phase-encoding direction. In diffusion MRI, ghosting primarily results from subject motion and cardiac or respiratory pulsation during the diffusion-encoding gradients, which induces inconsistent phase shifts between consecutive k-space lines [75]. Single-shot EPI, while largely immune to inter-shot phase inconsistencies, remains vulnerable to Nyquist ghosting from odd-even echo misalignment, a hardware-related issue [75].
Inhomogeneous Fat Suppression
Inhomogeneous fat suppression occurs due to local B₀ field variations across the imaging volume, which disrupt the precise resonant frequency matching required for selective fat saturation [75] [79]. This artifact is particularly problematic in regions with strong susceptibility gradients, such as the head and neck, and in large-field-of-view acquisitions like whole-spine imaging [77] [78]. Failed fat suppression can obscure pathology and compromise quantitative measurements like apparent diffusion coefficient (ADC) values.
Comparative Analysis of Artifact Mitigation Techniques
Pulse Sequence Alternatives
Conventional ss-EPI remains widely used due to its fast acquisition speed and motion robustness but suffers from significant geometric distortion and T2* blurring [75]. Several advanced sequences have been developed to address these limitations, each with distinct trade-offs between acquisition speed, artifact reduction, and signal-to-noise ratio (SNR).
Table 1: Comparison of EPI-Based Sequences for Diffusion MRI
| Sequence | Principle | Impact on Geometric Distortion | Impact on Ghosting | Impact on Fat Suppression | Key Trade-offs |
|---|---|---|---|---|---|
| Single-Shot EPI (ss-EPI) | Acquires all k-space lines in one shot | Severe distortion due to long echo spacing [75] | Susceptible to Nyquist ghosting [75] | Often inadequate in inhomogeneous regions [77] | Reference standard for speed, but poor image fidelity |
| Readout-Segmented EPI (rs-EPI) | Segments k-space along the readout direction | Reduced distortion via shorter echo spacing [75] [78] | Requires navigator for phase correction [75] | Improved due to shorter TE [75] | Longer acquisition time vs. ss-EPI [75] |
| Integrated Dynamic Shimming (iEPI) | Applies slice-specific shim adjustments [78] | Reduced distortion and signal loss [78] | Minimal direct impact | Significantly improved fat saturation [78] | Requires specialized prototype sequences [78] |
| Combined irsEPI | Integrates rs-EPI with dynamic shimming [78] | Markedly reduced distortion vs. other techniques [78] | Reduced with navigator | Best performance for fat saturation [78] | Combines advantages, but may have longest protocol time |
Deep Learning-Based Reconstruction
Deep learning (DL) has emerged as a powerful post-processing approach for artifact reduction and image enhancement. DL models, particularly U-Net architectures and generative adversarial networks (GANs), are trained to map artifact-corrupted images to their clean counterparts [80]. These methods can suppress noise, correct artifacts, and even enhance resolution through super-resolution processing [80] [77].
A 2024 study demonstrated that a DL-based k-space-to-image reconstruction and super-resolution model for whole-spine DWI significantly improved subjective image quality and diagnostic confidence compared to conventional reconstruction [77]. Quantitatively, the DL approach yielded higher signal-to-noise ratio (SNR) and contrast-to-noise ratio (CNR), and lower image non-uniformity (NU), without altering apparent diffusion coefficient values of lesions [77].
Protocol Parameter Optimization
Strategic adjustment of standard acquisition parameters provides readily accessible means for artifact reduction:
- Increasing Receiver Bandwidth: Reduces susceptibility artifacts by decreasing the time between samplings but lowers SNR [76].
- Shortening Echo Time (TE): Minimizes signal loss from T2* decay, improving SNR in regions near susceptibility interfaces [76].
- Using Spin-Echo Sequences: Instead of gradient-echo, to refocus static field inhomogeneity effects, reducing T2* weighting [76].
- Orienting Phase-Encoding Direction: Aligning the phase-encoding axis with the main susceptibility gradient can minimize artifact propagation across regions of interest [73] [76].
Experimental Data and Performance Comparison
Quantitative Comparison of EPI Techniques
A 2017 phantom and volunteer study at 3T provides direct quantitative comparison of different EPI sequences for head and neck DWI [78].
Table 2: Quantitative Performance of EPI Sequences in Head/Neck DWI at 3T [78]
| Sequence | Relative Spatial Distortion | Overall Image Quality (Phantom) | Overall Image Quality (In-Vivo) | Fat Saturation Performance |
|---|---|---|---|---|
| ss-EPI | 100% (Reference) | Lowest | Lowest | Poor |
| iEPI | ~50% reduction vs. ss-EPI | Intermediate | Intermediate | Good |
| rs-EPI | ~60% reduction vs. ss-EPI | Intermediate | Intermediate | Fair |
| irsEPI | ~80% reduction vs. ss-EPI | Highest | Highest | Excellent |
The study confirmed that ADC quantification remained consistent across all techniques, indicating that artifact mitigation did not alter the fundamental diffusion measurement [78].
Deep Learning Enhancement
In a 2023 intra-individual comparison of 67 patients undergoing whole-spine DWI, DL-reconstructed images demonstrated significant improvements in quantitative metrics compared to conventional DWI [77]:
Table 3: Quantitative Improvement with Deep Learning Reconstruction in Whole-Spine DWI [77]
| Metric | Conventional DWI | DL-DWI | P-value |
|---|---|---|---|
| Non-uniformity (NU) | 22.2 | 19.8 | <0.05 |
| Signal-to-Noise Ratio (SNR) | 5.5 | 7.3 | <0.05 |
| Contrast-to-Noise Ratio (CNR) | 0.7 | 0.8 | <0.05 |
| Lesion Contrast | 4.3 | 5.4 | <0.05 |
Detailed Experimental Protocols
Protocol: Assessing Combined Shim and Readout Segmentation
Objective: To evaluate the efficacy of combined integrated dynamic shimming and readout-segmented EPI (irsEPI) for DWI of the head and neck at 3T [78].
Materials:
- Phantom: Anthropomorphic head/neck phantom with compartments of different diffusivities.
- Volunteers: 10 healthy adults.
- Scanner: 3T MRI system with appropriate head/neck coil.
Sequence Parameters (as used in cited study) [78]:
- Sequences: Conventional ss-EPI, iEPI, rs-EPI, and irsEPI.
- Diffusion Weighting: b-values = 0 and 800-1000 s/mm².
- Other Parameters: TR/TE optimized for each sequence, matrix size = 128×128, FOV = 230×230 mm², slice thickness = 5 mm.
Analysis:
- Spatial Distortion: Measure geometric distortion of phantom compartments in phase-encoding direction.
- Qualitative Scoring: Two blinded radiologists score geometric distortions, signal losses, ghosting, and overall image quality on a 4-point scale.
- Fat Saturation: Assess quality and homogeneity of fat suppression in volunteer images.
- ADC Quantification: Calculate mean ADC values in phantom compartments and volunteer tissues to ensure consistency.
Protocol: Validating Deep Learning Reconstruction
Objective: To validate a DL-based k-space-to-image reconstruction and super-resolution model for whole-spine DWI in patients with hematologic/oncologic diseases [77].
Materials:
- Patients: 67 patients with spinal metastases or marrow-infiltrating disorders.
- Scanner: Clinical 3T MRI system.
- DL Framework: Commercially available or research DL reconstruction application.
Sequence Parameters [77]:
- Sequence: Axial single-shot EPI DWI.
- b-values: 50 and 800 s/mm².
- CONV Reconstruction: Standard scanner reconstruction.
- DL Reconstruction: k-space to image network with super-resolution processing.
Analysis:
- Qualitative Assessment: Radiologists score overall image quality and diagnostic confidence using 5-point Likert scales.
- Quantitative Metrics: Calculate non-uniformity (NU), lesion contrast, SNR, and CNR for both CONV and DL DWI.
- Lesion Detection: Compare the number of vertebrae with malignant lesions identified by each protocol.
- ADC Consistency: Compare mean ADC values of detected lesions between CONV and DL DWI.
Visualization of Technical Relationships
The following diagram illustrates the strategic decision-making process for selecting the appropriate artifact mitigation technique based on the primary source of the artifact and the research requirements.
The Scientist's Toolkit
Table 4: Essential Research Reagents and Solutions for MRI Artifact Studies
| Item | Function/Application | Example Use Case |
|---|---|---|
| Anthropomorphic Phantom | Mimics human tissue susceptibilities and diffusivities for controlled artifact quantification [78]. | Validating distortion reduction of new sequences like irsEPI [78]. |
| Fat Suppression Pulses | Spectrally-selective RF pulses to null signal from fat protons based on chemical shift [79]. | Standard fat saturation; performance depends on B0 homogeneity [75]. |
| Navigator Echoes | Additional k-space measurements to estimate and correct motion-induced phase errors [75]. | Essential for phase correction in multi-shot sequences like rs-EPI [75]. |
| Deep Learning Reconstruction Software | AI-based post-processing tool for denoising, artifact correction, and resolution enhancement [80] [77]. | Improving SNR and CNR in whole-spine DWI without increasing scan time [77]. |
| Integrated Dynamic Shim Prototype | Sequence modification enabling slice-specific B0 shimming during acquisition [78]. | Significantly improving B0 homogeneity in challenging regions like the neck [78]. |
Geometric distortion, ghosting, and inhomogeneous fat suppression present significant obstacles to achieving high-fidelity MRI, particularly in high-resolution applications demanding precise tissue specificity. The comparative data presented in this guide demonstrates that no single solution universally eliminates all artifacts; each mitigation strategy carries distinct advantages and trade-offs. Readout-segmented EPI significantly reduces geometric distortion, while integrated dynamic shimming directly addresses B0 inhomogeneity to improve fat suppression. The combination of these techniques in irsEPI delivers superior artifact reduction, albeit with potential increases in acquisition complexity. Emerging deep learning reconstruction offers a powerful post-processing alternative that enhances multiple image quality metrics without prolonging scan time. Researchers must align their choice of mitigation strategy with the primary artifact of concern, the specific anatomical region, and the constraints of their experimental protocol. The ongoing development of both acquisition and reconstruction technologies continues to expand the boundaries of achievable resolution and accuracy in magnetic resonance imaging.
The integration of high-resolution magnetic resonance imaging (MRI) into multi-center clinical trials represents a paradigm shift in medical research, enabling the collection of large-scale datasets necessary for robust statistical analysis. However, this approach introduces significant technical challenges, primarily concerning non-biological variance introduced by differences in scanner manufacturers, imaging protocols, and acquisition parameters across sites. This variability directly impacts quantitative imaging biomarkers, potentially obscuring genuine biological signals and compromising data integrity in clinical trials focused on tissue specificity. Research demonstrates that deep learning models trained on data from one scanner manufacturer experience a substantial performance decline when applied to data from different vendors, highlighting the critical need for effective harmonization methods [81]. This article provides a comprehensive comparison of intensity standardization techniques, enabling researchers and drug development professionals to select optimal strategies for ensuring data consistency and reliability in multi-center studies investigating tissue-specific properties.
The variability in MRI data acquired across different scanners stems from multiple technical sources. Understanding these factors is essential for selecting appropriate harmonization strategies.
- Scanner Manufacturer Effects: Images acquired from different manufacturers (GE, Philips, Siemens) exhibit distinct voxel characteristics and image properties due to vendor-specific implementations of pulse sequences, reconstruction algorithms, and hardware components. This "domain shift" substantially impacts downstream analysis, as models trained on one vendor's data often fail to generalize effectively to others [81].
- Acquisition Protocol Differences: Variations in pulse sequences, echo time (TE), repetition time (TR), and magnetic field strength (e.g., 1.5T vs. 3T) introduce significant inconsistencies. In magnetic resonance spectroscopy (MRS), these factors affect metabolite quantification, making data pooling challenging without harmonization [82].
- Intensity Inconsistencies: The voxel intensity values in conventional MRI lack standardized physical meaning, varying significantly across scanners and protocols. This is particularly problematic in quantitative analysis of head and neck cancer MRI, where intensity inconsistencies can impair the reliability of measurements [83].
Table 1: Primary Sources of Multi-Scanner Variability in MRI Data
| Variability Source | Impact on Data | Affected Applications |
|---|---|---|
| Scanner Manufacturer | Domain shift in voxel characteristics; vendor-specific image properties [81] | Disease classification models, segmentation tasks, longitudinal studies |
| Field Strength | Differences in signal-to-noise ratio (SNR) and contrast mechanisms [84] | Quantitative T1/T2 mapping, relaxometry, metabolite quantification [82] |
| Acquisition Parameters | Inconsistencies in image contrast, resolution, and intensity normalization [82] | All quantitative MRI analyses, especially radiomics and texture analysis [83] |
Intensity Standardization and Harmonization Techniques
Statistical and Phantom-Based Methods
Statistical and phantom-based approaches form the foundation of MRI harmonization, offering established methodologies for reducing inter-scanner variability.
- Intensity Standardization Methods: These techniques aim to normalize the intensity value ranges across different images. A study on head and neck cancer MRI found that consistency between unstandardized images was substantially more impaired in cohorts with heterogeneous acquisition parameters (SD NMIc = 0.29 ± 0.08) compared to homogeneous cohorts (SD NMIc = 0.15 ± 0.03). After applying intensity standardization methods, significant improvements in consistency were observed particularly in heterogeneous cohorts [83].
- Phantom-Based Standardization: This approach utilizes physical phantoms with known properties to quantify and correct scanner-specific variations. A 2025 multi-center study employing the ISMRM/NIST System MRI phantom demonstrated excellent correlation of T1 and T2 measurements with reference values across 13 scanners from 3 vendors. The study reported good short-term reproducibility (limits of agreement < 10%) and inter-scanner agreement (median coefficient of variation < 7%) for both T1 and T2 values after standardization [84].
- ComBat Harmonization: Originally developed for genomic data, ComBat adjusts for batch effects in multi-site neuroimaging data. It removes site-specific bias while preserving biological signals. However, its effectiveness varies; one study reported that ComBat-based harmonization did not enhance disease classification performance for 3D structural MR images, indicating potential limitations for certain applications [81].
Deep Learning-Based Harmonization
Advanced deep learning methods offer powerful alternatives to traditional harmonization techniques, particularly for complex image transformations.
- Multi-site Unsupervised Representation Disentangler (MURD): This novel approach disentangles site-specific appearance information from site-invariant anatomical information. Using only a single model, MURD generates harmonized images by combining the anatomical content of a source image with the style of a target site. Remarkably, MURD requires no traveling human phantom data for training, making it highly scalable. Validation on over 6,000 multi-site T1- and T2-weighted images demonstrated its effectiveness in generating images with realistic site-specific appearances while preserving anatomical details [85].
- Performance Advantages: In comparative studies, MURD substantially outperformed other unsupervised methods (DRIT++ and StarGAN-v2) across multiple metrics. When evaluated on traveling human phantom data, MURD achieved superior mean absolute error (MAE), multi-scale structural similarity index (MS-SSIM), and peak signal-to-noise ratio (PSNR), indicating better harmonization of contrast and preservation of anatomical details [85].
- Generalization Capability: MURD demonstrated excellent generalizability when tested on datasets significantly larger than its training set, indicating robust performance for large-scale multi-center studies [85].
Table 2: Comparison of Major MRI Harmonization Techniques
| Method | Core Principle | Data Requirements | Key Advantages | Validated Performance |
|---|---|---|---|---|
| MURD [85] | Disentangles content/style using deep learning | Unpaired images from multiple sites (no traveling phantoms) | Single model for all sites; preserves anatomical details | MAE: ~0.02; MS-SSIM: ~0.94; PSNR: ~34 dB on phantom data |
| ComBat [81] | Removes batch effects via linear mixed models | Extracted features with demographic data | Preserves biological variance; well-established | Limited improvement for 3D image classification tasks |
| Phantom-Based [84] | Physical standardization using reference objects | ISMRM/NIST phantom scans on all scanners | Direct physical measurement; vendor-neutral | Inter-scanner CV < 7% for T1/T2; accuracy error < 10% |
| Intensity Standardization [83] | Normalizes intensity value distributions | Cohort images with healthy tissue ROIs | Improves intensity consistency in heterogeneous cohorts | Significant improvement in SD NMIc (from 0.29 to ~0.15) |
Experimental Protocols for Harmonization Validation
Phantom Study Protocol for Multi-Scanner Validation
The ISMRM/NIST phantom study provides a rigorous methodology for evaluating scanner performance and harmonization efficacy:
- Phantom Preparation: Utilize the ISMRM/NIST System phantom containing arrays of varying NiCl₂ and MnCl₂ concentrations. Place the phantom in the scanner room at least 24 hours before acquisition to allow temperature stabilization [84].
- Image Acquisition: Acquire T1 maps using a 2D fast spin-echo inversion recovery (IR) sequence on both NiCl₂ and MnCl₂ vials. Acquire T2 maps on MnCl₂ vials using a multi-echo spin-echo (MESE) sequence. Perform all acquisitions with the transmit body coil and available receive coils [84].
- Temperature Monitoring: Measure temperature before and after each session using MR-readable thermometer vials embedded in the phantom. Apply temperature correction to account for the temperature dependence of relaxation times, particularly for MnCl₂ vials [84].
- Image Processing and Analysis: Perform centralized image analysis using PhantomViewer software. Place circular regions of interest (ROIs) with approximately 10mm diameter on each vial, avoiding edges. Calculate T1 values using a 4-parameter model and T2 values with a 3-parameter mono-exponential model. Apply stimulated echo compensation (e.g., StimFit toolbox) for improved T2 accuracy [84].
- Validation Metrics: Calculate Pearson's correlation with reference values, accuracy error, coefficient of variation (CV%) for inter-scanner agreement, and Bland-Altman plots for short-term reproducibility [84].
Deep Learning Harmonization Protocol
For implementing deep learning-based harmonization such as MURD:
- Network Architecture: Implement two encoders - a content encoder capturing anatomical structures common across sites, and a style encoder capturing site-specific appearance information. Use a generator that combines extracted content with target site style [85].
- Training Procedure: Train separately for each modality (T1-weighted, T2-weighted) using a modest sample size (e.g., 20 volumes per vendor). Use 2.5D slices by merging three adjacent slices for spatial context [85].
- Validation Approach: Employ three testing datasets: (1) Validation Dataset - structurally different images from training data; (2) Generalizability Dataset - large randomly selected volumes; (3) Human Phantom Dataset - traveling phantom data for quantitative evaluation [85].
- Performance Metrics: Evaluate using Frechét Inception Distance (FID) and Kernel Inception Distance (KID) to assess distribution discrepancy with target sites. For phantom data, use MAE, MS-SSIM, and PSNR to quantify harmonization efficacy and anatomical preservation [85].
Visualizing the Harmonization Workflow
The following diagram illustrates the comprehensive workflow for implementing and validating intensity standardization across multiple scanners in clinical trials:
Harmonization Workflow for Multi-Center MRI Trials
Table 3: Essential Research Tools for MRI Intensity Standardization
| Tool/Resource | Function | Application Context |
|---|---|---|
| ISMRM/NIST Phantom [84] | Provides physical reference standards for validating T1/T2 measurements across scanners | Multi-center study quality control; scanner calibration and monitoring |
| MURD Framework [85] | Deep learning-based harmonization without traveling phantoms; preserves anatomical details | Retrospective harmonization of existing datasets; multi-site studies with limited phantom data |
| ComBat Harmonization [81] | Statistical method for removing site-specific batch effects while preserving biological signals | Feature-level harmonization of extracted imaging biomarkers; cortical thickness, volume measurements |
| StimFit Toolbox [84] | Corrects T2 maps using stimulated echo compensation based on EPG algorithm | Improving T2 measurement accuracy in multi-vendor studies; particularly beneficial in renal range |
| PhantomViewer Software [84] | Specialized software for analyzing ISMRM/NIST phantom data and calculating relaxation times | Centralized analysis of phantom data in multi-center trials; standardized T1/T2 calculation |
| Intensity Normalization Packages [83] | Python libraries for implementing intensity standardization methods (e.g., WhiteStripe) | Voxel-level intensity normalization prior to quantitative analysis; improving intensity consistency |
Intensity standardization across scanners is no longer optional but essential for producing valid, reproducible results in multi-center MRI research, particularly in studies investigating tissue-specific properties at high versus standard resolutions. The emerging toolkit—spanning from rigorous phantom-based validation to advanced deep learning harmonization methods like MURD—provides powerful solutions to the persistent challenge of inter-scanner variability. For researchers and drug development professionals, the selection of harmonization strategies must be guided by specific study requirements: prospective studies benefit from combined phantom validation and protocol standardization, while retrospective analyses of existing datasets can leverage unsupervised deep learning approaches. As these methodologies continue to evolve, they promise to enhance the reliability of quantitative MRI biomarkers, ultimately strengthening the evidentiary basis for diagnostic and therapeutic decisions in clinical practice and trial settings.
Magnetic resonance imaging (MRI) is a powerful diagnostic tool, but its clinical utility and research applications are often hampered by long acquisition times. Prolonged scans can lead to patient discomfort and motion artifacts, which degrade image quality and limit throughput. Within the critical context of high-resolution MRI research—where the goal is to achieve superior tissue specificity compared to standard resolutions—the need for efficient acceleration strategies becomes paramount. This guide objectively compares three cornerstone acceleration technologies: Parallel Imaging (PI), Simultaneous Multi-Slice (SMS), and Deep Learning (DL) Reconstruction, synthesizing current clinical experimental data to inform researchers and drug development professionals.
Experimental Comparison of Acceleration Strategies
The following tables summarize the quantitative findings from recent, rigorous studies evaluating these acceleration methods in clinical settings.
Table 1: Summary of Key Clinical Study Protocols on MRI Acceleration
| Study Focus | Acceleration Techniques Compared | Anatomy | Key Performance Metrics |
|---|---|---|---|
| Diagnostic performance of accelerated knee MRI [86] | 1. Conventional PI (reference)2. SMS3. SMS + Deep Learning Reconstruction (DLR) | Knee | Sensitivity, Specificity for ACL, meniscal tears |
| Deep Learning-enhanced PI and SMS [87] | 1. Conventional 2-fold PI (P2)2. DL + P2S2 (4x accel.)3. DL + P3S2 (6x accel.)4. DL + P4S2 (8x accel.) | Knee | Acquisition time, Diagnostic performance, Image sharpness (ERD), Noise (NP) |
| Texture analysis in DCE-MRI [88] | 1. Low-temporal-resolution DCE-MRI (1+5 phases)2. High-temporal-resolution DCE-MRI (1+26 phases) | Breast | Pharmacokinetic parameters (Ktrans, Kep, Ve, Vp), Diagnostic performance in lesion differentiation |
Table 2: Comparative Diagnostic Performance and Quantitative Outcomes
| Evaluation Parameter | Conventional PI (Reference) | SMS Acceleration | SMS + Deep Learning Reconstruction |
|---|---|---|---|
| ACL Tear Sensitivity | 0.85 [86] | 0.96 [86] | 0.98 [86] |
| ACL Tear Specificity | ≥ 0.98 [86] | ≥ 0.98 [86] | ≥ 0.98 [86] |
| Medial Meniscus Sensitivity | 0.94 (Baseline) [86] | Met non-inferiority criteria [86] | Met non-inferiority criteria [86] |
| Acquisition Time Reduction | Baseline (0%) | 47% reduction (vs. P2) [87] | Up to 71% reduction (vs. conventional PI) [87] |
| Image Noise (Noise Power) | Baseline [87] | Not Reported | Significantly lower (p < 0.001) [87] |
| Image Sharpness (Edge Rise Distance) | Baseline [87] | Not Reported | No significant difference (p > 0.12) [87] |
Detailed Experimental Protocols
To critically assess the data, understanding the methodology of the key experiments is essential.
1. Protocol for Real-World Knee MRI Performance [86]
- Objective: To assess whether knee MRI protocols accelerated using SMS and DLR are non-inferior to a conventional PI protocol for detecting internal derangement.
- Study Design: A large-scale retrospective cohort study included 1055 patients who underwent knee MRI followed by arthroscopy within 180 days.
- Patient Groups: Patients were scanned using one of three protocols: a conventional PI protocol (n=226), an accelerated SMS protocol (n=406), or an SMS with DLR protocol (n=423).
- Reference Standard: Arthroscopic findings were used as the reference standard to compare the radiology interpretations of MRI for tears of the anterior cruciate ligament (ACL), medial meniscus (MM), and lateral meniscus (LM).
- Statistical Analysis: Sensitivity and specificity were calculated with 95% confidence intervals using non-parametric bootstrapping. Non-inferiority was concluded if the upper bound of the 95% CI for the difference in sensitivity and specificity was ≤ 0.05.
2. Protocol for DL-Enhanced PI and SMS Acceleration [87]
- Objective: To examine combinations of PI and SMS acceleration using DL-enhanced reconstruction and compare their diagnostic performance and quantitative image quality.
- Study Design: A retrospective analysis of 33 patients who underwent knee MRI.
- Acceleration Protocols: Conventional 2-fold PI was compared against three DL-enhanced protocols: P2S2 (2-fold PI + 2-fold SMS, 4x acceleration), P3S2 (3-fold PI + 2-fold SMS, 6x acceleration), and P4S2 (4-fold PI + 2-fold SMS, 8x acceleration).
- Evaluation: Three readers evaluated internal derangement and overall image quality. Quantitative measures included Edge Rise Distance (ERD) for image sharpness and Noise Power (NP) for image noise.
3. Protocol for Temporal Resolution in DCE-MRI [88]
- Objective: To investigate the diagnostic potential of texture-based analysis from high-temporal-resolution DCE-MRI for breast lesions.
- Study Design: A retrospective study analyzed 62 patients in a high-temporal-resolution group (1+26 phases) and 78 patients in a low-temporal-resolution control group (1+5 phases).
- Image Analysis: Pharmacokinetic parameters (Ktrans, Kep, Ve, Vp) were calculated. Texture features based on the Ktrans map were extracted from the lesion center, peripheral area, and background parenchyma.
- Statistical Analysis: Receiver operating characteristic (ROC) analysis was used to evaluate the diagnostic performance of the texture features model in differentiating benign and malignant lesions.
The Scientist's Toolkit: Key Research Reagents & Materials
The following table details essential components in the ecosystem of accelerated MRI research.
Table 3: Essential Research Materials and Software for Accelerated MRI
| Item Name | Function / Description | Relevance to Acceleration Research |
|---|---|---|
| Multi-Channel Phased-Array Coils | Arrays of receiver coils, each with a unique spatial sensitivity profile [89]. | Fundamental for PI and SMS techniques; the spatial information from multiple coils is used to reconstruct undersampled data [89] [90]. |
| Deep Learning Reconstruction Software | Software platforms that use trained neural networks to reconstruct images from undersampled k-space data [91]. | Enables high-factor acceleration by learning to suppress artifacts and restore image information, often integrated with PI and SMS [86] [89]. |
| k-Space Undersampling Mask | A predefined pattern that determines which phase-encoding lines are skipped during data acquisition [89]. | Core to CS and some DL methods; different patterns (e.g., random) can be optimized to make the reconstruction problem better-posed [89]. |
| Autocalibration Signal (ACS) Data | A small set of fully sampled k-space lines acquired at the center of k-space [89]. | Used in PI methods like GRAPPA to estimate coil sensitivity profiles or interpolation kernels, crucial for stabilizing reconstruction [89] [92]. |
| Generative Diffusion Models (e.g., ROGER) | Advanced DL models that learn data distributions as priors and can generate high-quality images from highly undersampled data through an iterative denoising process [92] [93]. | Represents the cutting edge for robust reconstruction, particularly effective for challenging SMS data where ACS is unavailable, showing strong out-of-distribution generalization [92]. |
Technical Workflow of Integrated MRI Acceleration
The modern approach to MRI acceleration often involves a combination of hardware-based encoding (PI, SMS) and software-based reconstruction (DL). The following diagram illustrates this integrated workflow and the logical relationship between the components.
Mechanism of SMS Imaging and Aliasing
A fundamental challenge in SMS imaging is the separation of signals from multiple simultaneously excited slices. The following diagram illustrates the principle of slice aliasing and the role of coil sensitivity profiles in the separation process, which is foundational to both PI and modern DL reconstruction techniques.
The pursuit of high-resolution MRI with enhanced tissue specificity is inextricably linked to the advancement of acceleration technologies. Evidence demonstrates that while PI and SMS alone offer significant time savings, their integration with Deep Learning reconstruction is the most transformative strategy. DL-enhanced protocols achieve acceleration factors of 8x and higher, reducing scan times by over 70% while maintaining diagnostic performance comparable to conventional methods [86] [87]. For research requiring high temporal resolution, such as in DCE-MRI, advanced acceleration is indispensable for capturing finer kinetic details without compromising spatial resolution [88]. Emerging generative models like ROGER further promise robust reconstruction from highly sparse data, offering strong generalization across diverse anatomical regions and acquisition parameters [92] [93]. For researchers and drug development professionals, this signifies a paradigm shift: accelerated MRI is no longer a mere convenience but a critical enabler for high-throughput, high-fidelity imaging studies that can robustly characterize tissue microstructure and function.
Magnetic resonance imaging is a cornerstone of modern medical diagnosis and neuroscience research, providing exceptional soft-tissue contrast without ionizing radiation. However, a fundamental trade-off exists between spatial resolution, signal-to-noise ratio (SNR), and acquisition time. High-resolution imaging often suffers from reduced SNR and longer scan times, which increase susceptibility to motion artifacts and patient discomfort [94] [95]. While hardware solutions such as ultra-high-field 7T and 9.4T scanners can achieve remarkable resolutions down to 0.6-0.8 mm isotropic, their prohibitive costs—often exceeding several million dollars—and technical complexities limit widespread adoption [96] [4].
Computational super-resolution (SR) techniques present a promising alternative by generating high-resolution (HR) images from more affordable low-resolution (LR) acquisitions, potentially improving diagnostic accuracy without requiring additional hardware [97]. These methods leverage advanced algorithms, particularly deep learning (DL), to overcome inherent physical limitations in MRI acquisition. For researchers and drug development professionals, SR techniques offer the potential to enhance tissue specificity in longitudinal studies, improve detection of subtle pathological changes, and harmonize data across imaging centers with different scanner capabilities [8]. This guide provides a comprehensive comparison of current SR methodologies, their experimental validation, and implementation considerations for scientific applications.
Super-Resolution Technique Comparison
Super-resolution techniques for MRI have evolved from traditional interpolation methods to sophisticated deep learning architectures. The table below compares the predominant computational approaches, their underlying mechanisms, advantages, and limitations.
Table 1: Comparison of MRI Super-Resolution Techniques
| Technique Category | Representative Models | Key Mechanism | Performance Advantages | Limitations |
|---|---|---|---|---|
| Deep Learning Surveys | Comprehensive DL Survey [97] | Systematic taxonomy of DL approaches | Covers theoretical foundations, architectural designs, learning strategies | Rapidly evolving field, requires specialized expertise |
| Generative Adversarial Networks | TCGAN, SRGAN, ESRGAN [8] [98] | Adversarial training with generator/discriminator networks | Superior perceptual quality, enhanced texture synthesis | Training instability, potential for hallucinated features |
| Diffusion Models | Res-SRDiff, MoEDiff-SR, KDMRI [95] [98] | Iterative denoising process, region-adaptive experts | High-fidelity reconstruction, preservation of fine details | Computationally intensive, slower inference (improved in Res-SRDiff) |
| Convolutional Neural Networks | SRCNN, VDSR, SRResNet [8] [98] | Hierarchical feature extraction through convolutional layers | 2-4 dB PSNR and 0.05-0.12 SSIM improvement over bicubic interpolation | Over-smoothed reconstructions, limited high-frequency preservation |
| Transformer Architectures | TCGAN (Transformer-enhanced) [8] | Self-attention mechanisms capturing long-range dependencies | Improved contextual understanding, better structural preservation | High computational demands, extensive data requirements |
| Mixture of Experts | MoEDiff-SR [98] | Multiple specialized denoisers with gating network | Region-adaptive processing, enhanced anatomical specificity | Complex training protocol, potential routing imbalances |
Quantitative Performance Comparison
Validation of SR techniques employs standardized image quality metrics including Peak Signal-to-Noise Ratio (PSNR), Structural Similarity Index (SSIM), and Dice similarity coefficient for segmentation tasks. The table below summarizes quantitative performance metrics reported across recent studies.
Table 2: Quantitative Performance Metrics of Super-Resolution Techniques
| Technique | Application Context | PSNR (dB) | SSIM | Dice Score | Specialized Metrics |
|---|---|---|---|---|---|
| GA-MS-UNet++ [96] | 9.4T Brain MRI Segmentation | N/A | N/A | 0.93 (manual), 0.89 (SynthSeg) | 97.29% accuracy, 90.02% precision |
| Res-SRDiff [95] | Brain T1 & Prostate T2 | Significantly higher than benchmarks | Significantly higher than benchmarks | N/A | GMSD: Improved, LPIPS: Improved |
| TCGAN [8] | 1.5T to 3T MRI Enhancement | Superior to SRGAN/ESPCN | Superior to SRGAN/ESPCN | N/A | LPIPS: Improved, IDP: Improved |
| MoEDiff-SR [98] | 3T to 7T-like MRI | State-of-the-art | State-of-the-art | N/A | Regional adaptation confirmed |
| P4S2 DL Acceleration [99] | Knee MRI Acquisition | N/A | N/A | N/A | 31-41% time reduction, SNR/CNR improved |
Experimental Protocols and Methodologies
Dataset Preparation and Preprocessing
Standardized dataset preparation is crucial for training and evaluating SR models. The UltraCortex dataset, containing 9.4T MRI scans from 78 healthy adults, exemplifies rigorous preprocessing: images are stored in NIfTI format, loaded slice-by-slice using the nibabel library, and normalized by subtracting the mean and dividing by the standard deviation [96]. For the 12 subjects with manual segmentation masks, data is typically split into training (8 subjects) and testing (4 subjects) sets. Data augmentation techniques including random horizontal flips and rotations are applied during training to improve model generalization [96].
The Alzheimer's Disease Neuroimaging Initiative (ADNI) dataset demonstrates considerations for multi-scanner studies. When using both 1.5T and 3T scans from the same patients, researchers must account for manufacturer-specific reconstruction algorithms by avoiding cross-manufacturer comparisons (e.g., not training on 1.5T GE/Siemens data and testing on 3T Philips data) [8]. This ensures that field strength differences are the primary variable rather than reconstruction variations.
Super-Resolution Reconstruction Framework
The mathematical foundation for many SR techniques can be represented as a linear inverse problem. The mapping from a high-resolution image (x) to low-resolution observations (yₖ) is described as:
yₖ = Aₖx + εₖ
where Aₖ represents the sampling matrix encompassing rotation, translation, down-sampling, and blurring operations, and εₖ represents random noise [94]. The complete system combining all low-resolution images is expressed as:
y = Ax + ε
Reconstructing the high-resolution image involves solving this ill-posed inverse problem, often through regularized least-squares optimization:
x̂ = argminₓ ||Ax - y||₂² + λ||R(x)||₂²
where λ controls the regularization strength and R(x) imposes smoothness constraints on the solution [94]. Advanced implementations may use content-aware regularization or anatomical priors to preserve clinically relevant features.
Diagram 1: MoEDiff-SR Architecture (26 characters)
Specialized Implementation Protocols
MoEDiff-SR Methodology: This approach employs a Mixture of Experts (MoE) framework with three specialized denoising experts targeting distinct neuroanatomical regions: (1) centrum semiovale (white matter), (2) sulcal and gyral cortex, and (3) grey-white matter junction [98]. A transformer-based feature extractor computes multi-scale patch embeddings capturing both global structural information and local texture details. A gating network then dynamically assigns adaptive weights to these experts at a fine-grained token level, enabling region-specific reconstruction. During training, gradient nonlinearity correction and bias field correction are applied to improve gating network convergence.
Res-SRDiff Protocol: This diffusion-based framework incorporates a residual error-shifting mechanism into the forward diffusion process, aligning degraded HR and LR distributions [95]. This innovation enables high-fidelity reconstruction with only four sampling steps, drastically reducing computation time to under one second per slice compared to 20-38 seconds for traditional diffusion models. The model was validated on ultra-high-field brain T1 MP2RAGE maps and T2-weighted prostate images, with quantitative assessment using PSNR, SSIM, GMSD, and LPIPS metrics.
Successful implementation of MRI super-resolution requires both computational resources and specialized data. The table below details essential components for establishing an SR research pipeline.
Table 3: Essential Research Resources for MRI Super-Resolution
| Resource Category | Specific Examples | Function/Role | Access Considerations |
|---|---|---|---|
| Benchmark Datasets | UltraCortex (9.4T), ADNI (1.5T/3T pairs), IXI dataset | Training and validation data with varying field strengths | Publicly available with data use agreements; ensure ethical approvals |
| Annotation Standards | Manual segmentation masks, Radiologist-reviewed ground truth | Model training and performance evaluation | Limited availability for 9.4T data (only 12 subjects in UltraCortex) |
| Computational Frameworks | PyTorch, TensorFlow with medical imaging extensions | DL model development and training | GPU resources essential for training; inference can be CPU-based |
| Evaluation Metrics | PSNR, SSIM, Dice score, LPIPS, GMSD | Quantitative performance assessment | Multiple metrics needed to capture different quality aspects |
| Preprocessing Tools | FSL, FreeSurfer, nibabel, bias field correction algorithms | Data standardization and quality control | Essential for handling multi-scanner, multi-protocol data |
| Specialized Architectures | U-Net variants, GANs, Diffusion models, Transformer networks | Algorithm implementation for specific SR tasks | Model selection depends on application context and data characteristics |
Computational super-resolution represents a paradigm shift in magnetic resonance imaging, offering researchers and clinicians the ability to enhance image resolution without prohibitive hardware investments. While ultra-high-field scanners provide exceptional native resolution, SR techniques can bridge the accessibility gap and enable finer analysis of existing data. For drug development professionals, these methods promise improved sensitivity in detecting subtle therapeutic effects and disease progression, particularly in neurodegenerative conditions where volumetric changes are gradual [96].
The evolving landscape of SR research shows distinct trends: GANs and diffusion models currently lead in perceptual quality and metric performance, while transformer architectures and mixture-of-experts approaches offer promising pathways for region-specific enhancement [8] [95] [98]. Future directions likely include greater integration of physical models of MRI acquisition, domain adaptation for scanner-specific characteristics, and clinical validation for specific diagnostic tasks. As these computational techniques mature, they will increasingly complement hardware advances, making high-resolution imaging more accessible for multicenter trials and routine clinical practice.
Diagram 2: SR Workflow (11 characters)
Benchmarking Performance: Validation as Biomarkers and Comparative Efficacy in Disease
In the pursuit of enhanced tissue specificity for research and clinical diagnosis, high-resolution magnetic resonance imaging (HR-MRI) has emerged as a pivotal tool. The image quality that enables this specificity is fundamentally governed by quantifiable parameters, primarily the Signal-to-Noise Ratio (SNR), Contrast-to-Noise Ratio (CNR), and the g-factor associated with parallel imaging acceleration. These metrics provide the objective foundation for comparing imaging hardware, acquisition sequences, and reconstruction algorithms. Advances in MRI technology, including ultra-high field systems and novel acceleration techniques like compressed sensing, have made the understanding of these metrics more critical than ever for researchers and drug development professionals who rely on precise, quantifiable imaging data [100] [4]. This guide provides a structured comparison of these core metrics, supported by experimental data and detailed methodologies, to inform decision-making in high-resolution neuroimaging.
Theoretical Foundations of Core Image Quality Metrics
Signal-to-Noise Ratio (SNR)
SNR is a fundamental measure of image clarity, quantifying the strength of the desired signal relative to the background noise. It is defined as:
SNR = S / N
where S is the mean signal intensity within a tissue region of interest (ROI), and N is the standard deviation of the background noise [101] [102]. A higher SNR indicates a clearer, less grainy image, which is a prerequisite for visualizing fine anatomical details. SNR is influenced by multiple factors, including magnetic field strength, coil design, and sequence parameters [4].
Contrast-to-Noise Ratio (CNR)
While SNR measures overall signal strength, CNR quantifies the ability to distinguish between different tissues. It is defined as the difference in signal between two tissues divided by the background noise:
CNR = |S₁ - S₂| / N
Here, S₁ and S₂ are the mean signal intensities from two different tissues [102]. A high CNR is essential for tasks such as delineating a tumor from surrounding parenchyma or identifying subtle pathological changes [45]. It is the metric most directly tied to diagnostic efficacy and tissue specificity.
g-Factor
The g-factor is a metric specific to parallel imaging techniques like SENSE (SENSitivity Encoding). It quantifies the noise amplification resulting from undersampling k-space data to accelerate acquisition. The relationship is given by:
SNRaccel = SNRfull / (g * √R)
where SNR_accel is the SNR of the accelerated image, SNR_full is the SNR of a fully sampled acquisition, and R is the acceleration factor [4]. A g-factor of 1 represents ideal acceleration with no noise amplification, while higher values indicate progressively worse performance. Advanced receiver coil arrays with more elements are designed to minimize the g-factor, enabling higher acceleration factors with less penalty [4].
Table 1: Definitions and Implications of Core MRI Quality Metrics
| Metric | Definition | Quantifies | Impact on Image Quality |
|---|---|---|---|
| SNR | Mean Signal / Noise Std. Dev. [101] | Strength of the MR signal relative to background noise. | Higher SNR yields less "grainy" images, allowing visualization of finer details [103]. |
| CNR | |Signal₁ - Signal₂| / Noise [102] | Ability to distinguish between two different tissues. | Higher CNR makes pathological features or tissue boundaries more conspicuous [45]. |
| g-Factor | SNRfull / (SNRaccel · √R) [4] | Noise amplification from parallel imaging acceleration. | A lower g-factor (closer to 1) preserves image quality at higher acceleration factors [4]. |
Experimental Comparisons of Acceleration Techniques and Hardware
Compressed Sensing vs. Conventional Parallel Imaging
A 2019 study directly compared conventional SENSE to Compressed Sensing plus SENSE (CS) for HR-MRI of intracranial and extracranial arteries in healthy volunteers, providing robust quantitative data on SNR and CNR performance under different acceleration scenarios [104].
Methodology:
- Imaging Protocol: 3D T1-weighted imaging (T1WI) and proton density-weighted imaging (PD) were performed on a 3T system.
- Acceleration: Both CS and SENSE sequences were acquired under identical total acceleration factors (AFt). For T1WI, AFt values were 5.5, 6.8, and 9.7. For PD, AFt values were 3.2, 4.0, and 5.8.
- Analysis: Two neuroradiologists performed blinded qualitative analysis using 4-point visual scoring systems for image quality and vessel delineation. Quantitative analysis measured SNR and CNR in arteries including the middle cerebral artery and basilar artery [104].
Table 2: Quantitative SNR and CNR Comparison: Compressed Sensing vs. SENSE [104]
| Sequence | Acceleration Factor (AFt) | SNR Performance | CNR Performance | Proportion of Acceptable Images |
|---|---|---|---|---|
| CS T1WI | 5.5 | Lower than original, higher than SENSE | Lower than original, higher than SENSE | No significant difference from original |
| SENSE T1WI | 5.5 | Lower than original and CS | Lower than original and CS | Lower than CS |
| CS T1WI | 6.8 | Lower than original, higher than SENSE | Lower than original, higher than SENSE | Higher than SENSE |
| CS T1WI | 9.7 | Lower than original, higher than SENSE | Lower than original, higher than SENSE | Higher than SENSE |
| CS PD | 5.8 | Lower than original, higher than SENSE | Lower than original, higher than SENSE | Higher than SENSE |
Key Findings:
- CS reconstruction consistently yielded better image quality and vessel delineation than SENSE at higher acceleration factors.
- The study concluded that CS is a superior acceleration method, reliably maintaining diagnostic quality for vessel HR-MRI at an AFt of 5.5 for T1WI and 3.2/4.0 for PD [104].
The Impact of Magnetic Field Strength and Gradient Performance
Technological advances in hardware directly influence the baseline SNR, which in turn affects CNR and achievable resolution.
Ultra-High Field (7T and Beyond):
- SNR Advantage: The signal from 7T scanners provides a substantial SNR gain over 3T and 1.5T systems. This can be traded for higher spatial resolution, enabling the delineation of small anatomical structures like cortical layers and hippocampal subfields [100].
- Clinical Utility: In epilepsy, 7T MRI has been shown to reveal subtle epileptogenic foci in 22-43% of patients with non-lesional 3T MRI, directly impacting surgical planning [100].
High-Performance Gradient Systems:
- Next-generation 7T scanners are being equipped with head-only asymmetric gradient coils capable of ultra-high performance (e.g., 200 mT/m amplitude, 900 T/m/s slew rate) [4].
- Impact on Resolution: These gradients enable shorter echo spacing and echo times in sequences like Echo-Planar Imaging (EPI), reducing T2* blurring and geometric distortion. This allows for functional MRI at ultra-high resolutions of 0.35–0.45 mm isotropic, facilitating cortical layer and columnar functional activity studies [4].
- g-Factor and Receiver Arrays: Combining high-performance gradients with dense receiver coil arrays (e.g., 64-channel or 96-channel) reduces the g-factor penalty. This allows for higher parallel imaging acceleration factors (e.g., R=4-5) while maintaining sufficient SNR for diagnosis, thereby reducing scan times [4].
Table 3: Impact of Hardware on Key Performance Metrics
| Hardware Technology | Impact on SNR | Impact on CNR | Impact on g-Factor / Acceleration |
|---|---|---|---|
| 7T vs. 3T Scanner | Significant increase [100] | Improves for T2*-weighted sequences (SWI, BOLD fMRI) [100] | Not directly affected, but higher baseline SNR offsets acceleration penalties. |
| High-Performance Gradients | Enables shorter TE, preserving signal in demanding sequences [4] | Reduces distortion and blurring, improving effective spatial resolution and contrast [4] | Enables faster encoding, complementary to parallel imaging. |
| Dense Receiver Coil Arrays (e.g., 96-ch) | Boosts signal, particularly in the cortex [4] | Improves local contrast by increasing local signal. | Significantly reduces g-factor, enabling higher acceleration factors [4]. |
Essential Research Reagents and Materials
The following table details key components and software tools essential for conducting experiments in high-resolution MRI and quantifying the discussed metrics.
Table 4: Research Reagent Solutions for High-Resolution MRI
| Item Name | Function / Application | Relevance to Metrics |
|---|---|---|
| 3T/7T MRI Scanner | High-field platform for data acquisition. | Provides the fundamental static magnetic field (B₀). Higher field strength (7T) directly boosts baseline SNR [100]. |
| Multi-Channel Receiver Coil | An array of coils to detect the MR signal. | Higher channel counts (e.g., 64-ch, 96-ch) improve SNR and reduce the g-factor for parallel imaging [4]. |
| Phantom | An object with known properties used for scanner calibration and quality control. | Essential for standardized, objective measurement of SNR and CNR without biological variability. |
| ImageJ / "AsanJ" Software | Software for image analysis and processing. | Used to place Regions of Interest (ROIs) for quantitative measurement of signal and noise to calculate SNR and CNR [104]. |
| Compressed Sensing Reconstruction Software | Advanced algorithm to reconstruct images from undersampled k-space data. | Enables higher acceleration factors while maintaining image quality, directly impacting the trade-off between SNR, CNR, and scan time [104]. |
Methodological Workflow and Interrelationships
The diagram below illustrates the logical workflow of a typical experiment designed to compare MRI sequences or hardware, highlighting the interrelationships between hardware, acquisition, reconstruction, and the final quantitative metrics.
This guide provides a comparative analysis of high-resolution magnetic resonance imaging (MRI), specifically 7 Tesla (7T) systems, against standard 1.5T and 3T clinical scanners for researching epilepsy, multiple sclerosis (MS), and Alzheimer's disease (AD). For researchers and drug development professionals, the enhanced spatial resolution, contrast-to-noise ratio, and quantitative capabilities of ultra-high-field (UHF) MRI are transforming the identification and validation of subtle, early-stage pathological biomarkers. This objective comparison, grounded in recent experimental data, demonstrates that 7T MRI consistently outperforms standard-resolution systems in visualizing critical features like the central vein sign in MS, hippocampal sclerosis in epilepsy, and amyloid plaques in AD, thereby offering a powerful tool for accelerating therapeutic development.
Magnetic resonance imaging is a cornerstone of non-invasive neurological diagnosis and therapeutic monitoring. While 1.5T and 3T field strengths remain the clinical standard, the advent of clinically approved 7T MRI represents a transformative step forward, offering superior spatial resolution, contrast, and sensitivity for visualizing neuroanatomy, metabolism, and function [105]. This guide frames the performance of these systems within the critical research context of tissue specificity—the ability to resolve and quantify pathological features unique to specific cell types, cortical layers, and microvascular structures within the brain.
The drive toward ultra-high-resolution human brain imaging is fueled by the need to study neural circuits at the mesoscale—the level of cortical columns and layers [4]. Standard 3T fMRI studies typically use isotropic spatial resolutions on the order of 3.0 mm, which is insufficient to adequately sample the human cortex, where thickness varies between 1.5 and 4.5 mm and columnar features are 0.6–1.0 mm [4]. Next-generation 7T scanners are now being designed to routinely perform functional imaging at 0.35–0.45 mm isotropic resolution, revealing layer-specific functional activity and depth-dependent organization of axonal fiber tracks [4]. For drug development, this granularity enables more precise target engagement biomarkers and sensitive monitoring of treatment effects on previously invisible pathologies.
Performance Comparison: High-Resolution vs. Standard MRI
The following tables synthesize quantitative and qualitative performance data across scanner field strengths for key biomarker detection in neurological disorders.
Table 1: Technical Performance Specifications and General Biomarker Detection
| Performance Metric | Standard 1.5T MRI | Standard 3T MRI | High-Resolution 7T MRI |
|---|---|---|---|
| Typical Spatial Resolution (Iso.) | 1.0 - 1.5 mm | 0.8 - 1.0 mm | 0.35 - 0.6 mm [4] |
| Signal-to-Noise Ratio (SNR) | Baseline | ~2x 1.5T | ~4-5x 1.5T [105] |
| Central Vein Sign (MS) Detection | Limited | Moderate | High Sensitivity & Specificity [105] |
| Paramagnetic Rim Lesions (MS) | Rarely Detected | Occasionally Detected | Routinely Detected [105] |
| Hippocampal Subfield Volume Analysis | Limited Accuracy | Good Accuracy | High Accuracy & Precision [106] |
| Motor Band Sign (ALS) | Occasionally Detected | Moderate Detection | High Detection Rate [105] |
| Amyloid Plaque Detection | Not Possible | Not Possible | Emerging Capability |
Table 2: Disorder-Specific Clinical and Research Performance
| Disorder & Biomarker | Performance of Standard Resolution (1.5T/3T) | Performance of High Resolution (7T) | Experimental Data & Clinical Impact |
|---|---|---|---|
| Epilepsy: Focal Cortical Dysplasia (FCD) | Detects ~50% of lesions [107] | Superior lesion detection, especially in temporal lobe [105] | Alters surgical planning; 7T reveals lesions missed at 3T in drug-resistant patients [105]. |
| Multiple Sclerosis: Central Vein Sign | Limited visualization | Clearly visualized perivenular lesions [105] | Improves diagnostic specificity; serves as a biomarker for differentiating MS from mimics [105]. |
| Alzheimer's: Functional Network Alterations | Detects gross hypo-/hyper-connectivity [108] | Reveals layer-specific connectivity disruptions [4] | PLSR analysis links atrophy to specific FC patterns; explains 34% of variance in cognitive deficits [108]. |
| Amyotrophic Lateral Sclerosis: Motor Band Sign | Occasionally visible on T2*/SWI [105] | Present in a majority of patients; detailed characterization [105] | Correlates with upper motor neuron burden and clinical severity [105]. |
| General: Quantitative Susceptibility Mapping (QSM) | Lower sensitivity to iron/calcification | Precise iron content mapping in PD, AD, etc. [109] | Differentiates microbleeds from calcifications; monitors iron deposition in neurodegeneration [109]. |
Experimental Protocols for Biomarker Validation
To ensure the reproducibility of findings, this section outlines detailed methodologies for key experiments cited in the performance comparison.
Protocol for 7T Ultra-High-Resolution Functional and Structural Imaging
This protocol is derived from the implementation on a next-generation 7T scanner with optimized hardware [4].
- Scanner System: Next-generation 7T MRI system with integrated high-performance components.
- Gradient Coil: Head-only "Impulse" asymmetric gradient coil with a third winding layer.
- Gradient Performance: Maximum amplitude of 200 mT/m, slew rate of 900 T/m/s [4].
- Radiofrequency System: 128-channel receiver system with either a 64- or 96-channel receiver coil array. A 16-channel transmit system is used to improve image uniformity and reduce power deposition [4].
- Pulse Sequences:
- T2*-Weighted fMRI: Echo-planar imaging (EPI) is optimized for a short echo spacing (e.g., 0.58 ms at 0.6 mm resolution) to minimize T2* blurring and geometric distortion. The high-performance gradient enables a shorter echo time (e.g., 17 ms at 0.6 mm resolution), boosting signal [4].
- Structural Imaging: MP2RAGE or similar sequences are used for T1-weighted imaging at sub-millimeter resolution.
- Spatial Resolution: Functional imaging is routinely performed at 0.35–0.45 mm isotropic. Structural and diffusion imaging achieves correspondingly high resolutions [4].
- Data Analysis: For functional connectivity, partial least-squares regression (PLSR) can be applied to identify structure-function components linking atrophy patterns to functional connectivity alterations [108].
Protocol for Detecting the Central Vein Sign in Multiple Sclerosis
This protocol is standardized for use on clinical 7T systems [105].
- Scanner System: Clinically approved 7T MRI scanner.
- Radiofrequency Coil: Multi-channel receive-only head coil (e.g., 32-channel).
- Pulse Sequence: 3D T2*-weighted gradient echo or Susceptibility-Weighted Imaging (SWI).
- Spatial Resolution: High isotropic resolution (e.g., 0.5-0.6 mm) to adequately resolve small central veins within white matter lesions.
- Image Analysis: A lesion is considered positive for the central vein sign if a single, linear hypointensity (the vein) is visualized traversing its center. The proportion of lesions with the central vein sign can be calculated to aid diagnosis [105].
Protocol for Automated Volumetric Analysis in Neurodegeneration
This protocol utilizes FDA-cleared software for reproducible quantification [106].
- Scanner System: 3T or 7T MRI system. The enhanced resolution of 7T provides more precise segmentations.
- Structural Sequence: 3D T1-weighted sequence (e.g., MPRAGE) acquired at 1 mm isotropic or higher resolution.
- Analysis Software: NeuroQuant or similar FDA-cleared automated brain volumetry software.
- Processing: The T1-weighted image is uploaded to the software, which performs automated segmentation of hippocampal, cortical, and other subcortical volumes.
- Output: The software generates volumetric reports and age- and sex-matched normative reference data, providing z-scores to quantify the degree of atrophy in individual patients [106].
Visualizing the Research Workflow
The following diagram illustrates the integrated experimental and analytical workflow for using high-resolution MRI in neurological disorder research.
High-Resolution MRI Research Workflow
The Scientist's Toolkit: Essential Research Reagents & Solutions
This section details key computational and analytical tools critical for conducting the experiments described in this guide.
Table 3: Essential Research Reagents and Solutions
| Tool/Solution | Category | Primary Function in Research | Example Use Case |
|---|---|---|---|
| NeuroQuant | Automated Volumetry Software | Provides FDA-cleared, automated segmentation of brain structures from 3D T1-weighted MRI. | Quantifying hippocampal volume loss in Mild Cognitive Impairment (MCI) and Alzheimer's disease [106]. |
| FreeSurfer | Research Image Analysis Suite | Provides a comprehensive toolkit for cortical reconstruction and subcortical volumetric segmentation. | Used as a gold-standard research tool for validating automated volumetry methods [106]. |
| Normative Modeling Frameworks | Statistical Analysis Tool | Models inter-subject variability in brain measures to identify extreme deviations at the individual level. | Identifying subtle, patient-specific abnormalities in epilepsy that deviate from a healthy population model [107]. |
| Differential Tractography | Advanced MRI Analysis | Tracks changes in the number and size of white matter connections over time from diffusion MRI data. | Serving as an imaging marker for tissue degeneration in clinical trials for rare neurological diseases [110]. |
| Quantitative Susceptibility Mapping (QSM) | Post-Processing Technique | Quantifies magnetic susceptibility from phase MRI data to map iron and calcification in the brain. | Precisely measuring iron deposition in the substantia nigra in Parkinson's disease [109]. |
| Deep Learning Reconstruction | AI-Based Software | Reduces scan times and enhances image resolution/contrast by mitigating noise and artifacts. | Generating high-quality images from shorter acquisitions, improving patient throughput and comfort [105]. |
Hepatocellular carcinoma (HCC) represents a significant global health challenge, ranking as the sixth most prevalent malignant tumor and the third leading cause of cancer-related mortality worldwide [111]. The insidious onset of HCC, characterized by nonspecific early symptoms, often leads to late-stage detection, which significantly limits treatment efficacy and contributes to poor prognosis [111]. Within this clinical context, imaging modalities play a vital role in detecting HCC characteristics, aiding in early detection, detailed visualization, and accurate differentiation of liver lesions [112].
Magnetic Resonance Imaging (MRI) has emerged as a cornerstone in liver cancer diagnosis, offering exceptional soft tissue contrast without employing ionizing radiation [45]. This case study objectively compares MRI's performance against alternative imaging modalities for lesion delineation, characterization, and staging in liver cancer, situating the analysis within broader research on high-resolution MRI versus standard-resolution tissue specificity. The assessment focuses on technological advancements that enhance diagnostic precision, ultimately informing clinical decision-making for researchers, scientists, and drug development professionals engaged in oncologic imaging.
Comparative Performance of Imaging Modalities
Diagnostic Performance Comparison
The selection of an imaging modality for liver cancer evaluation balances diagnostic accuracy, safety, accessibility, and cost. Table 1 summarizes the key characteristics and performance metrics of primary imaging modalities used in HCC detection and characterization.
Table 1: Comparative Diagnostic Performance of Imaging Modalities in Liver Cancer
| Imaging Modality | Reported Sensitivity for Early-Stage HCC | Key Diagnostic Features | Advantages | Limitations |
|---|---|---|---|---|
| Ultrasound (US) | 47%-63% [113] | B-mode morphology, vasculature on Doppler | No radiation, low cost, real-time imaging | Operator dependency, limited sonic window, low sensitivity for very early HCC |
| Contrast-Enhanced CT (CECT) | Not explicitly quantified in results | Hypervascularity in arterial phase, washout in portal/delayed phase [114] | Fast acquisition, widely available, excellent for vascular assessment | Ionizing radiation, risk of contrast nephropathy, inferior soft-tissue contrast vs. MRI [114] |
| Magnetic Resonance Imaging (MRI) | Superior to CT [45] [111] | Hypervascularity, washout, capsule appearance, tissue cellularity (DWI), hepatobiliary function | No radiation, superior soft-tissue contrast, multi-parametric functional data | Higher cost, longer scan time, limited accessibility, contrast risks in severe renal dysfunction [114] |
Ultrasound, while recommended for surveillance due to its non-invasive nature and low cost, demonstrates significant limitations in sensitivity, particularly for very early-stage HCC [113]. A meta-analysis by Tzartzeva et al. reported US sensitivity for detecting early-stage HCC is only 47% [113]. CT offers faster imaging and is excellent for vascular assessment but involves ionizing radiation and provides inferior soft-tissue contrast compared to MRI [114].
MRI is consistently identified as the most sensitive non-invasive method for detecting and characterizing focal liver lesions [115]. Its superiority stems from high soft tissue contrast and the ability to perform multi-parametric imaging, combining morphological and functional data [45] [115]. This capability is crucial for distinguishing between benign and malignant lesions, assessing tumor heterogeneity, and detecting lesions under 1 cm, which are often missed by other modalities [114].
Technical Comparison of Advanced MRI Techniques
Technological advancements have significantly expanded MRI's diagnostic capabilities beyond anatomical imaging. Table 2 outlines key functional MRI techniques that contribute to improved lesion characterization.
Table 2: Technical Specifications of Advanced MRI Sequences for Liver Cancer
| MRI Sequence/Technique | Underlying Biophysical Principle | Extracted Quantitative Parameters | Clinical Application in Liver Oncology |
|---|---|---|---|
| Diffusion-Weighted Imaging (DWI) | Measures Brownian motion of water molecules [45] | Apparent Diffusion Coefficient (ADC) values | Detects restricted diffusion in hypercellular malignant lesions; high sensitivity for small lesions [45] [115] |
| Dynamic Contrast-Enhanced (DCE-MRI) | Tracks kinetics of contrast agent uptake/washout [45] | Perfusion parameters (e.g., Ktrans), time-intensity curves | Assesses tumor vascularity, permeability, and hemodynamics; differentiates benign from malignant lesions [45] |
| Hepatobiliary Contrast Agents (HBA) | Uptake by organic anion transporting polypeptides (OATPs) in functioning hepatocytes [116] | Signal intensity in hepatobiliary phase | Improves lesion conspicuity and characterization; identifies well-differentiated HCC with preserved OATP expression [116] |
| Magnetic Resonance Elastography (MRE) | Measures propagation of shear waves to assess tissue stiffness [114] | Liver stiffness (in kilopascals) | Evaluates background liver fibrosis/cirrhosis, a key HCC risk factor; can aid in tumor characterization [114] |
The combination of these techniques within a single examination provides a comprehensive diagnostic profile of liver lesions. For instance, DWI is highly sensitive for detecting small lesions, while DCE-MRI and hepatobiliary phase imaging with specific contrast agents are crucial for confirming malignancy and characterizing the specific type of tumor [45] [115]. The functional data from these sequences offer insights into tumor cellularity, perfusion, and hepatocyte function, which are invaluable for diagnosis, staging, and treatment planning.
Experimental Protocols and Methodologies
Standardized MRI Acquisition Protocol
A diagnostic liver MRI protocol for oncology integrates conventional and advanced sequences to maximize information yield. A standard protocol should include [115]:
- Conventional Sequences: T2-weighted (T2W) sequences with and without fat suppression (FS), and in-phase and opposed-phase gradient-echo T1 sequences. These provide fundamental anatomical information and can detect fat or iron deposition.
- Functional/Diffusion Sequences: Diffusion-weighted imaging (DWI) is considered mandatory, particularly for detecting very small lesions, though diffusion restriction is not synonymous with malignancy [115].
- Dynamic Contrast-Enhanced (DCE) Series: Post-contrast T1-weighted imaging is the cornerstone for lesion categorization. A typical dynamic protocol includes:
- Arterial Phase: Captured when contrast reaches the abdominal aorta, highlighting hypervascular lesions like HCC.
- Portal Venous Phase: Occurs 60-80 seconds post-injection, showing washout of contrast in malignancies.
- Delayed Phase: Several minutes post-injection, useful for assessing the capsule in HCC and other features.
- Hepatobiliary Phase: Specific to hepatobiliary agents (e.g., gadoxetic acid), acquired 10-20 minutes post-injection, where functioning liver parenchyma retains contrast while lesions typically do not [116] [115].
Abbreviated MRI (AMRI) Protocol
To address challenges of cost and accessibility, Abbreviated MRI (AMRI) protocols have been developed for HCC surveillance. These are based on the premise that essential diagnostic information can be acquired in a shorter examination time using only selected sequences from a standard protocol [113] [115]. A typical AMRI protocol might include only T2-weighted, DWI, and dynamic T1-weighted post-contrast sequences, omitting non-essential sequences to reduce scan time without significantly compromising sensitivity for detecting HCC [113].
Signaling Pathways and Their Visualization in MRI
Molecular Correlates of Contrast Agent Uptake
A critical advancement in liver MRI is the understanding of the molecular pathways that link tumor biology to imaging phenotypes. A key relationship exists between the Wnt/β-catenin signaling pathway and the expression of the organic anion transporting polypeptide 1B3 (OATP1B3), which is the transporter responsible for the uptake of hepatobiliary contrast agents (e.g., gadoxetic acid) into hepatocytes [116].
HCC subtypes with activated β-catenin signaling often demonstrate preserved OATP1B3 expression. Consequently, these tumors may show uptake of hepatobiliary contrast agent in the delayed phase, appearing isointense or even hyperintense relative to the background liver—a feature associated with well-differentiated tumors [116]. This provides a non-invasive imaging biomarker for predicting tumor genetics and biology.
Diagram 1: Molecular Pathway Linking Wnt/β-catenin Signaling to MRI Phenotype. This diagram illustrates the connection between activated Wnt/β-catenin signaling in HCC, preserved expression of the OATP1B3 transporter, uptake of hepatobiliary-specific contrast agents, and the resulting well-differentiated tumor phenotype observed on MRI.
The Scientist's Toolkit: Essential Research Reagents and Materials
The application and development of advanced MRI techniques in liver oncology rely on a suite of specialized reagents and materials. Table 3 details key components of the research toolkit.
Table 3: Essential Research Reagents and Materials for Liver MRI Studies
| Tool/Reagent | Function/Description | Application in Liver Cancer Research |
|---|---|---|
| Gadolinium-Based Contrast Agents | Paramagnetic agents that shorten T1 relaxation time, enhancing tissue visibility. | Dynamic perfusion assessment (non-specific agents) and hepatobiliary phase imaging (liver-specific agents) for lesion detection and characterization [116] [115]. |
| Diffusion-Weighted Imaging (DWI) Sequences | MRI pulse sequences sensitive to random Brownian motion of water molecules in tissue. | Quantification of tissue cellularity and integrity via Apparent Diffusion Coefficient (ADC) maps; used for lesion detection and treatment response assessment [45] [111]. |
| Image Segmentation Software (e.g., ITK-SNAP, 3D Slicer) | Software for delineating Regions of Interest (ROIs) around tumors or normal tissues on imaging data. | Essential for radiomics feature extraction, volumetric analysis, and precise treatment planning [111]. |
| Radiomics Feature Extraction Platforms (e.g., PyRadiomics) | Computational platforms for high-throughput extraction of quantitative features from medical images. | Enables extraction of shape, texture, and intensity features from segmented lesions to build predictive models for diagnosis, prognosis, and treatment response [111]. |
This case study demonstrates that MRI offers superior lesion delineation, characterization, and staging capabilities in liver oncology compared to standard alternatives like ultrasound and CT. Its strength lies in its multi-parametric nature, combining high-resolution anatomical imaging with functional data on tissue cellularity, perfusion, and molecular expression. The integration of advanced techniques such as DWI, DCE-MRI, and hepatobiliary-specific contrast agents provides a non-invasive "virtual biopsy," yielding insights into tumor biology and heterogeneity.
Ongoing developments in abbreviated protocols aim to improve accessibility and cost-effectiveness, while the emergence of radiomics and artificial intelligence promises to further refine diagnostic accuracy and predictive power. As these technologies mature and become standardized, high-resolution MRI is poised to deepen its role as an indispensable tool in personalized liver cancer care, from early detection and diagnosis to treatment guidance and response monitoring.
Biomarkers have evolved into a significant component of neurological drug development and regulatory evaluation, with expanded roles and increasing impact over the past 15 years [117]. The path to biomarker qualification represents a rigorous process through which measurable indicators of biological processes gain regulatory acceptance for specific contexts of use in drug development programs. Under the FDA's Drug Development Tool (DDT) qualification program established by the 21st Century Cures Act, biomarker qualification provides a formal framework for concluding that within a stated context of use, the biomarker can be relied upon to have a specific interpretation and application in drug development and regulatory review [118]. This process is particularly crucial for biomarkers used in enrichment strategies and as efficacy endpoints, where they can significantly accelerate drug development timelines and improve the precision of therapeutic evaluation.
The growing importance of biomarkers is evidenced by the increasing trend of their incorporation into regulatory submissions. Between 2008 and 2024, 37 New Molecular Entity submissions for neurological diseases included biomarker data reviewed by the FDA, with 29 incorporating biomarkers into their official labeling [117]. This landscape analysis examines the regulatory pathway, technical requirements, and practical applications of qualified biomarkers, with particular attention to the role of advanced imaging technologies in enhancing tissue specificity and biomarker qualification.
The Regulatory Framework for Biomarker Qualification
FDA Biomarker Qualification Program Structure
The Drug Development Tool (DDT) qualification program operates through a structured process with defined stages and requirements. Qualification is a conclusion that within the stated context of use, the DDT can be relied upon to have a specific interpretation and application in drug development and regulatory review [118]. The program's mission includes qualifying and making DDTs publicly available for specific contexts of use to expedite drug development and review of regulatory applications, while providing a framework for early engagement and scientific collaboration with the FDA to facilitate DDT development [118].
The qualification process specifically aims to encourage the formation of collaborative groups to undertake DDT development programs, thereby increasing efficiency and lessening the individual resource burden incumbent with DDT development [118]. This collaborative approach is essential given that the resources needed to develop a qualified DDT are often beyond the capabilities of a single entity [118].
Table 1: Key Roles of Biomarkers in Regulatory Decision-Making Based on Neurological NME Approvals (2008-2024)
| Role | Definition | Representative Examples |
|---|---|---|
| Surrogate Endpoint | Biomarker that predicts clinical benefit but is not itself a measure of clinical benefit [117] | Reduction in brain amyloid beta plaque for Alzheimer's disease (lecanemab); dystrophin production for Duchenne muscular dystrophy [117] |
| Confirmatory Evidence | Supports approval of a single adequate and well-controlled clinical investigation [117] | Reduction in serum transthyretin (TTR) for polyneuropathy (patisiran, vutrisiran, eplontersen) [117] |
| Dose Selection | Informs optimal dosing strategies in early-phase clinical trials [117] | B-cell counts for CD20-targeting monoclonal antibodies in multiple sclerosis [117] |
Context of Use Definition
A fundamental aspect of biomarker qualification is the precise definition of the "context of use" (COU). The context of use statement describes all elements characterizing the purpose and manner of use for a DDT, establishing the boundaries within which available data adequately justify use of the tool [118]. This specificity ensures that qualified biomarkers are applied appropriately within the validated parameters of their performance characteristics.
As additional data from studies become available over time, requestors may continue working within the DDT qualification program to submit new projects with additional data to expand upon a qualified context of use [118]. This allows for the evolution of biomarker applications as evidence accumulates.
Methodological Considerations for Biomarker Development
Technical Validation Requirements
The validation of imaging biomarkers requires careful attention to both high-contrast and low-contrast resolution capabilities. High-contrast resolution refers to the ability to detect finely spaced lines or holes with signals that differ considerably from background, while low-contrast resolution describes the ability to detect and discern objects with only subtle differences in signal intensity [119].
For MRI-based biomarkers, standardization of intensity values across different scanners and platforms is essential for ensuring reproducible results. The STI (Standardization of Intensities) technique has demonstrated superiority over conventional histogram-matching methods by incorporating tissue spatial intensity information, showing significantly better intensity matching for brain white matter with respect to a standard image [61]. This approach uses joint intensity histograms to determine intensity correspondence in each tissue between input and standard images, addressing the challenge of scanner-dependent intensity variations in multicentric settings [61].
Advanced Imaging Approaches
High-field MRI systems (3T and higher) with specialized coils and pulse sequences enable the development of more sensitive biomarkers for tissue characterization [59]. These systems provide increased spatial resolution and improved signal-to-noise ratio, which are particularly valuable for neurological applications [58]. The clinical use of ultra-high field strengths (7T and higher) has been mostly restricted to the brain due to technical challenges related to radiofrequency wavelength limitations in whole-body applications [58].
Advanced magnetic resonance spectroscopy at higher magnetic field strengths gains both sensitivity (increased signal-to-noise) and specificity (increased chemical shift dispersion), enabling detection of dilute (millimolar concentration) metabolites that serve as important biomarkers for tissue characterization [58]. Quantitative mapping techniques such as T1-mapping and T2-mapping represent a new frontier for tissue characterization, offering direct quantitative assessment of myocardial tissue properties in absolute terms rather than just qualitative or semiquantitative evaluation [120].
Diagram 1: The biomarker qualification pathway involves defined stages from discovery through regulatory endorsement.
Biomarker Applications in Clinical Trials and Endpoint Determination
Efficacy Endpoints and Surrogate Markers
Time-to-event endpoints are widely used as measures of patients' well-being and indicators of prognosis in imaging-based biomarker studies [121]. These survival endpoints include overall survival (OS), progression-free survival (PFS), recurrence-free survival (RFS), event-free survival (EFS), and disease-free survival (DFS), each with specific applications and limitations in clinical trials [121].
The use of biomarkers as surrogate endpoints has become increasingly important in therapeutic areas where traditional clinical endpoints require extended observation periods. For example, in Alzheimer's disease, reduction of brain amyloid beta (Aβ) plaque observed through positron emission tomography (PET) imaging served as a surrogate endpoint for the accelerated approval of lecanemab, with dose- and time-dependent decreases in Aβ plaque demonstrating drug efficacy [117]. Similarly, dystrophin protein production has been accepted as a surrogate endpoint for novel therapies treating Duchenne muscular dystrophy [117].
Biomarkers for Patient Stratification and Enrichment
In prostate cancer diagnosis, biomarkers such as the Prostate Health Index (phi) and PSA density (PSAd) have demonstrated utility in refining and tiering referrals for tertiary imaging and biopsy after a raised PSA test [122]. The incremental value of these biomarkers varies depending on the definition of clinical significance and is particularly useful when composite prognostic endpoints are used [122]. These approaches can significantly reduce unnecessary investigations while maintaining sensitivity for detecting clinically significant disease.
Table 2: Comparison of Biomarker Performance in Prostate Cancer Detection (n=798 men)
| Biomarker | Base Model (PSA + Age) AUC for ≥GG2 | Base Model + Biomarker AUC for ≥GG2 | Impact on ≥CPG3 Detection |
|---|---|---|---|
| phi | 0.66 | 0.82 | Significant improvement, particularly useful with composite prognostic endpoints [122] |
| PSAd | 0.66 | 0.79 | Effective at reducing use of MRI and/or biopsies [122] |
| FTPSA | 0.66 | Minimal improvement | Limited value for ≥GG3 and ≥CPG3 disease [122] |
| PRS | 0.66 | Minimal improvement | Limited value for ≥GG3 and ≥CPG3 disease [122] |
High-Resolution MRI vs Standard Resolution in Tissue Specificity Research
Technical Advantages of High-Resolution MRI
High-resolution magnetic resonance imaging (HRMRI) performed on high-field strength MRI scanners (usually 3T or higher) with specialized coils and pulse sequences has emerged as a promising technique for evaluating cerebrovascular disease [59]. HRMRI can identify stroke mechanisms, determine the extent and pathology of stenosis, and recognize plaque characteristics that cannot be visualized by conventional imaging methods [59].
The increased spatial resolution of high-field systems enables detailed characterization of substructures of the hippocampus, cortical layer determination, and identification of abnormalities in subtle vascular structures [58]. For multiple sclerosis, higher resolution is particularly valuable for early assessment of the onset of abnormal phenotypes of the brain and for resolving the paradox of the apparent dissociation between pathology in the white matter and gray matter [58].
Quantitative Biomarker Applications
Quantitative MRI techniques benefit substantially from higher field strengths. Magnetic resonance spectroscopy at higher magnetic field strengths gains in both sensitivity (increased signal-to-noise) and specificity (increased chemical shift dispersion), enabling detection of neurotransmitters such as glutamate and GABA that are valuable biomarkers in neurological disorders [58]. Super-resolution techniques using deep learning can maintain adequate signal-to-noise ratio for accurate quantification of relaxation time biomarkers while simultaneously generating high-resolution images, potentially accelerating MRI scans and enhancing the value of clinical and research MRI [123].
In cardiac applications, parametric T1-mapping and T2-mapping techniques enable direct quantitative assessment of myocardial tissue properties, providing absolute quantitative measures rather than just qualitative or semiquantitative evaluations [120]. Native T1 mapping has demonstrated superior sensitivity compared with T2-weighted and late gadolinium enhancement techniques in detecting acute myocarditis, and significantly elevated T1 values have been reported in patients with dilated cardiomyopathy, hypertrophic cardiomyopathy, and cardiac amyloidosis compared with normal controls [120].
Essential Research Reagents and Materials
Table 3: Key Research Reagent Solutions for Biomarker Development Studies
| Reagent/Material | Function and Application | Technical Specifications |
|---|---|---|
| High-Field MRI Systems | Provides increased spatial resolution and signal-to-noise ratio for tissue characterization [59] [58] | Typically 3T or higher with specialized surface coils [59] |
| Phantom Test Objects | Measure high-contrast and low-contrast resolution capabilities of imaging systems [119] | ACR phantom with holes 0.9-1.1 mm diameter spaced 1.0 mm apart [119] |
| Standardized Image Analysis Software | Intensity standardization and joint histogram analysis for multicentric studies [61] | STI algorithm for spatial tissue intensity matching [61] |
| Modified Look-Locker Inversion Recovery (MOLLI) | Myocardial T1-mapping for quantitative tissue characterization [120] | Enables quantification of native T1 and extracellular volume fraction [120] |
| Liaison Assays | Quantitative measurement of protein biomarkers in blood samples [122] | Total and free PSA assays for prostate cancer biomarker studies [122] |
Diagram 2: Comparative capabilities of high-resolution versus standard resolution MRI in biomarker development.
The landscape of biomarker qualification continues to evolve with increasing recognition of their value in drug development programs. The growing acceptance of biomarkers as surrogate endpoints and confirmatory evidence reflects expanding knowledge and confidence in their ability to predict clinical outcomes and inform therapeutic decisions [117]. However, several challenges hinder the effective utilization of biomarker data, including lack of established clinical relevance, variability in data quality, and bioanalytical issues [117].
Addressing these challenges will require cross-sector collaboration, rigorous analytical validation, and clear demonstration of the linkage between biomarker changes and meaningful clinical benefits [117]. The continued development of advanced imaging technologies, particularly high-resolution MRI with quantitative mapping capabilities, promises to enhance tissue specificity and provide more sensitive biomarkers for early therapeutic intervention. As biomarker qualification programs mature and evidence accumulates, these tools are poised to significantly accelerate innovative drug development across neurological diseases and other therapeutic areas with high unmet medical needs.
Magnetic resonance imaging (MRI) stands as a cornerstone of modern diagnostic medicine and biomedical research, yet the field is characterized by a fundamental trade-off between the exceptional tissue specificity of high- and ultra-high-field systems and the practical constraints of cost, accessibility, and workflow efficiency. For researchers, scientists, and drug development professionals, selecting the appropriate MRI technology requires a nuanced analysis of these competing factors based on specific research objectives and operational constraints. This guide provides a comprehensive comparison of MRI field strengths, synthesizing current experimental data to objectively inform technology selection for research applications. The analysis is framed within the broader thesis of high-resolution versus standard-resolution MRI, focusing on how these technologies serve different needs across the research continuum from basic science to clinical translation.
Technical Performance: Specificity and Resolution Gains
High-Field and Ultra-High-Field MRI Performance
High-field (≥3T) and ultra-high-field (≥7T) MRI systems offer significant advantages in image quality and biological specificity that are critical for advanced research applications. These systems leverage increased signal-to-noise ratio (SNR) and contrast-to-noise ratio (CNR) to reveal anatomical and physiological details not visible at lower field strengths [124] [18]. The enhanced sensitivity at higher fields is particularly valuable for visualizing small anatomical structures, detecting subtle pathologies, and advancing quantitative imaging biomarkers [125].
In neurology research, 7T systems provide unparalleled detail in brain imaging, enabling researchers to study complex neurological disorders with unprecedented resolution [124]. These systems excel in susceptibility-weighted imaging and phase-contrast techniques that leverage the enhanced magnetic susceptibility effects at higher fields [126]. The gains in SNR and CNR also benefit metabolic studies through MR spectroscopy (MRS), functional MRI (fMRI), and chemical exchange saturation transfer (CEST) imaging, allowing detection of smaller physiological effects and finer structures [126].
Quantitative Performance Comparison
Table 1: Technical Performance Characteristics by Field Strength
| Performance Metric | Ultra-Low-Field (<0.1T) | Standard-Field (1.5T) | High-Field (3T) | Ultra-High-Field (≥7T) |
|---|---|---|---|---|
| Spatial Resolution | Limited (clinical applications progressing) [127] | Standard (diagnostic quality) | Superior (high-resolution imaging) [59] [124] | Exceptional (micro-imaging capable) [126] |
| Signal-to-Noise Ratio | Lower [127] | Moderate | High (approximately 2x 1.5T) [18] | Very high (increasing linearly with field strength) [126] |
| Contrast-to-Noise Ratio | Variable | Moderate | High (enhanced contrast mechanisms) [18] | Highest (novel contrast mechanisms) [126] |
| Susceptibility Sensitivity | Reduced | Moderate | High | Exceptional (blooming effect) [126] |
| Spectroscopic Resolution | Limited | Adequate for major metabolites | Good for neurochemical profiling | Superior (improved spectral dispersion) [126] |
Tissue Specificity and Plaque Characterization
High-resolution MRI (HRMRI) at 3T and above enables direct assessment of vessel walls and detailed characterization of cerebral arterial disease, providing critical insights into stroke mechanisms that conventional imaging cannot visualize [59]. Through multi-contrast weighted imaging including T1-weighted (T1WI), T2-weighted (T2WI), contrast-enhanced T1WI (CE-T1WI), proton density-weighted imaging (PDWI), and time-of-flight (TOF) sequences, HRMRI can identify vulnerable plaque components such as lipid-rich necrotic cores, intraplaque hemorrhage, and thin fibrous caps that predict rupture risk [59].
Table 2: Plaque Component Signal Characteristics on HRMRI
| Plaque Component | TOF | T1WI | T2WI | PDWI | CE-T1WI |
|---|---|---|---|---|---|
| Lipid Cores | Isointensity | Isointensity/Hyperintensity | Hypointensity | Isointensity/Hyperintensity | - |
| Fibrous Caps | Isointensity | Isointensity/Hyperintensity | Isointensity/Hyperintensity | Isointensity/Hyperintensity | Enhancement (+) |
| Intraplaque Hemorrhage (Fresh) | Hyperintensity | Hyperintensity | Isointensity/Hypointensity | Isointensity/Hypointensity | - |
| Intraplaque Hemorrhage (Recent) | Hyperintensity | Hyperintensity | Hyperintensity | Hyperintensity | - |
| Calcification | Heavy Hypointensity | Heavy Hypointensity | Heavy Hypointensity | Heavy Hypointensity | - |
The capability to characterize plaque composition has significant implications for pharmaceutical development, particularly in evaluating novel cardiovascular therapeutics. HRMRI has been utilized in clinical trials to monitor the effects of lipid-lowering therapies on plaque volume and composition, serving as a non-invasive endpoint for drug efficacy [59].
Accessibility, Workflow, and Operational Constraints
Economic and Infrastructure Barriers
The exceptional performance of high-field and ultra-high-field MRI systems comes with substantial economic and infrastructure requirements that directly impact their accessibility for research institutions. High-field systems require significant capital investment, specialized infrastructure including magnetic shielding, and higher maintenance costs compared to standard-field systems [124]. These constraints create notable disparities in global research capabilities, with low- and middle-income countries (LMICs) having only 1.12 MRI units per million population compared to 26.53 units per million in high-income countries [127].
Ultra-low-field (ULF) MRI systems (<0.1T) have emerged as a promising alternative to address these accessibility challenges. These portable, cost-effective systems can be deployed in diverse settings including intensive care units, community centers, and resource-limited environments [127]. While ULF-MRI currently faces limitations in signal-to-noise ratio and spatial resolution compared to high-field systems, technological advancements in reconstruction methods and machine learning integration are rapidly closing this performance gap [127].
Workflow Efficiency and Operational Considerations
Workflow efficiency represents a critical factor in research productivity, particularly in high-volume imaging studies. Conventional MRI setups, where patient positioning and preparation occur directly in the scanner room, create significant workflow delays that cascade through research protocols [128]. A recent study demonstrated that optimized facility designs incorporating innovative elements such as dockable tables and dedicated preparation bays can dramatically improve workflow metrics.
Table 3: Workflow Efficiency Comparison Between Conventional and Optimized MRI Facilities
| Workflow Metric | Reference Facility (Conventional Design) | Optimized Facility (Innovative Design) | Improvement |
|---|---|---|---|
| Mean Table Turnaround Time | 8.3 minutes | 4.6 minutes | 44.6% reduction [128] |
| Total Process Cycle (Liver MRI) | 32.7 minutes | 30.6 minutes | 6.4% reduction [128] |
| Total Process Cycle (Prostate MRI) | 36.4 minutes | 32.5 minutes | 10.7% reduction [128] |
| On-Time Performance | 66.0% | 79.4% | 13.4% improvement [128] |
| Turnaround ≤1 minute | 0.6% of exams | 37.2% of exams | 62x improvement [128] |
Advanced scheduling optimization through digital twin simulations and reinforcement learning agents can further enhance workflow efficiency, demonstrating potential increases in MRI machine utilization by 14.5% and reductions in average patient waiting time by 44.8% compared to traditional first-come-first-served approaches [129]. These operational improvements directly impact research throughput and cost-effectiveness, particularly in large-scale studies requiring high-volume imaging.
Technical and Physiological Constraints
Ultra-high-field MRI (≥7T) presents unique technical challenges including radiofrequency (RF) field non-uniformity, enhanced susceptibility artifacts, and higher specific absorption rate (SAR) leading to increased tissue heating [126]. These constraints require specialized technical expertise and advanced methodological developments such as parallel transmission technology and sophisticated motion correction techniques to mitigate [126].
Patient comfort and safety considerations also impact research protocols. Conventional high-field MRI systems generate significant acoustic noise that can intensify patient anxiety, cause movement artifacts, and potentially compromise data quality [18]. Silent Scan technologies that continuously adjust gradients in small steps can reduce acoustic noise to near-ambient levels while maintaining diagnostic image quality comparable to conventional sequences, thereby improving participant experience in research studies [18].
Experimental Protocols and Methodologies
High-Resolution Vessel Wall Imaging Protocol
The implementation of HRMRI for vessel wall imaging requires standardized protocols to ensure reproducible results in multi-center research trials. The following methodology represents a comprehensive approach for plaque characterization:
Pulse Sequences: The protocol should include 3D time-of-flight (TOF) magnetic resonance angiography for localization, followed by multi-contrast weighted imaging: T1-weighted imaging (T1WI), T2-weighted imaging (T2WI), contrast-enhanced T1WI (CE-T1WI), and proton density-weighted imaging (PDWI) [59]. These sequences are typically performed on high-field strength MRI scanners (3T or higher) with specialized coils [59].
Image Analysis: Quantitative assessment includes measurement of luminal stenosis, plaque burden, and component analysis. Vulnerable plaques are identified by specific criteria: large lipid-rich necrotic core (isointense on TOF, isointense/hyperintense on T1WI, hypointense on T2WI), intraplaque hemorrhage (signal characteristics dependent on age), and thin or ruptured fibrous caps (enhancing on CE-T1WI) [59]. Automated plaque segmentation algorithms enable repeated measurements of plaque volume and composition for longitudinal studies [59].
Validation: Histopathological correlation remains the gold standard for validating plaque characteristics identified on HRMRI. Studies have demonstrated good correlation between HRMRI definitions of vulnerable plaque components and pathological specimens, with high sensitivity (81-91%) and specificity (83-90%) for identifying unstable features [59].
Quantitative MRI (qMRI) Validation Framework
Quantitative MRI techniques face particular challenges in validation and reproducibility across sites and platforms. A rigorous methodological framework is essential for producing reliable research outcomes:
Confounding Factor Assessment: Systematically identify and quantify sources of variation including scanner instabilities, physiological noise, and modeling choices [125]. Implement correction strategies through standardized pipelines that address these confounds [125].
Phantom Validation: Utilize phantom-based calibrations to establish technical performance characteristics including bias, noise, and repeatability [125]. This establishes a metrological foundation for qMRI values across different scanner platforms and field strengths.
Multi-Site Harmonization: Implement harmonization strategies using integrated frameworks such as Pulseq and Gadgetron with automated post-processing pipelines [125]. For retrospective harmonization, apply statistical corrections in image or feature space while rigorously validating against site predictability metrics and traveling-heads studies [125].
Clinical Validation: Establish interpretable quantitative values contextualized with normative ranges across populations [125]. Ensure measurements are traceable to validated standards through engagement of medical physicists throughout the validation process.
Research Reagent Solutions
Table 4: Essential Research Reagents and Materials for MRI Studies
| Reagent/Material | Function/Application | Research Considerations |
|---|---|---|
| Gadoterate Meglumine | Extracellular contrast agent for dynamic contrast-enhanced MRI (liver protocols) [128] | Standard dose: 0.1 mmol/kg; injection rate: 1-2 mL/s; enables perfusion assessment and vascular characterization |
| Gadobutrol | High-relaxivity contrast agent for dedicated vascular imaging (prostate protocols) [128] | Standard dose: 0.1 mmol/kg; injection rate: 2 mL/s; provides enhanced vascular characterization |
| Deep Learning Reconstruction Algorithms | Accelerated image acquisition and enhanced image quality [128] | Reduces acquisition time while maintaining diagnostic quality; requires validation for specific research applications |
| Phantom Validation Systems | Quantitative calibration and cross-site harmonization [125] | Essential for multi-center trials; ensures measurement reliability across different scanner platforms |
| Silent Scan Sequences | Acoustic noise reduction for improved participant comfort [18] | Reduces anxiety and motion artifacts; maintains diagnostic quality with increased CNR for certain applications |
Integrated Decision Framework
The choice between high-specificity MRI systems and more accessible alternatives requires a structured approach based on research priorities, budget constraints, and practical considerations. The following diagram illustrates the key decision factors and their relationships:
MRI Technology Selection Pathway
For research requiring maximal biological specificity, particularly in neurology, cardiovascular imaging, and quantitative biomarker development, high-field (3T) and ultra-high-field (≥7T) systems provide necessary performance despite their substantial infrastructure requirements and operational constraints [59] [126]. When accessibility, cost-effectiveness, and workflow efficiency are prioritized, particularly in resource-limited settings or high-throughput studies, standard-field (1.5T) systems with optimized protocols offer a balanced solution [128]. For point-of-care research, pediatric imaging, or studies where participant mobility is constrained, emerging ultra-low-field technology presents a viable alternative with rapidly improving capabilities [127].
The cost-benefit analysis between high-specificity MRI systems and more accessible alternatives reveals a complex landscape where optimal technology selection depends heavily on specific research objectives and operational contexts. High-field and ultra-high-field systems deliver unparalleled gains in tissue specificity and resolution that are indispensable for advanced neuroscience, cardiovascular research, and quantitative biomarker development. Conversely, standard-field systems with optimized workflows and emerging ultra-low-field technologies address critical needs in accessibility, cost-effectiveness, and operational efficiency. For the research community, strategic investment in harmonization protocols, standardized validation frameworks, and cross-platform comparison studies will maximize the return on either technological pathway. The evolving MRI landscape continues to offer researchers increasingly sophisticated tools, with the fundamental trade-off between specificity and accessibility remaining a central consideration in experimental design and technology implementation.
Conclusion
The advancement from standard to high-resolution MRI represents a paradigm shift in non-invasive tissue characterization, offering unprecedented specificity that is directly translatable to biomedical research and drug development. The integration of ultra-high-field systems, innovative hardware, and sophisticated acquisition and analysis methods allows for the visualization of pathology and physiology at a mesoscopic scale. While challenges in standardization, artifact management, and accessibility persist, ongoing developments in AI, accelerated imaging, and multimodal integration are poised to overcome these hurdles. The validated role of high-resolution MRI as a fit-for-purpose biomarker is already de-risking clinical trials and enhancing decision-making. Future directions will likely focus on greater automation, the discovery of novel endogenous contrast mechanisms, and the democratization of these powerful technologies to further personalize medicine and accelerate therapeutic discovery.
References
- 1. Ultra-High-Field MR Neuroimaging - PMC - PubMed Central [https://pmc.ncbi.nlm.nih.gov/articles/PMC4472608/]
- 2. High-resolution T1-, T2-, and T2*-weighted anatomical ... [https://www.sciencedirect.com/science/article/abs/pii/B9780323998987000067]
- 3. Signal-to-noise ratio versus field strength for small surface ... [https://pubmed.ncbi.nlm.nih.gov/38716493/]
- 4. Next-generation MRI scanner designed for ultra-high ... [https://www.nature.com/articles/s41592-023-02068-7]
- 5. SNR versus resolution in 3D 1H MRS of the human brain at ... [https://pubmed.ncbi.nlm.nih.gov/11746567/]
- 6. Signal-to-Noise Ratio (SNR) in MRI | Factors affecting SNR [https://mrimaster.com/snr/]
- 7. QIN. Signal-to-Noise Ratio, Contrast-to ... - PubMed Central [https://pmc.ncbi.nlm.nih.gov/articles/PMC3532862/]
- 8. Advancing 1.5T MR imaging: toward achieving 3T quality ... [https://www.frontiersin.org/journals/human-neuroscience/articles/10.3389/fnhum.2025.1532395/full]
- 9. Evaluating the effect of voxel size on the accuracy of 3D ... [https://www.frontiersin.org/journals/radiology/articles/10.3389/fradi.2025.1618261/full]
- 10. Size and shape matter: The impact of voxel geometry on the ... [https://pmc.ncbi.nlm.nih.gov/articles/PMC6461289/]
- 11. Optimization of the SNR‐resolution tradeoff for registration of ... [https://pmc.ncbi.nlm.nih.gov/articles/PMC6870925/]
- 12. Assessing cerebral microvascular volumetric with high- ... [https://www.nature.com/articles/s44161-025-00722-1]
- 13. Choice of Voxel-based Morphometry processing pipeline ... [https://www.nature.com/articles/s42003-022-03880-1]
- 14. Transcriptomics: A Powerful Tool in Disease Understanding... Spatial [https://www.thno.org/v14p2946.htm]
- 15. Voxel Volume Overlap: Voxel‐Size Sensitive Indicators of ... [https://pmc.ncbi.nlm.nih.gov/articles/PMC12418571/]
- 16. Quantitative Susceptibility Mapping: Contrast Mechanisms ... [https://pmc.ncbi.nlm.nih.gov/articles/PMC4734903/]
- 17. Studying brain microstructure with magnetic susceptibility ... [https://www.sciencedirect.com/science/article/abs/pii/S105381191730157X]
- 18. Comparison of image quality characteristics on Silent MR ... [https://pmc.ncbi.nlm.nih.gov/articles/PMC5124822/]
- 19. Simultaneous Quantitative MRI Mapping of T1, T2* and ... [https://journals.plos.org/plosone/article?id=10.1371/journal.pone.0169265]
- 20. A Comprehensive Introduction to Magnetic Resonance ... [https://pmc.ncbi.nlm.nih.gov/articles/PMC9609087/]
- 21. Intrinsic Contrast - an overview [https://www.sciencedirect.com/topics/psychology/intrinsic-contrast]
- 22. Three-dimensional simultaneous brain mapping of T1, T2, T 2 ... [https://pubmed.ncbi.nlm.nih.gov/34708438/]
- 23. How do you perform a DSC perfusion study? [https://mriquestions.com/how-to-perform-dsc.html]
- 24. Unraveling the mesoscale resting-state functional ... [https://www.nature.com/articles/s42003-025-09108-2]
- 25. High-resolution quantitative and functional MRI indicate ... [https://elifesciences.org/articles/78756]
- 26. Anatomical Versus Functional Methods for Hippocampal ... [https://pmc.ncbi.nlm.nih.gov/articles/PMC12284728/]
- 27. High resolution data analysis strategies for mesoscale human ... [https://pmc.ncbi.nlm.nih.gov/articles/PMC5745233/]
- 28. High resolution data analysis strategies for mesoscale ... [https://www.sciencedirect.com/science/article/pii/S1053811917302811]
- 29. Mesoscale fMRI at ultra-high spatiotemporal resolutions ... [https://archive.ismrm.org/2025/1261.html]
- 30. ISMRM24 - Mesoscale fMRI [https://www.ismrm.org/24/pf/D-191.htm]
- 31. Comparison of diffusion MRI and CLARITY fiber orientation ... [https://www.sciencedirect.com/science/article/pii/S1053811920311770]
- 32. An improved asymmetric gradient coil design for high- ... [https://pubmed.ncbi.nlm.nih.gov/27910827/]
- 33. Asymmetric gradient coil design for use in a short, open ... [https://www.sciencedirect.com/science/article/abs/pii/S109078071630091X]
- 34. Developing an AI-empowered head-only ultra-high- ... [https://www.sciencedirect.com/science/article/pii/S105381192400048X]
- 35. Coil Design Considerations, Manufacturing & Limitations [https://cds.ismrm.org/protected/16MProceedings/PDFfiles/7104.html]
- 36. Reassessment of peripheral nerve stimulation thresholds ... [https://pmc.ncbi.nlm.nih.gov/articles/PMC12202733/]
- 37. Improving whole brain structural MRI at 4.7 Tesla using 4 ... [https://www.sciencedirect.com/science/article/abs/pii/S1053811906005015]
- 38. A local multi‐transmit coil combined with a high‐density ... [https://pmc.ncbi.nlm.nih.gov/articles/PMC8519055/]
- 39. High‐density MRI coil arrays with integrated field monitoring ... [https://pmc.ncbi.nlm.nih.gov/articles/PMC12393205/]
- 40. ISMRM25 - RF Arrays & Systems [https://www.ismrm.org/25/program-files/D-201.htm]
- 41. A supplemental receiver coil recovers frontal and ... [https://www.sciencedirect.com/science/article/pii/S0168010225001269]
- 42. Advanced preclinical functional magnetic resonance ... [https://pmc.ncbi.nlm.nih.gov/articles/PMC12177068/]
- 43. New Functional MRI Experiments Based on Fractional ... [https://www.mdpi.com/2076-3417/15/9/4930]
- 44. Advanced preclinical functional magnetic resonance ... [https://www.nature.com/articles/s44303-025-00085-z]
- 45. Recent Advances in Magnetic Resonance Imaging for the ... [https://pmc.ncbi.nlm.nih.gov/articles/PMC12386106/]
- 46. Current status and future prospects of molecular imaging in ... [https://www.frontiersin.org/journals/immunology/articles/10.3389/fimmu.2025.1518555/full]
- 47. Comparison of Early Contrast Enhancement Models in ... [https://pmc.ncbi.nlm.nih.gov/articles/PMC11083228/]
- 48. Comparative Evaluation of Superb Microvascular Imaging ... [https://pmc.ncbi.nlm.nih.gov/articles/PMC12067153/]
- 49. Multi-nuclear magnetic resonance spectroscopy: state of the ... [https://insightsimaging.springeropen.com/articles/10.1186/s13244-022-01262-z]
- 50. How to Read an MRI Report: T1, T2 Signal Intensity ... [https://www.pockethealth.com/patient-resources/whats-in-my-mri-report-decoding-common-terminology/]
- 51. Interleaved Whole Brain 23Na‐MRI and 31P‐MRSI ... [https://pmc.ncbi.nlm.nih.gov/articles/PMC11830465/]
- 52. Multi Nuclei MR imaging VUIIS [https://www.usa.philips.com/healthcare/clinical-article/mri-diagnostic-potential-of-sodium-mri]
- 53. Multinuclear MRI Can Depict Metabolic and Energetic ... [https://pmc.ncbi.nlm.nih.gov/articles/PMC11646961/]
- 54. Magnetic Barcode Imaging for Contrast Agents - PMC [https://pmc.ncbi.nlm.nih.gov/articles/PMC5055837/]
- 55. Empowering drug development - PubMed Central - NIH [https://pmc.ncbi.nlm.nih.gov/articles/PMC10014695/]
- 56. Imaging Biomarkers for Central Nervous System Drug ... [https://jnm.snmjournals.org/content/64/1/12]
- 57. Use of biomarkers and imaging to assess pathophysiology ... [https://www.sciencedirect.com/science/article/pii/S1279770723018584]
- 58. Imaging techniques High field MRI in clinical practice [https://www.sciencedirect.com/science/article/abs/pii/S174067491100031X]
- 59. The Role of High-Resolution Magnetic Resonance Imaging in ... [https://pmc.ncbi.nlm.nih.gov/articles/PMC10136797/]
- 60. Computational mechanisms of neuroimaging biomarkers ... [https://www.nature.com/articles/s41380-025-03134-6]
- 61. Tissue-Based MRI Intensity Standardization: Application to ... [https://pmc.ncbi.nlm.nih.gov/articles/PMC3352580/]
- 62. Comparison of Magnetic Resonance Imaging and High- ... [https://pmc.ncbi.nlm.nih.gov/articles/PMC10485461/]
- 63. MRI contrast agents: Classification and application (Review) [https://www.spandidos-publications.com/10.3892/ijmm.2016.2744]
- 64. MRI Contrast Agents for Functional Molecular Imaging of ... [https://pmc.ncbi.nlm.nih.gov/articles/PMC2883914/]
- 65. Optimization of MRI Gradient Coils with Explicit Peripheral ... [https://pmc.ncbi.nlm.nih.gov/articles/PMC7772273/]
- 66. Eddy currents [https://mriquestions.com/eddy-current-problems.html]
- 67. Peripheral Nerve Stimulation (PNS) Analysis of MRI Head ... [https://link.springer.com/chapter/10.1007/978-3-031-15451-5_3]
- 68. Predicting Magnetostimulation Thresholds in the ... [https://www.nature.com/articles/s41598-017-05493-9]
- 69. Acoustic noise? [https://mriquestions.com/acoustic-noise.html]
- 70. fMRI Acoustic Noise Enhances Parasympathetic Activity in ... [https://pmc.ncbi.nlm.nih.gov/articles/PMC8615429/]
- 71. Initial assessment of PNS safety for interventionalists during ... [https://pmc.ncbi.nlm.nih.gov/articles/PMC11914522/]
- 72. Analysis of Factors Affecting Quality in Structural Magnetic ... [https://pmc.ncbi.nlm.nih.gov/articles/PMC12315249/]
- 73. Common Artifacts in Magnetic Resonance Imaging [https://www.hkjr.org/article/v26n1/58]
- 74. MRI in drug discovery [https://www.europeanpharmaceuticalreview.com/article/11299/mri-in-drug-discovery/]
- 75. Image formation in diffusion MRI: A review of recent technical ... [https://pmc.ncbi.nlm.nih.gov/articles/PMC5574024/]
- 76. Susceptibility artifact [https://mriquestions.com/susceptibility-artifact.html]
- 77. Deep learning-based k-space-to-image reconstruction and ... [https://www.sciencedirect.com/science/article/abs/pii/S0730725X23001893]
- 78. Combination of integrated dynamic shimming and readout ... [https://www.sciencedirect.com/science/article/abs/pii/S0730725X17300991]
- 79. Cardiovascular magnetic resonance artefacts - PubMed Central [https://pmc.ncbi.nlm.nih.gov/articles/PMC3674921/]
- 80. Deep Learning for Image Enhancement and Correction in ... [https://link.springer.com/article/10.1007/s10278-022-00721-9]
- 81. Effects of MRI scanner manufacturers in classification tasks ... [https://www.nature.com/articles/s41598-023-43715-5]
- 82. Harmonization of multi-scanner in vivo magnetic resonance ... [https://pmc.ncbi.nlm.nih.gov/articles/PMC9845632/]
- 83. Intensity standardization methods in magnetic resonance ... [https://www.sciencedirect.com/science/article/pii/S2405631621000658]
- 84. T1 and T2 standardization in the ISMRM/NIST MR phantom [https://link.springer.com/article/10.1007/s10334-025-01260-4]
- 85. Learning multi-site harmonization of magnetic resonance ... [https://www.nature.com/articles/s44172-023-00140-w]
- 86. Real-world diagnostic performance of knee MRI protocols ... [https://pubmed.ncbi.nlm.nih.gov/41109866/]
- 87. Deep Learning-Enhanced Parallel Imaging and ... [https://pubmed.ncbi.nlm.nih.gov/35776434/]
- 88. Performance of low- and high-temporal-resolution DCE-MRI ... [https://pmc.ncbi.nlm.nih.gov/articles/PMC12432709/]
- 89. Advancing MRI reconstruction: A systematic review of deep ... [https://www.sciencedirect.com/science/article/abs/pii/S174680942500802X]
- 90. Clinical Applications and Recent Updates of Simultaneous ... [https://www.sciencedirect.com/science/article/abs/pii/S1076633223007109]
- 91. Deep Learning-Based Image Reconstruction in ... [https://pubmed.ncbi.nlm.nih.gov/41113364/]
- 92. Robust Simultaneous Multislice MRI Reconstruction Using ... [https://www.sciencedirect.com/science/article/abs/pii/S1361841525003974]
- 93. Robust Simultaneous Multislice MRI Reconstruction Using ... [https://arxiv.org/html/2407.21600v1]
- 94. Accuracy and precision in super-resolution MRI: Enabling ... [https://pmc.ncbi.nlm.nih.gov/articles/PMC9272945/]
- 95. MRI super-resolution reconstruction using efficient diffusion ... [https://pubmed.ncbi.nlm.nih.gov/40460850/]
- 96. Ultra-High Resolution 9.4T Brain MRI Segmentation via a ... [https://pmc.ncbi.nlm.nih.gov/articles/PMC12561009/]
- 97. [2511.16854] MRI Super-Resolution with Deep Learning [https://arxiv.org/abs/2511.16854]
- 98. MoEDiff-SR: Mixture of Experts-Guided Diffusion Model for... [https://arxiv.org/html/2504.07308v1]
- 99. Deep Learning in Knee MRI: A Prospective Study to ... [https://www.sciencedirect.com/science/article/pii/S1076633225002156]
- 100. MRI with ultrahigh field strength and high-performance gradients [https://eurradiolexp.springeropen.com/articles/10.1186/s41747-021-00216-2]
- 101. MRI SNR and CNR: Definition, Formula, and Differences ... [https://mrimaster.com/snr-vs-cnr-mri/]
- 102. X-ray Contrast To Noise (CNR) Illustrated Examples ... [https://howradiologyworks.com/x-ray-cnr/]
- 103. Clinical Image Testing: MRI (Revised 1-23-2025) [https://accreditationsupport.acr.org/support/solutions/articles/11000061017-clinical-image-testing-mri-revised-1-23-2025-]
- 104. High-Resolution Magnetic Resonance Imaging Using ... [https://pmc.ncbi.nlm.nih.gov/articles/PMC6389811/]
- 105. Clinical 7 Tesla magnetic resonance imaging - PubMed Central [https://pmc.ncbi.nlm.nih.gov/articles/PMC11846079/]
- 106. Clinical Performance of NeuroQuant: Transforming Brain ... [https://www.cortechs.ai/clinical-performance-of-neuroquant-transforming-brain-mri-analysis/]
- 107. Towards precision MRI biomarkers in epilepsy with ... [https://pubmed.ncbi.nlm.nih.gov/40043180/]
- 108. Functional network collapse in neurodegenerative disease [https://www.nature.com/articles/s41467-025-65156-6]
- 109. Advances in neuroimaging applications of quantitative ... [https://www.sciencedirect.com/science/article/pii/S2950162825000165]
- 110. Accelerating Therapeutic Development for Brain Illnesses [https://irp.nih.gov/blog/post/2025/09/accelerating-therapeutic-development-for-brain-illnesses]
- 111. Research progress of MRI-based radiomics in ... [https://www.frontiersin.org/journals/oncology/articles/10.3389/fonc.2025.1420599/full]
- 112. Review State-of-the-art imaging of hepatocellular carcinoma [https://www.sciencedirect.com/science/article/abs/pii/S1091255X24005705]
- 113. Recent advances and issues in imaging modalities for ... [http://www.e-jlc.org/journal/view.php?doi=10.17998/jlc.2025.02.16]
- 114. Current imaging diagnosis of hepatocellular carcinoma [https://epos.myesr.org/poster/esr/ecr2025/C-17029/background]
- 115. MRI management of focal liver lesions: what a beginner ... [https://www.frontiersin.org/journals/oncology/articles/10.3389/fonc.2025.1630424/full]
- 116. Contrast-enhanced MRI for Hepatocellular Carcinoma ... [https://www.sciencedirect.com/science/article/abs/pii/S1076633225010335]
- 117. Biomarker Utilization for Regulatory Decision Making [https://pmc.ncbi.nlm.nih.gov/articles/PMC12619682/]
- 118. Drug Development Tool (DDT) Qualification Programs [https://www.fda.gov/drugs/development-approval-process-drugs/drug-development-tool-ddt-qualification-programs]
- 119. MR image resolution [https://mriquestions.com/image-resolution.html]
- 120. Myocardial Tissue Characterization by Magnetic ... [https://pmc.ncbi.nlm.nih.gov/articles/PMC4252135/]
- 121. Time‐to‐Event Endpoints in Imaging Biomarker Studies - PMC [https://pmc.ncbi.nlm.nih.gov/articles/PMC11706316/]
- 122. The efficacy of different biomarkers and endpoints to refine ... [https://bmcmedicine.biomedcentral.com/articles/10.1186/s12916-024-03667-7]
- 123. Deep Learning Super-Resolution Enables Rapid ... [https://arxiv.org/abs/1808.04447]
- 124. Advanced High-Field MRI: Benefits and Limitations [https://www.inviewimaging.com/2024/12/05/advanced-high-field-mri-benefits-and-limitations/]
- 125. ESMRMB 2025 focus topic: cycle of quality—from concept to ... [https://pmc.ncbi.nlm.nih.gov/articles/PMC12255560/]
- 126. Pros and cons of ultra-high-field MRI/MRS for human ... [https://www.sciencedirect.com/science/article/pii/S007965651830013X]
- 127. Applications, limitations and advancements of ultra-low ... [https://pmc.ncbi.nlm.nih.gov/articles/PMC11225429/]
- 128. Impact of optimized and conventional facility designs on ... [https://www.nature.com/articles/s41598-025-94799-0]
- 129. Optimizing MRI Scheduling in High-Complexity Hospitals [https://pmc.ncbi.nlm.nih.gov/articles/PMC12189641/]