Contrast-Enhanced vs. Non-Contrast MRI Brain Volumetry: A Guide for Translational Research and Drug Development
This article provides a comprehensive analysis of contrast-enhanced (CE) and non-contrast (NC) MRI for brain volumetry, a critical biomarker in neurodegenerative disease research and clinical trials.
Contrast-Enhanced vs. Non-Contrast MRI Brain Volumetry: A Guide for Translational Research and Drug Development
Abstract
This article provides a comprehensive analysis of contrast-enhanced (CE) and non-contrast (NC) MRI for brain volumetry, a critical biomarker in neurodegenerative disease research and clinical trials. It explores the foundational principles, highlighting the underutilization of clinical CE-MR images in research due to technical heterogeneity. We detail methodological advances, particularly the superior reliability of deep learning-based segmentation tools like SynthSeg+ for processing CE-MR scans. The content addresses key troubleshooting aspects, including the impact of scanner hardware and contrast on measurement variability, and offers optimization strategies. Finally, we present a rigorous comparative validation of AI and non-AI volumetry methods, evaluating their performance in differential diagnosis and longitudinal study design. This resource is tailored for researchers, scientists, and drug development professionals seeking to leverage MRI volumetry accurately and efficiently.
Core Principles and Clinical Context of Brain Volumetry
Magnetic resonance imaging (MRI) serves as a cornerstone of modern medical diagnostics, providing unparalleled insights into the human body's soft tissues and structures. A critical decision in its application lies in the use of contrast agents. This guide objectively compares the performance of contrast-enhanced (CE-MR) and non-contrast (NC-MR) MRI, with a specific focus on the context of brain volumetry research, to inform researchers, scientists, and drug development professionals.
The fundamental distinction between these approaches is the use of a gadolinium-based contrast agent, which is administered intravenously to enhance the visibility of vascular structures, inflammation, and blood-brain barrier breakdown [1] [2]. While non-contrast MRI provides excellent anatomical detail, the addition of contrast helps differentiate between normal and abnormal tissues, a capability crucial for specific diagnostic tasks [3].
Technical Performance and Diagnostic Accuracy
Quantitative Comparison of Diagnostic Performance
The diagnostic performance of CE-MR and NC-MR varies significantly across clinical applications. The table below summarizes key performance metrics from recent studies.
Table 1: Diagnostic Performance of Contrast vs. Non-Contrast MRI Across Applications
| Application | Modality | Sensitivity | Specificity | AUC | Key Findings | Source |
|---|---|---|---|---|---|---|
| Pulmonary Embolism | NC-MR Angiography | 0.88 (0.83-0.91) | 0.97 (0.93-0.98) | 0.92 | Superior specificity and fewer non-diagnostic scans vs. V/Q scintigraphy. | [4] |
| V/Q Scintigraphy | 0.81 (0.76-0.85) | 0.84 (0.74-0.91) | 0.87 | Reference standard for patients who cannot use iodinated contrast. | [4] | |
| Colorectal Liver Metastases | Non-Contrast Abbreviated MRI | - | - | 0.899-0.909 | No significant difference from full contrast protocol for lesion identification. | [5] |
| Gadoxetic Acid-Enhanced MRI | - | - | 0.935-0.939 | Full protocol reference standard. | [5] | |
| General Diagnostic Use | Contrast-Enhanced MRI | N/A | N/A | N/A | Superior for detecting small tumors, inflammation, and vascular lesions. | [1] [3] |
| Non-Contrast MRI | N/A | N/A | N/A | Effective for large tumors, routine follow-ups, and structural assessment. | [1] [2] |
Non-Diagnostic Scan Rates
A critical operational metric is the proportion of scans that are non-diagnostic. In the detection of pulmonary embolism, the pooled proportion of non-diagnostic tests for V/Q scans was 34.7%, significantly higher than the 3.31% for non-contrast MR angiography [4]. This highlights how technological advancements in NC-MR can improve workflow efficiency by reducing the need for repeat scans.
Brain Volumetry Research
Reliability of Volumetric Measurements
In brain volumetry research, a key question is whether contrast administration affects the reliability of morphometric measurements. A comparative study on normal individuals provides critical insights.
Table 2: Reliability of Brain Volumetric Measurements from Contrast-Enhanced vs. Non-Contrast MRI
| Segmentation Tool | Reliability (ICC between CE-MR and NC-MR) | Structures with Notable Discrepancies | Performance in Age Prediction |
|---|---|---|---|
| SynthSeg+ | High (ICCs > 0.90 for most structures) | Cerebrospinal Fluid (CSF) and Ventricular Volumes | Comparable results for both scan types |
| CAT12 | Inconsistent Performance | N/A | N/A |
This study, which analyzed T1-weighted CE-MR and NC-MR scans from 59 normal participants (aged 21-73), concluded that deep learning-based approaches like SynthSeg+ can reliably process CE-MR scans for morphometric analysis [6] [7]. This finding is significant as it broadens the potential application of clinically acquired CE-MR images in neuroimaging research, allowing for the repurposing of vast clinical archives [6].
Exploiting Heterogeneous Clinical Data Warehouses
The heterogeneity of clinical MRI archives—containing mixes of contrast-enhanced and non-contrast images—presents a challenge for large-scale research. Deep learning models, specifically 3D U-Net and conditional GANs, have been successfully applied to convert T1-weighted contrast-enhanced (T1ce) images into synthetic non-contrast-enhanced (T1nce) images [8]. Validation showed that tissue volumes (gray matter, white matter, cerebrospinal fluid) extracted from these synthetic T1nce images were closer to those from real T1nce images than volumes extracted from the original T1ce images [8]. This harmonization technique reduces bias and enables the use of a wider dataset for robust brain volumetry studies.
Methodologies and Experimental Protocols
Typical Workflow for Brain Volumetry Analysis
The following diagram illustrates a generalized workflow for conducting brain volumetry analysis, integrating both conventional and deep learning-based approaches.
Key Segmentation Tools for Brain Volumetry
The reliability of volumetric measurements is highly dependent on the segmentation tool used. The following table details key software tools and their performance characteristics.
Table 3: Key Segmentation Tools for Brain Volumetry in Contrast and Non-Contrast MRI
| Tool Name | Type/Description | Performance on CE-MR vs. NC-MR | Primary Use Case |
|---|---|---|---|
| SynthSeg+ | Deep learning-based segmentation tool | High reliability (ICCs >0.90) between CE-MR and NC-MR for most structures [6]. | Robust segmentation across diverse, heterogeneous clinical scans. |
| MindGlide | Deep learning model for segmenting brain structures and white matter lesions from any single MRI contrast. | Outperformed state-of-the-art models (SAMSEG, WMH-SynthSeg) in agreement with expert-labelled lesion volumes [9]. | Extracting biomarkers from routine clinical scans and archives, enabling real-world research. |
| CAT12 | A Computational Anatomy toolbox for SPM. | Showed inconsistent performance and higher discrepancies between CE-MR and NC-MR scans [6]. | Research-grade brain morphometry (use with caution on CE-MR). |
| Conventional Tools (SPM, FSL, ANTs) | Classical neuroimaging software for feature extraction. | Primarily validated on NC-MR; good performance on CE-MR not guaranteed [8]. | Standardized processing pipelines for research studies. |
Advanced Deep Learning for Single-Contrast Analysis
For analyzing vast clinical archives, tools like MindGlide have been developed to extract brain region and white matter lesion volumes from any single MRI contrast, be it T1-weighted, T2-weighted, or FLAIR, and including both 2D and 3D scans [9]. This is a significant advancement as it unlocks quantitative analysis of archival single-contrast MRIs, which were previously difficult to utilize in large-scale, standardized research.
Research Reagent Solutions and Essential Materials
This section details key computational tools and materials essential for researchers working in this field.
Table 4: Essential Research Reagents and Computational Tools
| Item Name | Type | Function/Application in Research |
|---|---|---|
| Gadolinium-Based Contrast Agents | Chemical Compound | Enhances visibility of vascular structures, active inflammation, and blood-brain barrier breakdown in CE-MR [1] [3]. |
| SynthSeg+ | Software Tool | Segments brain MRI scans of any contrast and resolution, enabling reliable volumetry on both CE-MR and NC-MR [6]. |
| MindGlide | Software Tool | A publicly available deep learning model that segments brain structures and lesions from any single MRI contrast, facilitating the use of heterogeneous data [9]. |
| 3D U-Net / Conditional GAN Models | Deep Learning Architecture | Used for medical image translation tasks, such as converting contrast-enhanced T1w (T1ce) images into synthetic non-contrast-enhanced (T1nce) images to harmonize datasets [8]. |
The choice between contrast and non-contrast MRI is application-dependent. For pathologies involving the blood-brain barrier, vascular integrity, or inflammation, contrast-enhanced MRI remains the gold standard due to its superior sensitivity. However, for brain volumetry research, the landscape is evolving. Non-contrast MRI is sufficient and often preferred for its safety profile. Crucially, advanced deep learning tools like SynthSeg+ and MindGlide now enable reliable volumetric analysis on both NC-MR and CE-MR, and can even harmonize mixed datasets. This empowers researchers to leverage large, heterogeneous clinical data warehouses, accelerating discovery in neurology and drug development.
Magnetic Resonance Imaging (MRI) contrast agents are pivotal in enhancing the diagnostic capability of MRI, a non-invasive imaging technique central to clinical and research applications. In the specific context of brain volumetry research—a field dedicated to quantifying brain structure volumes to understand development, aging, and disease—the use of contrast agents presents a unique set of considerations. These agents can improve tissue delineation, yet their safety and impact on automated morphometric tools are critical concerns. This guide objectively compares the performance of various MRI contrast agents, with a focus on their application in research populations. It synthesizes current data on their mechanisms, safety profiles, and experimental protocols, particularly evaluating the reliability of contrast-enhanced MRI for volumetric brain measurements against non-contrast alternatives. The information is framed to assist researchers, scientists, and drug development professionals in making informed decisions for their imaging studies.
Classification and Mechanisms of MRI Contrast Agents
MRI contrast agents function by altering the relaxation times of water protons in their vicinity, thereby increasing the contrast between different tissues. They can be systematically categorized into several classes based on their mechanism of action and composition [10].
Primary Classes of MRI Contrast Agents:
- T1 Agents: These are predominantly paramagnetic metal complexes, typically containing Gadolinium (Gd(III)) or Manganese (Mn(II)). They shorten the longitudinal relaxation time (T1) of water protons, resulting in a positive contrast or signal brightening on T1-weighted images, which are commonly used for anatomical imaging. Their effectiveness is influenced by factors such as the agent's structure, distribution within tissue (e.g., intravascular vs. extracellular), and concentration. A limitation is their relatively low sensitivity, often requiring local concentrations in the micromolar range to generate a detectable signal [10].
- T2/T2* Agents: Most commonly based on superparamagnetic iron oxide nanoparticles, these agents primarily shorten the transverse relaxation time (T2 or T2*), causing signal loss or darkening in the affected areas. They generally offer higher sensitivity than T1 agents and have been widely used for cellular imaging. However, the signal void they create can be problematic in regions with naturally low MRI signal, and designing "smart" agents whose contrast can be modulated by the biological environment is challenging [10].
- CEST (Chemical Exchange Saturation Transfer) Agents: This class generates contrast through the transfer of magnetization from exchangeable protons (e.g., -OH, -NH) on the agent to the bulk water pool. A key advantage is that the contrast is "frequency-encoded," meaning it is only visible when a specific radiofrequency pulse is applied. This allows for multiplexing (imaging multiple targets simultaneously) and the development of concentration-independent responsive agents. However, their sensitivity is typically low, requiring millimolar concentrations of the exchangeable proton pool, though this can be improved using nanocarriers [10].
- Heteronuclear Agents: This category includes agents detectable via nuclei other than protons.
- ¹⁹F Agents: These contain fluorine atoms, which are directly detectable by MRI. The major advantage is the absence of background signal in the body, allowing for direct quantification of the agent's concentration. They are almost exclusively formulated as nano-systems, such as perfluorocarbon nanoparticles, to achieve sufficient signal [10].
- Hyperpolarized Probes: These agents (e.g., ¹³C-pyruvate) are subjected to techniques like dynamic nuclear polarization (DNP) that increase their signal by >10,000-fold. This provides unparalleled sensitivity for tracking metabolic pathways in real-time. A significant limitation is the transient nature of the hyperpolarized state, which decays with the T1 of the nucleus (seconds to minutes), necessitating rapid injection and data acquisition [10].
Table 1: Classification and Mechanism of Action of Major MRI Contrast Agent Types
| Agent Class | Primary Mechanism | Key Components | Resulting Contrast | Major Advantages | Major Limitations |
|---|---|---|---|---|---|
| T1 Agents [10] | Shortens T1 relaxation time | Gd(III), Mn(II) complexes | Signal brightening | High versatility, excellent for anatomy | Low sensitivity (~µM required) |
| T2/T2* Agents [10] | Shortens T2/T2* relaxation time | Iron oxide nanoparticles | Signal darkening | Higher sensitivity than T1 agents | Dark contrast can be problematic; less suited for smart agents |
| CEST Agents [10] | Chemical exchange saturation transfer | Compounds with exchangeable protons | On/off signal via RF pulse | Frequency-encoded, multiplex capability | Low sensitivity (mM required) |
| ¹⁹F Agents [10] | Detection of ¹⁹F nuclei | Perfluorocarbon nanoparticles | Direct positive signal | No background signal, quantifiable | Requires nano-formulations for sufficient signal |
| Hyperpolarized Probes [10] | Enhanced nuclear polarization | ¹³C-labeled molecules (e.g., pyruvate) | Transient strong signal | Extremely high sensitivity for metabolism | Signal lasts only for T1 duration (seconds-minutes) |
The following diagram illustrates the fundamental mechanisms by which the main classes of contrast agents alter the MRI signal to generate contrast.
Mechanisms of MRI Contrast Agent Classes
Safety Considerations of Gadolinium-Based Contrast Agents
Gadolinium-Based Contrast Agents (GBCAs) are the most widely used class in clinical and research settings. While their diagnostic value is immense, significant safety considerations have emerged over the past two decades.
Established Risks: Nephrogenic Systemic Fibrosis (NSF)
NSF is a well-established, serious complication of GBCA exposure. It is a debilitating and potentially fatal fibrotic disorder affecting the skin, joints, and internal organs [11] [12]. The risk is profoundly elevated in patients with acute or chronic severe renal impairment, as reduced glomerular filtration rate (GFR) leads to prolonged circulation of the agent, increasing the chance of gadolinium dissociation from its ligand [11]. Following the discovery of this link, regulatory agencies mandated boxed warnings, and the use of GBCAs in high-risk patients was drastically reduced, leading to a sharp decline in NSF cases [11] [12].
The American College of Radiology (ACR) has categorized GBCAs into risk groups based on their association with unconfounded NSF cases [11]:
- Group 1 (Highest Risk): Agents associated with the greatest number of NSF cases (e.g., Omniscan, Magnevist, OptiMARK).
- Group 2 (Lower Risk): Agents with few or no unconfounded NSF cases.
- Group 3 (Insufficient Data): Newer agents with limited post-marketing data.
It is crucial to note that NSF has been reported with agents across all groups, including Group 2 agents like MultiHance and Dotarem, in patients with normal or near-normal renal function, though this is rare [12]. The initial categorization was partly influenced by market share, and long-term safety data for some Group 2 agents remain comparatively limited [11].
Gadolinium Retention and Potential Chronic Toxicity
Even in individuals with normal renal function, gadolinium deposition has been consistently demonstrated in various tissues, including the brain (particularly in deep nuclei), bone, and kidney [11] [12]. This retention was first highlighted in a 2016 study by Kanda et al., which showed a correlation between cumulative GBCA doses and T1 signal hyperintensity in the dentate nucleus and globus pallidus [11].
The mechanism of retention is an area of active research. While initially thought to be caused by dissociated gadolinium ions, recent evidence points to the formation of gadolinium-rich nanoparticles in tissues. These nanoparticles, which have been identified in the kidney cells of humans with normal renal function, are thought to form after injection and may be the primary mediators of chronic toxicity [11] [12]. Proposed pathophysiological mechanisms include mitochondrial injury and activation of pro-fibrotic pathways [11].
A condition termed "gadolinium deposition disease" has been proposed, with anecdotal reports of symptoms such as persistent pain, cognitive "fog," and crushing fatigue following GBCA exposure [11]. However, a direct causal link between gadolinium retention and clinical symptoms remains a subject of ongoing investigation, and a universally accepted clinical case definition is lacking, making prevalence difficult to quantify [12]. In response to these concerns, the FDA has required new warnings and specific ICD-10-CM codes for gadolinium toxicity [12].
Table 2: Safety Profile and Pharmacokinetics of Gadolinium-Based Contrast Agents
| Parameter | Details | Clinical/Research Implications |
|---|---|---|
| Major Risks | - Nephrogenic Systemic Fibrosis (NSF) [11] [12]- Gadolinium retention in brain, bone, skin [11]- Proposed "gadolinium deposition disease" [11] | Strict contraindication in severe renal disease. Weigh risks vs. benefits in all subjects. |
| ACR Risk Group | Group 1 (High NSF risk): Omniscan, Magnevist, OptiMARK [11]Group 2 (Lower NSF risk): MultiHance, Dotarem, Gadavist [11] [12] | Preference for Group 2 agents in clinical and research practice. |
| Elimination Half-life (Normal Renal Function) | ~1.3 - 1.4 hours (for novel agent gadoquatrane) [13]Rapid renal excretion via glomerular filtration [14]. | Near-complete clearance in patients with normal eGFR within ~12 hours [14]. |
| Elimination Half-life (Renal Impairment) | Increases progressively with reduced eGFR [14]:- eGFR 30-60: ~4-7 hours- eGFR <30: ~10-27 hours | Requires extended waiting times between doses; up to 7 days for near-complete clearance in severe impairment [14]. |
| Key Safety Mitigations | - Use macrocyclic agents (more stable) [15]- Screen for renal impairment- Use lowest effective dose [11] | Adherence to guidelines (e.g., ACR, ESUR) is mandatory. |
The relationships between GBCA exposure, tissue deposition, and potential clinical outcomes are summarized below.
GBCA Exposure and Potential Pathological Outcomes
Contrast-Enhanced vs. Non-Contrast MRI in Brain Volumetry Research
Brain volumetry relies on precise segmentation of brain tissues from MRI scans. A key question for researchers is whether contrast-enhanced (CE-MR) images can be used interchangeably with non-contrast (NC-MR) images for this purpose, especially when leveraging large clinical datasets where contrast is often administered.
Experimental Protocol for Comparative Volumetry
A 2025 comparative study by Aman et al. provides a robust experimental framework for evaluating this question [6] [16].
- Objective: To evaluate the reliability of morphometric measurements from CE-MR scans compared to NC-MR scans in normal individuals.
- Subjects: 59 clinically normal participants (age 21-73; 24 female) who underwent both NC-MR and CE-MR T1-weighted imaging.
- MRI Acquisition: Paired T1-weighted CE-MR and NC-MR scans were acquired for each subject. The CE-MR scans were performed after intravenous administration of a gadolinium-based contrast agent.
- Image Processing and Segmentation:
- Tools: Two segmentation software packages were used and compared:
- SynthSeg+: A deep learning-based tool designed to be robust to contrast and scanner changes.
- CAT12: A widely used statistical parametric mapping toolbox.
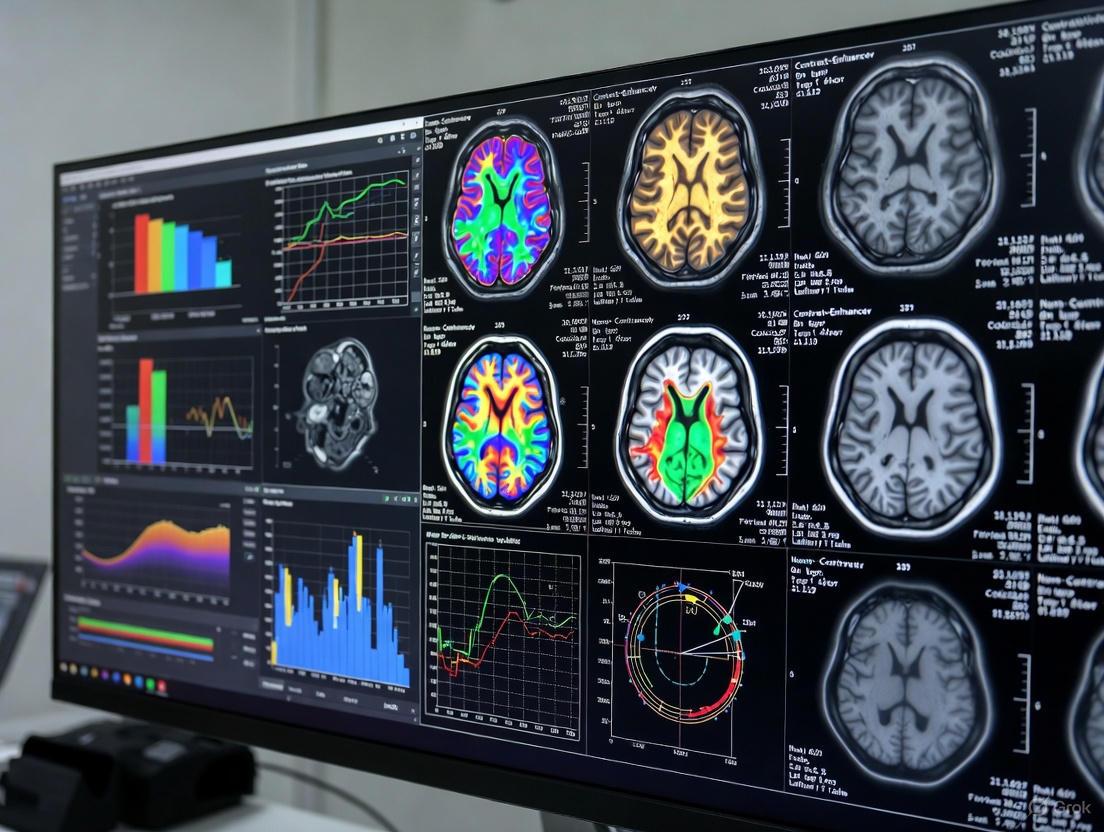
- Structures Segmented: Whole brain, cortical gray matter (GM), white matter (WM), cerebrospinal fluid (CSF), ventricles, and subcortical structures (e.g., thalamus, hippocampus).
- Analysis: Volumetric measurements from CE-MR and NC-MR scans were compared using Intraclass Correlation Coefficients (ICCs) and Bland-Altman limits of agreement. ICC values >0.90 are generally considered to indicate excellent reliability.
- Tools: Two segmentation software packages were used and compared:
- Secondary Analysis: The utility of both scan types for building age prediction models was assessed.
Key Findings and Data Comparison
The study demonstrated that with the right tools, CE-MR scans can be highly reliable for brain volumetry [6] [16].
Table 3: Comparative Volumetric Analysis: Contrast-Enhanced vs. Non-Contrast MRI
| Metric / Brain Structure | Segmentation Tool | Key Finding (CE-MR vs. NC-MR) | Quantitative Reliability (ICC) |
|---|---|---|---|
| Overall Performance | SynthSeg+ | High reliability across most volumes [16] | ICCs > 0.90 for most structures [6] [16] |
| Overall Performance | CAT12 | Inconsistent performance, higher discrepancies [16] | Lower ICCs than SynthSeg+; 4 scans failed segmentation [16] |
| Cortical Gray Matter | SynthSeg+ | High agreement [16] | ICC > 0.94 [16] |
| White Matter | SynthSeg+ | High agreement [16] | ICC > 0.94 [16] |
| CSF & Ventricles | SynthSeg+ | Notable discrepancies [16] | Lower ICCs; volumes underestimated on CE-MR [16] |
| Thalamus | SynthSeg+ | Robust correlation [16] | ICC > 0.90 [16] |
| Brain Stem | SynthSeg+ | Robust correlation (lowest among structures) [16] | ICC > 0.90 [16] |
| Age Prediction | SynthSeg+ | Comparable results for both scan types [6] [16] | Model performance was equivalent [16] |
Conclusion: Deep learning-based approaches like SynthSeg+ can reliably process CE-MR scans for morphometric analysis, showing high consistency with NC-MR scans across most brain structures. This finding potentially broadens the application of clinically acquired CE-MR images in neuroimaging research. However, caution is advised for volumes with noted discrepancies, such as CSF, and when using traditional segmentation software like CAT12 [6] [16].
The workflow for this comparative volumetry experiment is outlined below.
Workflow for Comparative Brain Volumetry Study
The Scientist's Toolkit: Research Reagent Solutions
For researchers designing studies involving MRI contrast agents, particularly in brain volumetry, the following tools and considerations are essential.
Table 4: Essential Research Tools for Contrast-Enhanced MRI Studies
| Tool / Reagent | Function / Description | Application in Research |
|---|---|---|
| Macrocyclic GBCAs (e.g., Gadavist, Dotarem) | More stable thermodynamically and kinetically than linear agents, reducing gadolinium dissociation [15]. | Recommended default choice for human research to minimize deposition risk, especially in longitudinal studies. |
| Deep Learning Segmentation Tools (e.g., SynthSeg+) | A tool designed to be robust to variations in contrast, scanner, and protocol [6] [16]. | Critical for volumetry on clinical CE-MR datasets. Enables reliable merging of contrast and non-contrast data. |
| Traditional Segmentation Software (e.g., CAT12, FSL) | Widely used pipelines for brain morphometry, often optimized for NC-MR images [16] [17]. | Use with caution on CE-MR data. May yield inconsistent results or segmentation failures [16]. Validate outputs. |
| Novel Low-Dose/High-Relaxivity Agents (e.g., Gadoquatrane) | Newer agents designed to provide equivalent contrast enhancement at a lower gadolinium dose [13] [15]. | Potential for future studies to minimize participant gadolinium exposure while maintaining diagnostic and research image quality. |
| Non-Contrast MRI Techniques | AI-based reconstruction and native-T1 mapping to generate contrast without exogenous agents [15]. | Growing alternative for specific applications (e.g., liver imaging, vascular studies), potentially reducing reliance on GBCAs. |
The use of contrast agents in MRI, particularly GBCAs, offers a powerful means to enhance diagnostic and research imaging, but it necessitates a careful, evidence-based approach. For brain volumetry research, the evidence indicates that contrast-enhanced MRI scans can be a reliable resource when processed with modern, deep learning-based segmentation tools like SynthSeg+, effectively expanding the pool of usable clinical data for retrospective analysis. From a safety perspective, the risks of NSF are well-defined and can be mitigated, while the long-term implications of gadolinium retention require continued vigilance and research. The field is advancing with the development of safer, more stable macrocyclic agents, high-relaxivity formulations that permit lower doses, and novel non-contrast techniques. Researchers must therefore balance the undeniable benefits of contrast enhancement with a prudent safety protocol, ensuring that its application is justified and optimized within their specific scientific context.
Clinical brain MRI scans, including contrast-enhanced (CE-MR) images, represent a vast and underutilized resource for neuroscience research, primarily due to technical heterogeneity. This heterogeneity arises from differences in scanner manufacturers, magnetic field strengths, pulse sequences, and the use of contrast agents, creating significant challenges for consistent brain morphometric analysis. While CE-MR is essential for clinical tasks like detecting blood-brain barrier disruption or characterizing brain tumors, its application in quantitative brain volumetry has been limited due to concerns that contrast agents might alter tissue appearance and thus compromise the reliability of automated measurements [6] [7].
The underutilization of existing CE-MR scans represents a missed opportunity to expand datasets for large-scale neuroimaging research. Overcoming this challenge requires robust computational tools and standardized protocols that can account for technical variations. This guide objectively compares the performance of different segmentation approaches when applied to CE-MR versus non-contrast MR (NC-MR) scans, providing researchers with evidence-based recommendations for leveraging clinically acquired CE-MR images in brain volumetry studies [6].
Experimental Protocols: Evaluating Volumetric Reliability
Core Experimental Methodology
A pivotal 2025 study by Aman et al. directly addressed the reliability of morphometric measurements from CE-MR scans compared to NC-MR scans. The study employed a within-subjects design to control for biological variability and isolate technical effects [6] [7].
- Participants and Imaging: The researchers analyzed paired T1-weighted CE-MR and NC-MR scans from 59 clinically normal participants (age range: 21-73 years; 24 female). All participants were without known neurological disorders. The CE-MR scans were acquired following the intravenous administration of a gadolinium-based contrast agent [7].
- Segmentation Tools: Each scan was processed using two different segmentation tools: the deep learning-based SynthSeg+ and the more traditional CAT12 toolbox, which is part of the SPM software. This allowed for a comparison of methodological approaches [6] [7].
- Analysis: Volumetric measurements for multiple brain structures were derived from both scan types and both tools. The primary statistical analysis used Intraclass Correlation Coefficients (ICCs) to quantify the agreement between measurements from CE-MR and NC-MR scans. Additionally, the utility of both scan types for building age prediction models was evaluated [7].
Workflow and Logical Relationship
The experimental workflow for assessing the reliability of CE-MR scans for volumetry follows a logical, sequential path, as visualized below.
Performance Comparison: SynthSeg+ vs. CAT12
The core of the research problem lies in how different software tools handle the technical heterogeneity introduced by contrast agents. The experimental data reveals clear differences in performance between the deep learning-based and traditional segmentation approaches.
Quantitative Reliability Data
Table 1: Comparison of Segmentation Tool Performance on CE-MR vs. NC-MR Scans
| Brain Structure | SynthSeg+ (ICC) | CAT12 (ICC) | Notes on Discrepancies |
|---|---|---|---|
| Total Grey Matter | > 0.94 | Inconsistent | CAT12 showed higher discrepancies between scan types [7]. |
| Cortical Grey Matter | > 0.90 | Inconsistent | SynthSeg+ demonstrated high reliability for most structures [6]. |
| White Matter | > 0.94 | Inconsistent | — |
| Thalamus | High (ICCs > 0.90) | Lower | Strong agreement with SynthSeg+ [7]. |
| Ventricles | High (ICCs > 0.90) | Lower | — |
| Cerebrospinal Fluid (CSF) | Reliable | Notable discrepancies | CSF and ventricular volumes showed some variability [6]. |
| Age Prediction Accuracy | Comparable between CE-MR and NC-MR | Inconsistent | SynthSeg+ models yielded comparable results for both scan types [6] [7]. |
Interpretation of Comparative Results
The data indicates that SynthSeg+, a deep learning-based tool, consistently demonstrates high reliability (with ICCs predominantly > 0.90) between CE-MR and NC-MR scans across most brain structures [6] [7]. This robustness suggests it is less sensitive to the image contrast changes induced by gadolinium. In contrast, CAT12 exhibited inconsistent and generally poorer performance when comparing the two scan types, leading to higher volumetric discrepancies [7]. This highlights a greater vulnerability to technical heterogeneity in traditional segmentation pipelines.
It is important to note that while SynthSeg+ showed high agreement for most structures, some discrepancies were noted in CSF and ventricular volumes [6]. Furthermore, when the volumetric data was used for a secondary application like brain age prediction, models built using SynthSeg+ measurements from CE-MR scans performed comparably to those built from NC-MR scans, reinforcing the tool's utility [7].
To implement a robust research workflow for brain volumetry that accounts for technical heterogeneity, scientists require a suite of software, data, and methodological resources.
Table 2: Essential Toolkit for CE-MR Brain Volumetry Research
| Tool/Resource | Function/Description | Relevance to CE-MR Research |
|---|---|---|
| SynthSeg+ | A deep learning-based tool for robust brain segmentation. | Key solution for mitigating contrast-induced heterogeneity; enables reliable volumetry from CE-MR scans [6] [7]. |
| 3D Slicer | Open-source platform for medical image informatics and visualization. | Used for image analysis, visualization, and processing of DICOM data (MRI, CT) [18]. |
| Clinical CE-MR Datasets | Retrospective collections of clinically acquired contrast-enhanced scans. | Underutilized resource that can significantly expand sample sizes for retrospective research [6] [7]. |
| OpenNeuro | Public repository hosting over 1,240 neuroimaging datasets. | Source of diverse imaging data (MRI, PET, MEG) for method development and validation [19]. |
| Gadolinium-Based Contrast Agents (GBCAs) | Chemical compounds used to enhance contrast in MRI. | The source of technical heterogeneity; choice of agent (e.g., macrocyclic vs. linear) can impact safety and possibly image properties [20]. |
| mdbrain Software | A CE-certified, deep learning-based clinical tool for brain volumetry. | Example of a commercial tool trained on multi-scanner data, though performance across CE-MR may vary [21]. |
Beyond Software: The Impact of Hardware and Acquisition Parameters
Technical heterogeneity is not limited to the use of contrast agents. A 2025 study by T. A. et al. demonstrated that the MRI hardware itself introduces significant variation in volumetric results. This study examined the same healthy subjects across different scanners from Philips and Siemens at both 1.5T and 3T field strengths [21].
The findings revealed "significantly different volumetry results for all examined brain regions beside the ventricular system between the different MRI devices." This hardware-induced variability persisted even when the same automated software (mdbrain) was used for analysis [21]. This underscores a critical point: reliable multi-scanner and longitudinal research requires consistency in scanning hardware or advanced methods to harmonize data across different sources. The choice of segmentation tool, as demonstrated with SynthSeg+, is one key method for mitigating this broader technical challenge.
Logical Framework for Research Application
The relationship between the research problem, the experimental evidence, and the resulting recommendation forms a clear logical pathway for scientists to follow.
The compelling experimental data indicates that deep learning-based approaches, particularly SynthSeg+, can reliably process contrast-enhanced MRI scans for brain morphometric analysis, showing high consistency with non-contrast scans across most brain structures [6] [7]. This finding directly addresses the core research problem of technical heterogeneity and opens new avenues for utilizing vast repositories of clinically acquired CE-MR images in neuroimaging research.
The successful application of such tools can significantly expand available datasets for retrospective analyses, thereby enhancing the statistical power of studies and potentially accelerating discoveries in neuroscience and drug development. Future efforts should focus on the further development and validation of robust, hardware-agnostic algorithms and the establishment of standardized protocols for data harmonization, ultimately maximizing the value of every clinical scan for research purposes.
Brain volumetry, the quantitative measurement of brain structure volumes using magnetic resonance imaging (MRI), has emerged as a critical biomarker in neuroscience research and therapeutic development. This precise quantification enables researchers and clinicians to track neurodevelopmental processes, monitor neurodegenerative disease progression, and evaluate therapeutic efficacy with objective, data-driven metrics. The application of brain volumetry spans from fundamental research in animal models to clinical trials in human populations, providing a crucial bridge between preclinical findings and clinical applications. In the context of drug development, particularly for neurodegenerative conditions, volumetric measurements serve as valuable secondary endpoints or even primary outcomes in proof-of-concept studies, offering insights into potential disease-modifying effects of investigational therapies.
The evolution of brain volumetry has been significantly accelerated by advances in MRI technology and computational analysis methods, especially deep learning-based segmentation tools. These innovations have transformed volumetry from a labor-intensive manual process to an efficient, automated pipeline capable of handling large-scale datasets with high reproducibility. As the field progresses, a key methodological question has emerged regarding the comparative value of contrast-enhanced (CE-MR) versus non-contrast (NC-MR) MRI protocols for volumetric analysis. This comparison carries significant implications for both clinical practice and research, influencing protocol selection in longitudinal studies and clinical trials where scan time, cost, and patient safety considerations must be balanced against measurement precision and reliability.
Technical Foundations: Contrast-Enhanced vs. Non-Contrast MRI for Volumetric Analysis
The fundamental technical distinction in brain MRI volumetry lies in whether gadolinium-based contrast agents are administered to enhance tissue visualization. Contrast-enhanced MRI (CE-MR) employs paramagnetic contrast agents that shorten the T1 relaxation time of nearby water protons, resulting in signal hyperintensity on T1-weighted images in vascularized tissues and regions with compromised blood-brain barrier integrity. This enhancement improves delineation of certain pathological features, particularly in neuro-oncology, inflammatory conditions, and vascular pathologies. However, the administration of contrast agents introduces additional considerations, including cost, scan time, and potential safety concerns regarding gadolinium deposition in tissues.
Non-contrast MRI (NC-MR) sequences, including T1-weighted, T2-weighted, and diffusion-weighted imaging, provide structural information based on intrinsic tissue properties without exogenous agents. Historically, CE-MR was often considered superior for certain clinical applications, but recent advances in computational analysis, particularly deep learning approaches, have demonstrated that NC-MR can yield highly reliable volumetric measurements for most brain structures while avoiding the limitations associated with contrast administration.
Table 1: Key Technical Characteristics of Contrast-Enhanced vs. Non-Contrast MRI for Brain Volumetry
| Characteristic | Contrast-Enhanced MRI (CE-MR) | Non-Contrast MRI (NC-MR) |
|---|---|---|
| Contrast Mechanism | Exogenous gadolinium-based agents shorten T1 relaxation | Intrinsic tissue properties (T1, T2, PD) |
| Visualization of Pathology | Enhanced for lesions with blood-brain barrier disruption or high vascularity | Limited for some pathologies without intrinsic contrast |
| Scan Time | Longer (additional time for contrast administration and post-contrast sequences) | Shorter (no waiting time for contrast) |
| Safety Considerations | Risk of allergic reactions, nephrogenic systemic fibrosis, gadolinium deposition | No contrast-related risks |
| Cost | Higher (contrast agent cost + additional imaging time) | Lower |
| Quantitative Reliability | Varies by structure; potential quantification artifacts from contrast | High reliability for most structures; no contrast-induced artifacts |
| Longitudinal Applications | Potential variability due to contrast dose/clearance differences | More consistent across repeated scans |
Comparative Reliability for Volumetric Measurements
Recent comparative studies have directly addressed the measurement reliability of CE-MR versus NC-MR for brain volumetry. A 2025 comparative study by Aman et al. systematically evaluated morphometric measurements from CE-MR and NC-MR scans in 59 normal participants using two different segmentation tools: the traditional CAT12 toolbox and the deep learning-based SynthSeg+ [6].
The findings demonstrated that the deep learning approach (SynthSeg+) achieved high reliability for most brain structures between CE-MR and NC-MR scans, with intraclass correlation coefficients (ICCs) exceeding 0.90 for the majority of measured structures [6]. This indicates that modern segmentation tools can effectively extract accurate volumetric information from both contrast-enhanced and non-contrast images for most brain regions. However, some discrepancies were observed in cerebrospinal fluid (CSF) and ventricular volumes, suggesting that contrast administration may influence the segmentation boundaries in fluid-filled spaces [6].
Notably, the traditional segmentation approach (CAT12) showed inconsistent performance between the two scan types, highlighting how the choice of analysis tool can significantly impact the comparability of volumetric data derived from different MRI protocols [6]. This finding underscores the importance of selecting appropriate, validated segmentation methods when working with contrast-enhanced images for volumetric analysis.
Experimental Approaches and Methodologies
Comparative Analysis Protocol
The protocol for comparing volumetric measurements between CE-MR and NC-MR images follows a structured approach to ensure valid comparisons. In the seminal study on this topic, researchers implemented a within-subject design where each participant underwent both CE-MR and NC-MR scans, typically in the same imaging session [6]. This design controls for interscan variability and biological fluctuations.
The experimental workflow encompasses several critical stages: (1) image acquisition using matched parameters for both scan types except for contrast administration; (2) image preprocessing including noise reduction, intensity normalization, and spatial registration; (3) volumetric segmentation using multiple algorithms (both traditional and deep learning-based); (4) statistical comparison of regional volumes derived from CE-MR versus NC-MR; and (5) validation through age prediction models to assess the biological relevance of measurements from both scan types.
Table 2: Key Segmentation Tools for Brain Volumetry
| Tool Name | Methodology | Strengths | Limitations |
|---|---|---|---|
| SynthSeg+ | Deep learning-based segmentation | High reliability (ICCs >0.90) for both CE-MR and NC-MR; robust across scan types [6] | Limited validation in pathological populations |
| CAT12 | Computational anatomy toolbox | Established traditional method; extensive validation history | Inconsistent performance between CE-MR and NC-MR [6] |
| BOUNTI | Deep learning-based parcellation | Specifically designed for challenging applications (e.g., fetal MRI) [22] | Specialized for fetal brain; limited generalizability |
| Custom DL Pipelines | Various neural network architectures | Can be optimized for specific research questions and sample characteristics | Require substantial technical expertise and validation |
The imaging parameters typically include high-resolution 3D T1-weighted sequences with isotropic voxels (approximately 1mm³) to enable precise volumetric measurements. For the CE-MR protocol, images are acquired after administration of a standard dose of gadolinium-based contrast agent (typically 0.1 mmol/kg body weight), with a delay of approximately 5-10 minutes to allow for contrast distribution [6].
The segmentation process employs either atlas-based registration or deep learning approaches to parcellate the brain into regions of interest. The deep learning method SynthSeg+, which demonstrated high reliability in comparative studies, utilizes a convolutional neural network architecture trained on diverse datasets to ensure robustness across contrast conditions and scanning parameters [6].
Emerging Non-Contrast Alternatives
Beyond traditional structural imaging, several emerging non-contrast techniques show promise for enhancing volumetric analyses in specific applications. Synthetic MRI represents one such innovation, enabling simultaneous quantification of multiple tissue properties (R1 and R2 relaxation rates, proton density) in a single acquisition [23]. This quantitative approach, which requires only approximately 6 minutes for full-head coverage, allows generation of multiple contrast-weighted images computationally after the scan, while also supporting automatic brain tissue segmentation and volumetry [23].
Another significant advancement comes from virtual contrast-enhanced (vCE) techniques, which use neural networks to generate synthetic contrast-enhanced images from non-contrast inputs. A 2025 systematic investigation demonstrated that the performance of vCE breast MRI significantly benefits from incorporating multiple input sequences, particularly T1-weighted, T2-weighted, and multi-b-value diffusion-weighted imaging [24]. While this approach has been primarily applied outside the brain to date, the underlying methodology represents a promising direction for minimizing contrast use without sacrificing diagnostic information.
Data Presentation: Comparative Volumetric Analysis
The comparative performance of CE-MR versus NC-MR for brain volumetry can be quantitatively assessed through multiple metrics, including measurement reliability, agreement coefficients, and downstream application performance.
Table 3: Quantitative Comparison of Volumetric Measurements from CE-MR vs. NC-MR
| Metric | CE-MR Performance | NC-MR Performance | Comparative Findings |
|---|---|---|---|
| Reliability (ICC) | Varies by structure and method: SynthSeg+ ICCs >0.90 for most structures [6] | Consistently high with modern tools: SynthSeg+ ICCs >0.90 for most structures [6] | No significant difference for most structures with SynthSeg+; CAT12 shows inconsistencies [6] |
| CSF/Ventricle Volumes | Potential quantification differences due to contrast enhancement effects [6] | More consistent measurements for fluid-filled spaces | Significant discrepancies observed between scan types [6] |
| Age Prediction Accuracy | High accuracy using SynthSeg+ segmentations [6] | Comparable accuracy to CE-MR [6] | No significant difference in age prediction models [6] |
| Segmentation Consistency | Traditional methods (CAT12) show inconsistent performance [6] | More consistent with traditional methods | Deep learning methods (SynthSeg+) minimize inter-protocol differences [6] |
| Clinical/Research Utility | Preferred for specific pathologies with BBB disruption | Suitable for most volumetric applications in neurodegeneration | NC-MR sufficient for most volumetric applications when using appropriate tools [6] |
The data indicate that for the majority of volumetric applications in neurodegenerative disease and drug development, NC-MR protocols yield comparable results to CE-MR when analyzed with modern deep learning-based segmentation tools like SynthSeg+. This equivalence extends to downstream applications such as age prediction models, which showed comparable performance between the two scan types [6]. The preservation of this biological relationship suggests that NC-MR-derived volumetry captures equivalent neurobiological information to CE-MR for tracking brain development and aging.
Applications in Neurodegenerative Disease and Drug Development
Tracking Neurodegeneration
In neurodegenerative conditions, brain volumetry provides critical insights into disease progression and pathological burden. Alzheimer's disease characteristically involves atrophy of the hippocampus and medial temporal lobe structures, while frontotemporal dementia demonstrates predominant frontal and anterior temporal volume loss, and Parkinson's disease shows progressive brainstem and basal ganglia alterations. Quantitative volumetry enables objective tracking of these patterns throughout the disease course.
In drug development, volumetric measures serve as valuable biomarkers for assessing therapeutic efficacy. In multiple sclerosis clinical trials, for example, whole brain volume loss (brain atrophy) has been established as a key indicator of neuroprotective effects, with a typical annualized atrophy rate of approximately 0.4-1.2% in untreated patients serving as a benchmark for evaluating treatment effects [25] [26]. Similar approaches are being applied across the neurodegenerative spectrum, from Alzheimer's disease to amyotrophic lateral sclerosis.
Advanced volumetric approaches are also being implemented in preclinical models to facilitate translational research. A 2025 study demonstrated the application of deep learning-based segmentation for rapid, reproducible brain volumetry in mouse models of neurodegenerative diseases, achieving high-resolution measurements (78×78×250 μm³ voxels) in just 4.3 minutes at 7 Tesla [25]. This methodological advance supports more efficient preclinical therapeutic evaluation while enhancing animal welfare through reduced anesthesia exposure.
Specialized Applications Across Populations
Brain volumetry methodologies continue to evolve to address unique challenges across diverse populations and applications. In fetal imaging, where motion presents significant challenges, the BOUNTI pipeline represents a specialized deep learning approach for fetal brain segmentation and parcellation in 3D T2-weighted motion-corrected images [22]. This tool, which implements a refined parcellation protocol with 19 regions-of-interest based on the Developing Human Connectome Project atlas, enables quantitative study of early brain development and detection of aberrant growth patterns [22].
In pediatric populations, where minimizing invasiveness is particularly important, non-contrast approaches offer clear advantages. Synthetic MRI techniques have been successfully applied in pediatric brains, providing simultaneous quantification of multiple tissue parameters and automated volumetry in a single rapid acquisition [23]. Similarly, non-contrast functional lung MRI using matrix-pencil decomposition has been implemented in over 900 measurements in children, demonstrating the feasibility and utility of non-contrast quantitative imaging in pediatric populations [27].
The Scientist's Toolkit: Essential Research Reagents and Solutions
Implementing robust brain volumetry protocols requires specific tools and resources. The following table summarizes key solutions for researchers in this field.
Table 4: Essential Research Reagents and Solutions for Brain Volumetry
| Tool/Solution | Function | Application Notes |
|---|---|---|
| SynthSeg+ Software | Deep learning-based brain segmentation | Demonstrates high reliability for both CE-MR and NC-MR images (ICCs >0.90) [6] |
| dHCP Fetal Brain Atlas | Reference parcellation for developmental studies | Provides age-specific templates for fetal brain volumetry [22] |
| BOUNTI Pipeline | Automated parcellation for fetal brain MRI | Enables robust segmentation of 3D T2w motion-corrected fetal images [22] |
| Synthetic MRI (SyMRI) | simultaneous quantification of R1, R2, PD | Enables quantitative tissue characterization and multiple contrast generation from single scan [23] |
| Ultra-Sensitive Assay Platforms (Simoa) | Detection of fluid biomarkers in CSF and plasma | Correlates volumetric changes with molecular biomarkers (e.g., NfL, GFAP) [26] |
| Custom Deep Learning Pipelines | Subject-specific optimization for challenging data | Adaptable to unique research needs, including animal models [25] |
| Next-Generation Contrast Agents | Enhanced stability and effectiveness for CE-MR | Cross-linked metallo coiled coils show 30% improved relaxivity [28] |
Visualizing Experimental Workflows
The comparative analysis of contrast-enhanced versus non-contrast MRI for brain volumetry follows a systematic workflow to ensure valid and reproducible results. The following diagram illustrates this process:
Comparative Volumetry Workflow - This diagram illustrates the systematic approach for comparing contrast-enhanced (CE-MR) and non-contrast (NC-MR) MRI protocols for brain volumetry, culminating in evidence-based protocol recommendations.
The relationship between different MRI protocols, segmentation methodologies, and their applications in neurodegenerative disease research can be visualized as follows:
Methodology-Application Relationships - This diagram maps the relationships between MRI protocols, segmentation methods, and their research applications, highlighting the superior performance of deep learning approaches.
The evolving landscape of brain volumetry reflects a broader transition toward efficient, minimally invasive biomarker strategies in neuroscience research and drug development. Comparative evidence indicates that for most volumetric applications in neurodegenerative disease, non-contrast MRI protocols paired with modern deep learning segmentation tools provide measurements comparable to contrast-enhanced approaches, while offering advantages in safety, accessibility, and efficiency. This equivalence enables researchers to design longitudinal studies and clinical trials with reduced participant burden and enhanced feasibility without sacrificing measurement precision.
Future developments in this field will likely focus on several key areas: (1) refinement of deep learning approaches to further improve accuracy and robustness across diverse populations and pathological conditions; (2) integration of volumetric biomarkers with fluid biomarkers and other modalities to create comprehensive biomarker panels; (3) standardization of protocols and analytical pipelines to enhance reproducibility across sites and studies; and (4) continued innovation in non-contrast imaging techniques, including synthetic MRI and virtual contrast enhancement. As these advancements mature, brain volumetry will solidify its position as an essential tool in the quest to understand, monitor, and treat neurodegenerative diseases.
Advanced Segmentation Methodologies and Workflow Integration
In brain volumetry research, segmenting anatomical structures from magnetic resonance imaging (MRI) is a foundational step for quantitative analysis. The tools for this task span a broad spectrum, from traditional software relying on probabilistic atlases and manual correction to modern deep learning platforms that offer fully automated, high-throughput segmentation. This evolution is particularly critical within the context of contrast-enhanced (CE-MR) versus non-contrast MR (NC-MR) brain volumetry research. CE-MR scans, while routinely acquired in clinical practice for enhanced lesion visibility, have historically been an underutilized resource in research due to concerns that the contrast agent could alter intensity-based morphometric measurements [6] [7]. The emergence of sophisticated deep learning tools is challenging this paradigm, demonstrating that such scans can be reliably used, thereby potentially expanding available datasets for neuroscience research [7] [29].
This guide objectively compares segmentation tools by examining their performance in controlled experiments, with a specific focus on the pivotal question of compatibility between CE-MR and NC-MR scans. We summarize quantitative data into structured tables and detail the experimental methodologies that underpin these findings, providing researchers and drug development professionals with the evidence needed to select appropriate tools for their neuroimaging workflows.
Comparative Analysis of Segmentation Tools
Segmentation tools can be broadly categorized by their underlying methodology. Traditional and Algorithmic Software often incorporates statistical models, atlases, and manual intervention. A prominent example is FreeSurfer, a widely used tool that utilizes probabilistic atlas-based techniques for automated segmentation [29]. Deep Learning Platforms leverage convolutional neural networks (CNNs) and other AI models to perform end-to-end segmentation. These include tools like SynthSeg+, a publicly available deep learning model designed to be robust to variations in MRI contrasts and sequences [6] [7].
The performance gap between these categories is evident in clinical software benchmarks. A 2023 study on prostate MRI segmentation found that deep learning models (V-net, U-net, EfficientDet) consistently outperformed the proprietary algorithm in Siemens' Syngo.Via software and a multi-atlas algorithm in Raystation 9B, achieving Dice coefficients of 0.914 compared to 0.855–0.887 [30].
Key Performance Metrics in Brain Volumetry
The reliability of volumetric measurements is typically assessed using several key metrics:
- Dice Similarity Coefficient (Dice): Measures the spatial overlap between the automated segmentation and a ground truth mask. A value of 1 indicates perfect overlap [30].
- Intraclass Correlation Coefficient (ICC): Assesses the consistency or agreement of volumetric measurements between different scan types (e.g., CE-MR vs. NC-MR). ICCs greater than 0.90 are generally considered to indicate high reliability [7].
- Hausdorff Distance (HD): Quantifies the largest distance between the surfaces of two segmentations, with lower values indicating better performance in capturing boundaries [31].
Quantitative Performance: Contrast-Enhanced vs. Non-Contrast MRI
The following table synthesizes key findings from a 2025 comparative study that evaluated the reliability of morphometric measurements from CE-MR and NC-MR scans in normal individuals using two segmentation tools: the deep learning-based SynthSeg+ and the more traditional CAT12 [6] [7].
Table 1: Performance of Segmentation Tools on CE-MR vs. NC-MR Scans
| Segmentation Tool | Underlying Methodology | Reliability (ICC) for Most Brain Structures | Discrepancies Noted | Performance in Age Prediction Models |
|---|---|---|---|---|
| SynthSeg+ | Deep Learning | High (ICCs > 0.90) | Minor discrepancies in CSF and ventricular volumes | Comparable results for both CE-MR and NC-MR scans |
| CAT12 | Traditional/Algorithmic | Inconsistent | Relatively higher discrepancies between CE-MR and NC-MR | Not specified |
This data demonstrates that deep learning-based approaches like SynthSeg+ can achieve high consistency across scan types, making them particularly suitable for leveraging clinically acquired CE-MR images in research settings.
Experimental Protocols and Methodologies
Core Experimental Protocol for Tool Validation
The foundational experiment that provides the data in Table 1 was conducted as follows [6] [7]:
- Objective: To evaluate the reliability of brain volumetry in CE-MR versus NC-MR scans.
- Dataset: The study utilized 59 paired T1-weighted CE-MR and NC-MR scans from clinically normal individuals (age range: 21–73 years).
- Segmentation Tools: The volumetric measurements were performed using two tools: the deep learning-based SynthSeg+ and the more traditional CAT12.
- Analysis: The researchers analyzed volumetric measurements for multiple brain structures and computed Intraclass Correlation Coefficients (ICCs) to assess agreement between measurements from the two scan types. As a secondary objective, they also investigated the utility of both scan types in age prediction models.
This protocol highlights a direct, paired-comparison approach that controls for inter-subject variability, providing a robust framework for assessing a tool's robustness to MRI acquisition parameters.
Benchmarking Methodology in Multi-Organ Segmentation
A similar rigorous methodology is employed in broader segmentation benchmarks. A study benchmarking multi-organ segmentation tools for abdominal MRI detailed the following process [31]:
- Dataset Curation: A subset of 40 volumes from a public dataset was curated, containing 10 volumes each from four different T1-weighted MRI phases (pre-contrast, arterial, venous, delayed).
- Ground Truth: Ten abdominal structures were manually annotated by an experienced grader, with all annotations reviewed by a senior radiologist.
- Tool Evaluation: Three publicly available segmentation tools (MRSegmentator, TotalSegmentator MRI, TotalVibeSegmentator) were run on the curated dataset.
- Performance Quantification: Segmentation performance was quantitatively measured using the Dice Similarity Coefficient (DSC) and Hausdorff Distance (HD) error, followed by statistical analysis (Friedman test) to compare the tools.
Workflow for Segmentation Tool Selection and Validation
The diagram below illustrates a generalized experimental workflow for selecting and validating a segmentation tool, integrating elements from the cited protocols.
The Scientist's Toolkit: Key Research Reagents and Materials
For researchers aiming to replicate or design similar comparative studies, the following table lists essential "research reagents" and their functions as derived from the experimental protocols.
Table 2: Essential Materials for Segmentation Tool Benchmarking
| Item / Resource | Function in the Experiment | Example from Cited Studies |
|---|---|---|
| Paired MRI Dataset | Provides matched data to control for biological variability when testing the effect of a parameter (e.g., contrast agent). | 59 paired CE-MR and NC-MR scans from normal individuals [7]. |
| Manual Segmentation Masks | Serves as the ground truth (reference standard) for evaluating the accuracy of automated tools. | Masks created by expert radiologists [30] [31]. |
| Public Segmentation Tools | The objects under evaluation; can range from traditional software to deep learning platforms. | SynthSeg+, CAT12, MRSegmentator, TotalSegmentator [7] [31]. |
| Performance Metrics Scripts | Code or software to quantitatively compare automated results against the ground truth. | Calculations for Dice, ICC, Hausdorff Distance [30] [31]. |
| Statistical Analysis Package | Used to determine if performance differences between tools or conditions are statistically significant. | Friedman test and post-hoc Nemenyi test [31]. |
The segmentation tool spectrum is firmly shifting towards deep learning platforms, which demonstrate superior robustness in challenging scenarios like deriving consistent volumetry from both contrast-enhanced and non-contrast MRI. Evidence from rigorous benchmarking studies indicates that tools like SynthSeg+ show high reliability (ICCs > 0.90) across scan types, enabling the broader use of diverse clinical image archives in research [7]. This capability is vital for accelerating large-scale neuroimaging studies and drug development projects.
Future developments will likely focus on improving the generalizability and interpretability of AI models, along with their integration into standardized clinical workflows [29]. As these tools evolve, continuous benchmarking against standardized datasets and well-defined experimental protocols, as detailed in this guide, will remain essential for researchers to make informed decisions.
The clinical application of contrast-enhanced magnetic resonance imaging represents a vast and underutilized resource for large-scale neuroscience research. While essential for clinical evaluations of blood-brain barrier integrity or tumor detection, CE-MR scans have traditionally been excluded from quantitative morphometric analysis due to concerns that contrast agents could alter intensity-based measurements, leading to technical heterogeneity. This exclusion has significantly limited potential sample sizes for research studies. However, recent advances in deep learning segmentation tools are challenging this paradigm. New evidence demonstrates that certain algorithms can reliably extract volumetric measurements from CE-MR scans, enabling their use alongside non-contrast MR images in research contexts. This breakthrough is particularly significant for creating larger, more powerful datasets for drug development and neurological disease monitoring, as it allows researchers to leverage existing clinical archives that were previously inaccessible for volumetry studies. This comparative guide examines the performance of one such tool, SynthSeg+, against other segmentation alternatives in processing CE-MR images for brain volumetry.
Experimental Comparison: SynthSeg+ vs. Alternative Segmentation Tools
Core Experimental Protocol
A foundational 2025 study by Aman et al. directly addressed the challenge of utilizing CE-MR scans for brain morphometry by conducting a systematic comparison of segmentation tools [6] [7]. The experimental design involved analyzing paired CE-MR and NC-MR T1-weighted scans from 59 clinically normal participants, spanning a wide age range (21-73 years) to ensure generalizability. The researchers employed two distinct segmentation tools on the same dataset: the deep learning-based SynthSeg+ (an extension of the SynthSeg model) and the more conventional CAT12 toolbox, part of the SPM software. The primary evaluation metrics included Intraclass Correlation Coefficients to measure agreement between measurements from CE-MR and NC-MR scans, alongside volumetric comparisons of key brain structures and the efficacy of age prediction models based on the resulting segmentations [7].
Quantitative Performance Comparison
Table 1: Segmentation Tool Performance on CE-MR vs. NC-MR Scans
| Performance Metric | SynthSeg+ | CAT12 |
|---|---|---|
| Overall Reliability (ICC) | High (ICCs > 0.90 for most structures) [7] | Inconsistent performance [6] |
| Large Structures Agreement | Excellent (ICC > 0.94) [7] | Higher discrepancies [7] |
| Lowest Reliability Structure | Brain Stem (still robust) [7] | Not specified |
| CSF/Ventricles Volumes | Discrepancies noted [6] | Not specified |
| Age Prediction Models | Comparable results for both scan types [6] | Not specified |
| Segmentation Failure Rate | No failures reported [7] | 4 exclusions due to CE-MR failure [7] |
Methodological Workflow
Table 2: Key Methodological Steps in the Comparative Analysis
| Experimental Phase | Description | Significance |
|---|---|---|
| Participant Cohort | 59 normal participants (age 21-73; 24 female); all without known neurological disorders [7] | Ensures findings relevant to healthy neuroanatomy |
| Image Acquisition | Paired T1-weighted CE-MR and NC-MR scans acquired for each participant [7] | Enables direct within-subject comparison |
| Tool Implementation | SynthSeg+ and CAT12 applied to both scan types for each participant [7] | Allows direct tool performance comparison |
| Statistical Analysis | ICCs, volumetric measurements, and age prediction efficacy analyzed [7] | Provides comprehensive reliability assessment |
Diagram 1: Experimental workflow for comparing segmentation tools on CE-MR and NC-MR scans.
Technical Basis of SynthSeg+ Performance
Domain Randomization: The Core Innovation
The remarkable robustness of SynthSeg+ stems from its foundational training strategy called domain randomization [32]. Unlike conventional supervised models trained exclusively on real medical images of specific contrasts, SynthSeg+ is trained entirely on synthetic data generated from anatomical label maps. During training, the model is exposed to synthetic scans where all parameters—including contrast, resolution, orientation, and artifacts—are fully randomized. This approach forces the network to learn domain-independent features that generalize across the immense variability found in clinical imaging, making it particularly suited for handling the distinct appearance of CE-MR scans without requiring retraining [32].
Architecture and Capabilities
SynthSeg+ builds upon the standard SynthSeg framework, which utilizes a convolutional neural network architecture designed for processing 3D brain images. A key advantage is its modality-agnostic nature; the same model can segment T1-weighted, T2-weighted, FLAIR, and even CT scans without modification [33]. The tool provides whole-brain segmentation into 95+ neuroanatomical structures following FreeSurfer's labeling protocol, outputs high-resolution (1mm isotropic) segmentations regardless of input resolution, and includes automated quality control metrics to flag potential segmentation failures [33]. The "robust" variant (selected with the --robust flag) offers enhanced performance for challenging clinical data with low signal-to-noise ratio or large slice spacing, which may be particularly beneficial for certain CE-MR acquisitions [33].
Diagram 2: Domain randomization enables modality-agnostic segmentation in SynthSeg+.
The Researcher's Toolkit for CE-MR Volumetry
Table 3: Essential Research Tools for Contrast-Enhanced MRI Volumetry
| Tool/Resource | Function/Role | Application Notes |
|---|---|---|
| SynthSeg+ | Deep learning-based segmentation of brain MRI across contrasts and resolutions [7] [33] | Primary tool for reliable CE-MR volumetry; use --robust flag for challenging data |
| CAT12 | Computational Anatomy Toolbox for SPM; alternative segmentation pipeline [7] | Shows inconsistent performance on CE-MR; higher discrepancies vs. NC-MR |
| FreeSurfer Suite | Comprehensive software package for brain MRI analysis [33] | Integration platform for SynthSeg+; provides additional validation tools |
| ICC Statistical Analysis | Measures consistency between CE-MR and NC-MR volumetric measurements [7] | Essential validation metric; should exceed 0.90 for research reliability |
| Paired CE-MR/NC-MR Dataset | Gold-standard for method validation [7] | Enables within-subject comparison; critical for establishing tool reliability |
Implications for Research and Drug Development
The demonstrated reliability of SynthSeg+ with contrast-enhanced MRI scans has profound implications for neuroscience research and pharmaceutical development. By validating CE-MR as a viable data source for volumetry, researchers can potentially expand their datasets by orders of magnitude through inclusion of previously inaccessible clinical archives. This is particularly valuable for:
- Longitudinal Treatment Studies: Enables volumetric tracking in patients who routinely receive contrast agents for disease monitoring (e.g., multiple sclerosis, brain tumors) [7].
- Retrospective Analyses: Facilitates mining of historical clinical datasets for neurodegenerative disease biomarkers without additional scanning costs [32].
- Multi-Center Trials: Increases protocol flexibility by accommodating both contrast and non-contrast scans within the same analytical framework [33].
While the technology shows remarkable promise, researchers should note the observed discrepancies in CSF and ventricular volumes between CE-MR and NC-MR scans when using SynthSeg+ [6]. This suggests that studies focusing specifically on these structures may require additional validation when including contrast-enhanced scans. Nevertheless, for the majority of brain structures, SynthSeg+ provides the methodological foundation for leveraging the vast, untapped resource of clinical CE-MR images in large-scale brain volumetry research.
The pursuit of precise neuroimaging biomarkers is crucial for advancing our understanding of brain aging and neurodegenerative diseases. In clinical and research settings, magnetic resonance imaging (MRI) serves as a fundamental tool for quantifying brain structure, yet methodological questions persist regarding the reliability of different imaging protocols. Specifically, the comparative value of contrast-enhanced (CE-MR) versus non-contrast MR (NC-MR) scans for automated volumetry and age prediction remains a significant point of investigation. This guide objectively compares the performance of these approaches, presenting supporting experimental data to inform researchers, scientists, and drug development professionals.
Recent studies have demonstrated that deep learning-based approaches can reliably extract quantitative information from clinically acquired images, potentially expanding the dataset available for large-scale research. The following sections provide a detailed comparison of methodological protocols, performance metrics, and practical applications to support evidence-based decision-making in neuroimaging research.
Performance Comparison: Segmentation Tools and Brain Age Prediction
Volumetric Measurement Reliability
The core of brain volumetry lies in the accurate segmentation of different brain structures. The table below summarizes the performance of two prominent segmentation tools when applied to CE-MR versus NC-MR images, based on a comparative study of 59 normal participants (age range: 21-73 years) [6] [7].
Table 1: Comparison of Segmentation Tool Performance on CE-MR vs. NC-MR
| Segmentation Tool | Key Principle | Reliability (CE-MR vs. NC-MR) | Structures with Highest Agreement (ICC) | Structures with Notable Discrepancies |
|---|---|---|---|---|
| SynthSeg+ [6] [7] | Deep learning-based; robust to sequence variations | High | Most brain regions (ICC > 0.90) [6] [7] | CSF and ventricular volumes [6] [7] |
| CAT12 [6] [7] | Computational anatomy toolbox; based on statistical models | Inconsistent | Larger brain structures | Relatively higher discrepancies across multiple regions [6] [7] |
Abbreviation: ICC, Intraclass Correlation Coefficient.
The findings indicate that SynthSeg+ demonstrates superior consistency, making it particularly suitable for analyzing CE-MR scans often acquired in clinical practice. In contrast, CAT12 showed less consistent performance, with failures reported on some CE-MR images [7].
Brain Age Prediction Accuracy
Brain age prediction models use structural MRI to estimate the biological age of a brain. A positive "brain age gap" (where predicted age exceeds chronological age) is considered a biomarker of accelerated aging or neurodegeneration [34] [35]. The following table compares the performance of different modeling approaches.
Table 2: Performance Comparison of Brain Age Prediction Models
| Model / Framework | Input Data | Key Innovation | Performance (MAE in years) | Application to Neurodegeneration |
|---|---|---|---|---|
| Novel 3D CNN Model [34] | Clinical 2D T1-weighted MRI | Trained on research 3D scans, sliced to mimic 2D clinical scans [34] | 2.73 (after bias correction) [34] | Significant brain age gap in Alzheimer's disease (AD) vs. cognitively unimpaired (CU) (p < 0.001) [34] |
| Brain Vision Graph Neural Network (BVGN) [35] | T1-weighted MRI (ADNI) | Incorporates brain connectivity and complexity via graph neural networks [35] | 2.39 [35] | Strong discriminative capacity between cognitive states (CN vs. MCI, AUC=0.885) [35] |
| SynthSeg+ Volumes [6] [7] | CE-MR and NC-MR T1-weighted scans | Uses volumetric features from a robust segmentation tool | Comparable age prediction accuracy for both CE-MR and NC-MR scans [6] | Facilitates use of clinical CE-MR archives for research [6] [7] |
Abbreviations: MAE, Mean Absolute Error; AUC, Area Under the Receiver Operating Characteristic Curve; ADNI, Alzheimer's Disease Neuroimaging Initiative; MCI, Mild Cognitive Impairment.
Detailed Experimental Protocols
Protocol for Comparative Volumetric Analysis
A 2025 study by Aman et al. provides a directly relevant protocol for comparing CE-MR and NC-MR scans [6] [7].
- Participants: 59 clinically normal individuals (age range: 21-73 years; 24 female) with no known neurological disorders [7].
- Image Acquisition: Paired T1-weighted CE-MR and NC-MR scans were acquired for each participant. Initially, 63 image pairs were processed, but four were excluded due to CAT12 segmentation failure on CE-MR images [7].
- Segmentation and Volumetry: The paired scans were processed using two automated segmentation tools:
- Statistical Analysis: The reliability of volumetric measurements between CE-MR and NC-MR was quantified using Intraclass Correlation Coefficients (ICCs) for various brain structures [6] [7]. The efficacy of the scans was further compared by building age prediction models based on the volumetric outputs from each segmentation tool [6] [7].
Protocol for Brain Age Prediction on Clinical 2D Scans
For researchers working with clinical-grade 2D scans, which are common in real-world settings, the following protocol, adapted from a 2025 study, is highly applicable [34].
- Model Training:
- Data: 8,681 research-grade 3D T1-weighted MRI scans from 25 datasets (including the Samsung Medical Center dataset) were used for training [34].
- Preprocessing Pipeline: A key innovation involved slicing the 3D scans with axial gaps larger than 7 mm to mimic the heterogenic nature of clinical 2D scans. These 2D slices were then interpolated back into 3D volumes for model training, helping the model learn from and adapt to clinical data characteristics [34].
- Model Architecture: A 3D DenseNet-169 based model was trained for brain age prediction [34].
- Validation:
- The trained model was tested on an independent set of 175 actual clinical 2D T1-weighted scans from cognitively unimpaired subjects [34].
- The model's clinical relevance was validated by applying it to scans from patients with Alzheimer's disease and observing a significantly higher brain age gap compared to cognitively unimpaired subjects [34].
The workflow for this experiment is illustrated below.
Figure 1: Workflow for brain age prediction model training and validation. The model is trained on processed research 3D scans to predict age from clinical 2D MRI [34].
The Scientist's Toolkit: Essential Research Reagents and Solutions
This section details key computational tools and data resources essential for conducting research in this field.
Table 3: Key Research Reagents and Solutions for MRI Biomarker Extraction
| Tool / Resource | Type | Primary Function | Relevance to Contrast/Non-Contrast Studies |
|---|---|---|---|
| SynthSeg+ [6] [7] | Software Tool | Deep learning-based brain image segmentation | Highly reliable for both CE-MR and NC-MR scans; enables volumetrics from clinical archives [6] [7]. |
| CAT12 [6] [7] | Software Tool | Computational anatomy toolbox for SPM | Shows inconsistent performance on CE-MR scans; less recommended for heterogeneous clinical data [6] [7]. |
| ADNI Dataset [34] [35] | Data Resource | Large, well-characterized neuroimaging dataset | Provides standardized research-grade MRI data (often 3D T1-weighted) for model development and validation [34] [35]. |
| Real-World Clinical PACS [36] | Data Resource | Hospital picture archiving systems | Source of vast, heterogeneous clinical MRI scans (including CE-MR); requires specialized extraction/harmonization pipelines for research use [36]. |
| BVGN Framework [35] | Modeling Framework | Graph-based deep learning for brain age | Incorporates neurobiological connectivity, achieving high accuracy (MAE: 2.39 years) [35]. |
Abbreviation: PACS, Picture Archiving and Communication System.
Advanced Biomarker: Distance Measures for Tracking Atrophy
Beyond simple volumetric measures, advanced analytical frameworks can capture the complex, multidimensional nature of brain atrophy. A 2025 study introduced the use of distance measures to summarize volumetric changes across multiple subregions of a brain area [37].
- Concept: Instead of just tracking the volume change of a large region (e.g., the temporal lobe), this method simultaneously tracks volume changes in its constituent subregions (e.g., inferior, lateral, and supratemporal gray matter). The overall change in the large region is then summarized by calculating the "distance" between the baseline and follow-up configurations in a multidimensional space defined by the subregional volumes [37].
- Measures Used: The study evaluated multiple distance metrics, including Euclidean distance (straight-line distance), Manhattan distance (sum of absolute differences), and angular distance (angle between points from the origin) [37].
- Performance: This approach consistently outperformed traditional direct volumetric measures in predicting future diagnostic status (conversion from normal to Mild Cognitive Impairment) [37].
The conceptual framework of this approach is illustrated below.
Figure 2: Conceptual framework for using distance measures to quantify brain atrophy. Volumes of subregions define a point in multi-dimensional space; the distance between baseline and follow-up points summarizes overall atrophy [37].
The comparative data and protocols presented in this guide lead to several key conclusions for researchers in the field:
- For Volumetric Biomarkers: Deep learning-based tools like SynthSeg+ are highly reliable for extracting volumetric biomarkers from both contrast-enhanced and non-contrast clinical MRI scans. This opens up vast clinical archives for retrospective research, overcoming previous limitations due to technical heterogeneity [6] [7].
- For Brain Age Prediction: Innovative frameworks, such as the 3D CNN model for 2D scans and the BVGN, demonstrate that accurate brain age prediction is feasible using clinical-grade images. The resulting brain age gap is a sensitive biomarker for distinguishing cognitive states and shows promise for early detection of neurodegenerative diseases [34] [35].
- For Tracking Disease Progression: Advanced analytical approaches like distance measures can provide a more nuanced and sensitive quantification of brain atrophy over time compared to traditional volumetric measures, potentially improving predictive models for cognitive decline [37].
The growing evidence supports the validity of using clinically acquired MRIs, including contrast-enhanced scans, for robust neuroscience research, thereby significantly expanding the potential scale and scope of neuroimaging studies.
Integrating Volumetry into Preclinical and Clinical Trial Workflows
Volumetric magnetic resonance imaging (vMRI) has become a pivotal component in modern neurology, bridging the gap between detailed neuroimaging and clinical decision-making in drug development [38]. The choice between contrast-enhanced (CE-MR) and non-contrast MR (NC-MR) imaging represents a critical methodological consideration for researchers and drug development professionals. While gadolinium-based contrast agents (GBCAs) have traditionally been required for high-resolution mapping of brain metabolism and detecting blood-brain barrier disruption, recent advances in deep learning and quantitative analysis are challenging this paradigm [39].
Clinical brain MRI scans, including contrast-enhanced images, represent an underutilized resource for neuroscience research due to technical heterogeneity and concerns about gadolinium retention [7] [39]. Simultaneously, quantitative MRI volumetry has demonstrated significant value in tracking disease progression in neurological conditions including Alzheimer's disease, multiple sclerosis, epilepsy, and myotonic dystrophy, creating pressing need for standardized, reproducible volumetric approaches [38]. This guide objectively compares the performance of CE-MR versus NC-MR approaches for brain volumetry within preclinical and clinical trial workflows.
Quantitative Comparison of Volumetric Measurement Performance
Reliability Metrics for Brain Structure Volumetry
Table 1: Comparative Reliability of Segmentation Tools for CE-MR vs NC-MR Volumetry
| Brain Structure | SynthSeg+ ICC Values | CAT12 ICC Values | Clinical Significance |
|---|---|---|---|
| Most Brain Regions | >0.90 (High reliability) | Inconsistent performance | Essential for longitudinal drug trial monitoring |
| Larger Structures | >0.94 (Very high reliability) | Higher discrepancies | Critical for tracking disease progression |
| Thalamus | Slight underestimation in CE-MR | Not specified | Important for various neurological disorders |
| CSF & Ventricular Volumes | Notable discrepancies | Inconsistent performance | Key biomarker in neurodegenerative diseases |
| Brain Stem | Robust but lowest correlation | Not specified | Relevant for multiple neurological conditions |
Recent comparative analysis of T1-weighted CE-MR and NC-MR scans from 59 normal participants (aged 21-73 years) using CAT12 and SynthSeg+ segmentation tools demonstrates that deep learning-based approaches like SynthSeg+ can reliably process CE-MR scans for morphometric analysis [7] [6]. The intraclass correlation coefficients (ICCs) were consistently high (>0.90) for most brain regions between CE-MR and NC-MR measurements, with larger structures exhibiting even stronger agreement (ICC > 0.94) [7].
Application-Specific Performance Considerations
Table 2: Volumetric MRI Performance Across Neurological Conditions
| Neurological Condition | Key Volumetric Biomarkers | CE-MR vs NC-MR Considerations | Clinical Trial Utility |
|---|---|---|---|
| Alzheimer's Disease | Hippocampal volume, entorhinal cortex, temporal lobes | NC-MR often sufficient for tracking atrophy patterns | Early diagnosis, monitoring disease progression |
| Multiple Sclerosis | Global brain volume, grey/white matter volume, lesion load | CE-MR preferred for active lesion detection; NC-MR for atrophy | Predicting disability progression, treatment efficacy |
| Huntington's Disease | Striatal volume (caudate, putamen), global atrophy | NC-MR adequate for progressive atrophy monitoring | Pharmacodynamic effects on neurodegeneration |
| Epilepsy | Hippocampal sclerosis, focal cortical dysplasia | NC-MR typically sufficient for surgical planning | Identifying structural abnormalities for intervention |
| Myotonic Dystrophy | Prefrontal cortex, temporal lobes, cerebellum | NC-MR adequate for progressive atrophy monitoring | Tracking disease-specific progression patterns |
In Alzheimer's disease, volumetric MRI enables detection of early hippocampal and temporal lobe atrophy, with annual volume reductions of approximately 4-6% in AD patients compared to 0.5-1% in healthy aging [38]. Similarly, in multiple sclerosis, volumetric analyses quantify grey and white matter degeneration, reflecting motor and cognitive impairment severity, with brain volume loss occurring at approximately 1.24% per year in RRMS compared to 0.1-0.3% in healthy individuals [38].
Experimental Protocols and Methodologies
Standardized MRI Acquisition Protocols
For optimal volumetric analysis in clinical trials, standardized acquisition protocols are essential. The following parameters represent current best practices for vMRI in neurodegenerative disease trials [40]:
- Scanner Requirements: 3 Tesla scanners recommended, though 1.5T acceptable if 3T unavailable
- Recommended Sequences: 3D T1-weighted sequences (MP-RAGE variants: TurboFLASH for Siemens, SPGR for GE, T1-FFE for Philips)
- Acquisition Plane: Sagittal acquisition at 1 mm³ isotropic resolution
- Contrast Administration: For CE-MR: 0.1 mmol/kg gadolinium-based contrast agent, post-contrast T1-weighted imaging
- Quality Control: Centralized oversight of imaging procedures, consistency across sites, personnel training
The Huntington's Disease Regulatory Science Consortium recommends that sequences should be harmonized across participating sites, with personnel trained on imaging procedures and provided with clear documentation [40]. Heterogeneity in acquired data can significantly affect research quality both cross-sectionally and longitudinally.
Comparative Analysis Protocol
The recent comparative study of CE-MR versus NC-MR volumetry employed this methodology [7] [6]:
- Participants: 59 normal participants (age range: 21-73 years; mean = 44.25; SD = 15.51) of whom 24 were female
- Scanning Protocol: Paired T1-weighted CE-MR and NC-MR scans acquired for each participant
- Segmentation Tools: CAT12 and SynthSeg+ applied to both scan types
- Analysis Approach: Volumetric measurements compared using intraclass correlation coefficients (ICCs)
- Age Prediction Models: Developed to test utility of both scan types for biomarker development
This study initially processed 63 image pairs, excluding four due to CAT12 segmentation failure specifically on CE-MR images, highlighting a limitation of traditional segmentation tools with contrast-enhanced scans [7].
Integration Pathways for Volumetry in Drug Development Workflows
Figure 1: Volumetry Integration Across Drug Development Phases. NC-MRI is applicable across later phases with deep learning (DL) processing, while CE-MRI is used more in early phases. Biomarker applications evolve from target engagement to treatment response assessment.
Role of vMRI in Regulatory Science and Biomarker Qualification
Regulatory agencies including the FDA and EMA have established formal processes for qualification of biomarkers like vMRI for specific fit-for-purpose uses in drug development [41]. Volumetric MRI readouts must be both reproducible and modifiable by pharmacological agents to serve as valid biomarkers. Currently, no fMRI or vMRI biomarkers have been fully qualified, though initiatives are underway, such as the European Autism Interventions project seeking qualification of fMRI biomarkers for stratifying autism patients [41].
The HD-RSC has proposed specific recommendations to optimize vMRI use in clinical trials [40]:
- Standardized practices for vMRI use and results reporting
- Targeted research to evaluate advanced vMRI methodologies
- Definition of standard MRI-based anatomical boundaries
- Creation of standard reference datasets for benchmarking
- Broad access to raw images and derived data from observational studies and trials
Essential Research Reagent Solutions for Volumetric MRI
Table 3: Essential Research Materials for MRI Volumetry in Drug Development
| Research Tool Category | Specific Examples | Function in Volumetric Analysis | Applicability to CE-MR/NC-MR |
|---|---|---|---|
| Segmentation Software | SynthSeg+, CAT12, FreeSurfer, NeuroQuant, volBrain, AccuBrain | Automated segmentation of brain structures | SynthSeg+ shows high reliability for both CE-MR and NC-MR [7] |
| Deep Learning Platforms | Custom deep learning models for contrast enhancement mapping | Extract GBCA-equivalent data from single non-contrast MRI scans | Enables NC-MR to provide CE-MR equivalent information [39] |
| Contrast Agents | Gadolinium-based contrast agents (GBCAs) | Enhance visibility of internal structures and lesions | Required for traditional CE-MR approaches; safety concerns exist [39] |
| Quality Control Tools | Cortechs.ai NeuroQuant, Icometrix, SubtleMR | Ensure consistency across scanners and protocols | Essential for both CE-MR and NC-MR in multi-site trials [42] [40] |
| Normative Databases | Age and gender-matched normative databases | Reference for identifying pathological deviations | Critical for both approaches; should account for scan type variability |
Deep learning-based approaches are emerging as particularly valuable, with models trained using quantitative steady-state contrast-enhanced structural MRI datasets now able to generate contrast-equivalent information from single non-contrast MRI scans [39]. These models can approximate cerebral blood volume at sub-millimeter granularity, potentially substituting for gadolinium-based contrast agents in functional assessments.
The integration of volumetry into preclinical and clinical trial workflows requires careful consideration of the comparative advantages of contrast-enhanced versus non-contrast MRI approaches. CE-MR remains essential for specific applications requiring blood-brain barrier assessment or active lesion detection, while NC-MR approaches enhanced with deep learning show increasing promise for longitudinal atrophy monitoring and may benefit from larger available datasets since most clinical scans are performed without contrast [7] [43].
For drug development professionals, the strategic selection between these approaches should consider:
- Specific Research Question: Target engagement vs. disease modification vs. treatment response
- Trial Phase: Early phase (often requiring CE-MR) vs. late phase (often feasible with NC-MR)
- Participant Population: Safety considerations for contrast administration in vulnerable populations
- Technical Capabilities: Availability of advanced segmentation tools and deep learning approaches
- Regulatory Strategy: Alignment with emerging biomarker qualification pathways
As deep learning methods continue to advance and standardization improves, NC-MR volumetry is positioned to play an increasingly prominent role in drug development workflows, potentially enabling more efficient, safer, and more accessible volumetric assessment across the drug development continuum.
Mitigating Technical Variability and Optimizing Protocol Design
In the field of neuroimaging, magnetic resonance imaging (MRI) has become an indispensable tool for clinical and research applications, particularly in brain volumetry. However, the quantitative analysis of brain structure faces a significant challenge: the consistency of measurements across different MRI hardware configurations. This guide objectively examines how scanner manufacturer and magnetic field strength influence brain volumetry results, with specific consideration for both contrast-enhanced (CE-MR) and non-contrast (NC-MR) imaging protocols. Understanding these sources of variability is crucial for researchers and drug development professionals designing multi-centre clinical trials and longitudinal studies, where consistent and reproducible measurements are paramount for accurate assessment of disease progression and therapeutic efficacy.
Comparative Experimental Data on Hardware-Induced Variability
Recent investigations have systematically quantified the effects of MRI hardware on brain volumetry results. The following table consolidates findings from critical studies examining manufacturer and field strength differences.
Table 1: Comparative Brain Volumetry Across Scanner Manufacturers and Field Strengths
| Study Reference | Hardware Compared | Key Findings on Brain Volumetry | Statistical Significance |
|---|---|---|---|
| Volumetry of Selected Brain Regions [21] | Philips 1.5T, Philips 3T, Siemens 1.5T, Siemens 3T (with different head coils) | Significantly different volumetry results for all examined brain regions except the ventricular system between different MRI devices. | P-values < 0.05 for most brain regions between different manufacturers and field strengths. |
| Comparative Analysis of CE-MR vs. NC-MR [6] | Contrast-enhanced vs. Non-contrast MRI at varying field strengths | SynthSeg+ demonstrated high reliability (ICCs > 0.90) for most brain structures between CE-MR and NC-MR scans. | ICCs > 0.90 for most structures; discrepancies in CSF and ventricular volumes. |
| Morphological Brain Analysis Using ULF-MRI [44] | Ultra Low-Field (64 mT) vs. High-Field (1.5T, 3T, 7T) MRI | Accurate brain volumes from ULF-MRI possible with optimized protocols, but significant differences from HF-MRI persist. | Varies by acquisition protocol and brain region. |
Field Strength and Manufacturer Variability
A rigorous prospective study examining multiple scanners provides detailed insights into the specific effects of field strength and manufacturer on volumetric measurements.
Table 2: Field Strength and Manufacturer Effects on Selected Brain Volumes
| Brain Region | Philips 1.5T vs. 3T | Siemens 1.5T vs. 3T | Philips vs. Siemens (3T) | ICC Values (Raw Volume) |
|---|---|---|---|---|
| Total Grey Matter | Significant difference | Significant difference | Significant difference | Ranged from poor to excellent |
| Frontal Lobe Cortex | Some differences non-significant | Significant difference | Significant difference | - |
| Hippocampus | Significant difference | Some differences non-significant | Significant difference | - |
| Brainstem | Significant difference | Some differences non-significant | Significant difference | - |
| Ventricular System | No significant difference | No significant difference | No significant difference | - |
This study demonstrated that simply changing the head coil on the same scanner (Siemens MAGNETOM Vida 3T) did not produce significant differences in volumetry. However, the percentile classification provided by automated software—often used for clinical interpretation—showed even lower agreement (ICC values) than the raw volumetric measurements, highlighting the compounded effect of hardware variability on clinical decision support tools [21].
Detailed Experimental Protocols
Multi-Scanner Volumetry Comparison Protocol
A recent study established a robust methodology for direct scanner comparison, which can serve as a template for validating consistency across imaging sites [21]:
- Subjects: 10 healthy participants (5 male/5 female, mean age 27.4 ± 1.71 years) were scanned on all devices within the same day to minimize biological variability.
- Scanner Models: Philips Achieva 1.5T (8-channel head coil), Philips Ingenia CX 3T (32-channel head coil), Siemens MAGNETOM Aera 1.5T (20-channel head coil), and Siemens MAGNETOM Vida 3T (20-, 32-, and 64-channel head coils).
- Imaging Protocol: T1-weighted 3D sequences were acquired on all scanners with consistent parameters: isometric voxels (approximately 1mm³), no interslice gap, and multiplanar reconstruction capability.
- Volumetric Analysis: The CE-certified software mdbrain (mediaire, v4.9.1) was used for automated segmentation. This deep learning-based tool with U-NET architecture was trained on ~3000 datasets from multiple manufacturers and field strengths.
- Statistical Analysis: Intraclass Correlation Coefficient (ICC) using two-way random effects, single-score, absolute agreement model. Interpretation: <0.5 poor, 0.5-0.74 moderate, 0.75-0.9 good, >0.9 excellent agreement.
Contrast-Enhanced vs. Non-Contrast MRI Protocol
A 2025 study directly addressed the comparability of contrast-enhanced and non-contrast images for volumetry [6]:
- Participants: 59 normal participants aged 21-73 years.
- Imaging: Both T1-weighted CE-MR and NC-MR scans were acquired for each participant.
- Segmentation Tools: Volumetric measurements were performed using both CAT12 and SynthSeg+ segmentation tools.
- Analysis Approach: Compared volumetric measurements between CE-MR and NC-MR scans. Assessed the efficacy of both scan types for age prediction models.
- Key Finding: The deep learning-based tool SynthSeg+ demonstrated high reliability (ICCs > 0.90) for most brain structures between CE-MR and NC-MR scans, with only cerebrospinal fluid (CSF) and ventricular volumes showing notable discrepancies. CAT12 showed inconsistent performance between scan types.
Ultra Low-Field MRI Volumetry Protocol
With increasing interest in accessible MRI, a 2025 study evaluated brain volumetry from Ultra Low-Field (ULF) MRI [44]:
- Imaging Device: Hyperfine Swoop scanner (64 mT field strength) with 8-channel head RF coil array.
- Acquisition Protocol: Harmonized T1- and T2-weighted 3D fast spin-echo sequences in axial, coronal, and sagittal directions (resolution: 1.6×1.6×5.0 mm³ for T1w, 1.5×1.5×5.0 mm³ for T2w).
- Preprocessing: N4 bias field correction and rigid registration to align different imaging directions.
- Validation: Comparison with matched high-field MRI (1.5T, 3T, or 7T) acquired within 12 months.
- Key Recommendation: Combining orthogonal imaging directions, particularly prioritizing coronal T2-weighted images, maximized volumetric accuracy from ULF-MRI.
Experimental Workflow and Signaling Pathways
The following diagram illustrates the core experimental workflow for assessing hardware-induced variability in brain volumetry, synthesizing methodologies from the cited studies.
Diagram 1: Experimental workflow for assessing hardware variability in brain volumetry.
The Scientist's Toolkit: Essential Research Materials
Table 3: Key Research Reagents and Solutions for Multi-Scanner Volumetry Studies
| Tool/Category | Specific Examples | Function/Application | Implementation Notes |
|---|---|---|---|
| MRI Scanners | Philips Achieva, Ingenia; Siemens MAGNETOM Aera, Vida; Hyperfine Swoop (ULF) | Image acquisition across field strengths (1.5T, 3T, 7T, 64mT) | Standardize sequences across platforms; control for head coil differences [21] [44] |
| Segmentation Software | SynthSeg+, CAT12, mdbrain | Automated brain volumetry and tissue classification | SynthSeg+ shows robustness for CE-MR/NC-MR comparisons; mdbrain provides percentile classification [6] [21] |
| Image Processing Tools | Advanced Normalization Tools (ANTs), FreeSurfer | Image registration, bias field correction, spatial normalization | Essential for ULF-MRI analysis and cross-platform alignment [44] |
| Statistical Packages | GraphPad Prism, R, Python | ICC analysis, ANOVA, multiple comparisons testing | Critical for quantifying agreement between scanners and conditions [21] |
| Phantom Materials | Geometric phantoms, biological phantoms | Scanner calibration and protocol validation | Not explicitly covered in results but recommended for study design |
This comparison guide demonstrates that both scanner manufacturer and magnetic field strength significantly influence brain volumetry results, affecting nearly all brain regions except the ventricular system. These hardware-induced variabilities have critical implications for multi-centre clinical trials and longitudinal studies, where consistent volumetric measurements are essential for tracking disease progression and treatment effects. The findings highlight that deep learning-based segmentation tools like SynthSeg+ can mitigate some challenges, particularly in comparing contrast-enhanced and non-contrast images, but fundamental hardware differences persist. Researchers should implement standardized protocols, consistent segmentation tools, and statistical corrections to account for these technical variabilities when designing neuroimaging studies, ensuring that observed changes reflect true biological effects rather than technical inconsistencies.
The accuracy of brain morphometric analysis in neuroimaging research is fundamentally dependent on two factors: the choice of image segmentation tool and the type of magnetic resonance imaging (MRI) data being processed. This relationship is particularly critical in studies comparing contrast-enhanced (CE-MR) and non-contrast MR (NC-MR) images, where technical heterogeneity has traditionally limited the research utility of clinically acquired CE-MR scans [6]. As large-scale datasets like the UK Biobank—containing over 40,000 brain MRIs—enable analysis at unprecedented scale, understanding how processing pipelines influence results becomes essential for robust and reproducible research [45]. This guide provides an objective comparison of leading segmentation tools, evaluates their performance across image types, and presents experimental data to inform method selection for brain volumetry studies.
Comparative Performance of Segmentation Tools
Quantitative Tool Performance Metrics
Table 1: Performance comparison of major segmentation tools and methodologies
| Tool/Methodology | Primary Function | Key Performance Metrics | Strengths | Limitations |
|---|---|---|---|---|
| SynthSeg+ [6] | Volumetric segmentation of brain structures | ICCs > 0.90 for most structures between CE-MR and NC-MR; Low CSF/ventricular volume reliability | Excellent reliability across scan types; Robust age prediction | Discrepancies in CSF and ventricular volumes |
| TotalSegmentator MRI [46] [47] | Sequence-agnostic segmentation of 80 anatomical structures | Dice score: 0.839 (80 structures); 0.966 on CT dataset | Open-source; Robust across sequences; Combined CT/MRI training improves performance | Small vessels and low-contrast organs remain challenging |
| FSL-VBM [45] | Voxel-Based Morphometry | Highest morphometricity, replicability, and predictive accuracy in UK Biobank study | Most consistent all-rounder in large-scale comparison | Sensitive to imaging confounders (head motion, brain position) |
| CAT12/SPM [6] [45] | Volume- and surface-based morphometry | Inconsistent performance between CE-MR and NC-MR; Lower morphometricity | - | Inconsistent performance across scan types |
| FreeSurfer [45] | Cortical and subcortical surface-based analysis | Generally high morphometricity estimates | Captures unique signals complementary to other methods | Lower replicability rates compared to volume-based methods |
| DDcGAN [48] | Image fusion for glioma classification | High fused image quality (SSIM, PSNR); ROC analysis shows high classification performance | High performance in glioma grading; Lower runtime vs. LRD | Requires significant computational resources |
Performance Across Image Types
Different segmentation tools demonstrate variable performance when processing CE-MR versus NC-MR images. Deep learning-based approaches like SynthSeg+ show particularly high reliability (Intraclass Correlation Coefficients > 0.90) for most brain structures between these scan types, though some discrepancies emerge in cerebrospinal fluid (CSF) and ventricular volumes [6]. This suggests that advanced AI methodologies can potentially broaden the application of clinically acquired CE-MR images in neuroimaging research.
The TotalSegmentator MRI tool introduces a different approach with its sequence-agnostic design, trained on both MRI and CT data. Surprisingly, incorporating CT data during training actually improved MRI segmentation performance, suggesting CT data can serve as a form of data augmentation to enhance model generalization [46]. This tool achieved a Dice score of 0.839 for 80 anatomical structures in internal testing, outperforming comparable models like MRSegmentator and AMOS [46] [47].
Volume-based methods like FSL-VBM generally outperform surface-based approaches in detecting significant clusters, achieving higher replication rates, and producing stronger predictive performance according to large-scale comparisons using 39,655 T1-weighted MRI scans from the UK Biobank [45]. However, each method captures partially unique signals, leading to inconsistencies in identified brain regions across methods.
Experimental Protocols and Methodologies
Key Experimental Designs
Table 2: Methodologies of key segmentation performance studies
| Study Focus | Dataset Characteristics | Experimental Design | Analysis Methods |
|---|---|---|---|
| CE-MR vs. NC-MR Reliability [6] | 59 normal participants (aged 21-73); T1-weighted CE-MR and NC-MR scans | Compared CAT12 and SynthSeg+ segmentation tools; Analyzed volumetric measurements and age prediction efficacy | Intraclass Correlation Coefficients (ICCs); Age prediction models |
| Large-Scale Pipeline Comparison [45] | 39,655 T1-weighted MRI scans from UK Biobank | Compared 5 gray-matter representations from FSL, CAT12/SPM, and FreeSurfer | Morphometricity analysis; Sensitivity to confounders; Association replication; Prediction accuracy |
| Tool Development & Validation [46] [47] | 616 MRI and 527 CT images for training; tested on 8,672 abdominal MRIs | Trained nnU-Net-based model on diverse dataset; Evaluated against external datasets (AMOS, CHAOS) | Dice scores; Clinical validation on age-related volume changes |
| Domain Shift Robustness [49] | 63,327 sequences from 2179 glioblastoma patients; tested on pediatric data | Trained ResNet-18 and MedViT models on adult data; tested on pediatric dataset with expert adjustments | Accuracy comparison; Domain shift mitigation analysis |
Workflow for Segmentation Performance Assessment
The following diagram illustrates the typical experimental workflow for comparing segmentation tool performance across different image types, as implemented in the cited studies:
Diagram 1: Segmentation performance assessment workflow
This standardized workflow enables direct comparison between tools and image types. Studies typically begin with image acquisition across multiple scanners and protocols to ensure diversity [45] [49]. Preprocessing steps include image normalization, resizing, and augmentation techniques such as rotation, translation, and flipping to increase data diversity and reduce overfitting [50]. The core segmentation phase applies different tools to the same dataset, followed by quantitative performance assessment using metrics like Dice scores, Intraclass Correlation Coefficients (ICCs), and morphometricity analysis [6] [46] [45].
Essential Research Reagent Solutions
Table 3: Essential research reagents and computational tools for segmentation studies
| Category | Specific Tools/Datasets | Research Application | Key Characteristics |
|---|---|---|---|
| Segmentation Software | SynthSeg+, TotalSegmentator MRI, FSL, CAT12/SPM, FreeSurfer | Brain morphometry, volumetric analysis | Varied performance across image types; Different methodological approaches |
| Validation Datasets | UK Biobank (n=39,655+), AI Hub synthetic data (n=10,000), Institutional cohorts | Tool benchmarking, performance validation | Large-scale, multi-scanner, multi-protocol data essential for robust evaluation |
| Performance Metrics | Dice scores, ICCs, Morphometricity, Sensitivity to Confounders | Quantitative performance assessment | Standardized metrics enable cross-study comparison |
| Computational Frameworks | nnU-Net, ResNet-18, MedViT, CNN-Transformer hybrids | Model development, segmentation execution | Self-configuring frameworks adapt to new datasets; hybrid models show robustness to domain shift |
| Clinical Validation Tools | Age prediction models, Disease classification algorithms, Outcome prediction | Clinical relevance assessment | Bridges technical performance to clinical utility |
Discussion and Research Implications
Practical Recommendations for Researchers
The evidence from comparative studies suggests several strategic approaches for researchers conducting brain volumetry studies:
First, consider implementing ensemble approaches that combine multiple segmentation pipelines. Large-scale comparisons reveal that different methods capture partially unique neurobiological signals, and combining these complementary signals may improve brain-based prediction accuracy [45]. For studies specifically involving both contrast-enhanced and non-contrast MRI, deep learning-based tools like SynthSeg+ demonstrate superior reliability across scan types, making them particularly suitable for leveraging clinically acquired CE-MR images in research contexts [6].
When working with diverse MRI protocols across multiple centers, sequence-agnostic tools like TotalSegmentator MRI offer significant advantages due to their robust performance across varying acquisition parameters [46] [47]. The unexpected benefit of training with both CT and MRI data suggests that multi-modal training strategies can enhance model generalization through a data augmentation effect.
Regardless of tool selection, careful treatment of imaging confounders is essential. All major pipelines demonstrate sensitivity to factors like head motion, brain position, and signal-to-noise ratio, which can significantly impact results if not properly addressed [45]. Furthermore, researchers should exercise caution when interpreting small clusters (single voxels or vertices), as these have been shown to be less reliable across methodological variations [45].
For studies anticipating domain shift challenges—such as applying models trained on adult data to pediatric populations—hybrid architectures like MedViT demonstrate superior performance compared to traditional CNN models, with additional improvements possible through expert domain knowledge adjustments [49].
Future Directions
The field continues to evolve with several promising developments. Open-source initiatives are driving rapid innovation, with new MRI segmentation tools emerging regularly and benchmarking against established solutions like TotalSegmentator MRI [46]. Future directions include expanding anatomical coverage to include finer structures such as peripheral vessels and small muscle groups, which would support broader adoption in clinical practice [46] [47]. Additionally, addressing the "black box" nature of deep learning models through explainable AI (XAI) techniques remains an important focus for enhancing clinical trust and adoption [50].
The long-term vision for the field is the seamless integration of automated segmentation into clinical workflows, becoming "as standard and invisible as spellcheck in word processors—something always running in the background, quietly improving precision medicine and patient care" [46]. As tools continue to improve in robustness, accuracy, and accessibility, this vision moves increasingly closer to reality.
Protocol Strategies for High-Acuity and Longitudinal Imaging Scenarios
In brain imaging research, particularly for clinical trials and longitudinal studies, the choice between contrast-enhanced (CE) and non-contrast (NC) magnetic resonance imaging (MRI) protocols presents significant methodological challenges. CE-MRI, while invaluable for assessing blood-brain barrier integrity in conditions like brain tumors and multiple sclerosis, introduces additional complexity, cost, and patient risk due to gadolinium-based contrast agent administration. NC-MRI offers a safer, faster, and more accessible alternative but has historically faced limitations in consistency and reliability for quantitative volumetry. This guide objectively compares the performance of CE versus NC-MRI for brain volumetry, examining segmentation tools, protocol adaptations, and artificial intelligence (AI) enhancements that enable reliable morphometric analysis across diverse clinical and research scenarios.
Comparative Performance Analysis of Segmentation Tools
Volumetric Agreement Between CE-MR and NC-MR
Deep learning-based segmentation tools demonstrate superior performance in extracting comparable volumetric measurements from both CE-MR and NC-MR images, enabling flexible protocol selection for different clinical scenarios.
Table 1: Performance Metrics of Segmentation Tools on CE-MR vs. NC-MR Images
| Segmentation Tool | Overall Reliability (ICCs) | Structures with Highest Agreement | Structures with Notable Discrepancies | Age Prediction Efficacy |
|---|---|---|---|---|
| SynthSeg+ | >0.90 for most structures [6] [7] | Larger brain structures (ICC > 0.94) [7] | CSF and ventricular volumes [6] [7] | Comparable between CE-MR and NC-MR [6] |
| CAT12 | Inconsistent performance [6] [7] | Limited information | Limited information | Limited information |
Methodological Protocols for Comparative Volumetry
The experimental protocol for directly comparing CE-MR and NC-MR volumetry involves specific acquisition parameters and processing workflows:
- Subject Cohort: 59 clinically normal participants (age range: 21-73 years; mean = 44.25; SD = 15.51; 24 females) without known neurological disorders [7]
- MRI Acquisition: Paired T1-weighted CE-MR and NC-MR scans acquired for each participant [6] [7]
- Segmentation Tools: CAT12 and SynthSeg+ applied to both image types [6]
- Analysis Metrics: Intraclass correlation coefficients (ICCs) for reliability assessment across brain structures; age prediction models evaluated for both scan types [6] [7]
- Exclusion Criteria: Segmentation failures (4 image pairs excluded due to CAT12 failure on CE-MR images) [7]
Comparative Volumetry Experimental Workflow: This diagram illustrates the protocol for comparing contrast-enhanced and non-contrast MRI segmentation reliability.
AI-Enhanced Protocol Strategies for Challenging Scenarios
Ultra-Low-Field MRI Enhancement for Accessible Imaging
AI super-resolution techniques enable reliable volumetry from portable, low-field MRI systems, expanding imaging capabilities to resource-limited and bedside scenarios.
Table 2: AI Enhancement of Ultra-Low-Field (64mT) MRI for Brain Volumetry
| Processing Method | Alignment with 3T MRI Reference | Key Advantages | Research Context |
|---|---|---|---|
| Raw 64mT MRI | Significant deviations in volumetric measurements [51] | Portability, cost-effectiveness, bedside capability [51] | 92 healthy participants (age 18-81) [51] |
| SynthSR | Reduced systematic differences [51] | CNN-based processing of T1w and T2w images [51] | Generates high-resolution synthetic MRI [51] |
| LoHiResGAN | Improved alignment with 3T reference [51] | GAN architecture with ResNet components [51] | Enhances ULF-MRI quality to high-field levels [51] |
Abbreviated NC-MRI Protocols for High-Throughput Scenarios
Non-contrast abbreviated MRI (NC-AMRI) protocols provide efficient alternatives for surveillance and high-throughput scenarios without compromising diagnostic capability:
- Protocol Composition: Diffusion-weighted imaging (DWI), T2-weighted imaging with fat saturation, and T1-weighted in-phase/opposed-phase imaging [52]
- Time Efficiency: Total acquisition time of approximately 12.5 minutes compared to 27 minutes for full liver MRI protocol [52]
- Performance Metrics: High AUC values (0.89-0.94) for hepatocellular carcinoma detection; sensitivity of 97.2% and specificity of 87.2% with double reading [52]
- Training Impact: Mutual training sessions for readers significantly improved inter-observer agreement and diagnostic performance [52]
Longitudinal Volumetry in Aging and Neurodegenerative Research
Normative Brain Volume Changes Across Adulthood
Comprehensive characterization of normative brain volume changes provides essential reference data for distinguishing normal aging from pathological processes in longitudinal studies.
Table 3: Regional Brain Volume Changes Across Adulthood in Cognitively Healthy Adults
| Brain Region | Volume Change (21-90 years) | Clinical Significance | Dataset Source |
|---|---|---|---|
| Lateral Ventricles | +115.9% expansion [53] | Neurodegenerative biomarker [53] | Korean, IXI, ADNI datasets (n=1833) [53] |
| White Matter Hypointensities | +122.6% expansion [53] | Small vessel disease indicator [53] | Multicohort integration [53] |
| Inferior Parietal | -20.4% shrinkage [53] | Association cortex vulnerability [53] | Ages 21-90 across 7 age bins [53] |
| Transverse Temporal | -21.6% shrinkage [53] | Primary auditory cortex change [53] | High-resolution 3T MRI [53] |
| Insula | -3.7% shrinkage [53] | Minimal change region [53] | Neural network-based segmentation [53] |
Methodological Protocol for Normative Brain Aging Studies
The establishment of normative brain volume trajectories requires rigorous methodological approaches:
- Cohort Integration: 1833 subjects from three distinct datasets (Korean, IXI, ADNI) spanning ages 21-90 years [53]
- Segmentation Pipeline: MTech Lab BrainMAP pipeline combining advanced preprocessing with neural network-based segmentation (FastSurfer) of 95 brain structures [53]
- Validation Method: Intraclass correlation coefficients (ICC) and coefficients of variation (CoV) against FreeSurfer gold standard (mean ICC: 0.9965) [53]
- Statistical Correction: Regression-based correction for sex and cohort effects; percentage change calculation across seven age bins [53]
Normative Brain Aging Study Protocol: This workflow details the methodology for establishing normative brain volume trajectories across adulthood.
The Scientist's Toolkit: Essential Research Reagent Solutions
Table 4: Essential Tools for Advanced Brain Volumetry Research
| Tool/Category | Specific Examples | Research Function | Application Context |
|---|---|---|---|
| Segmentation Software | SynthSeg+, CAT12, FastSurfer [6] [53] [7] | Automated brain structure segmentation and volumetry [6] [53] | CE-MR/NC-MR comparison, longitudinal studies [6] [7] |
| AI Enhancement Tools | SynthSR, LoHiResGAN [51] | Image quality enhancement and super-resolution [51] | ULF-MRI enhancement, cross-field strength harmonization [51] |
| Validation Metrics | Intraclass Correlation Coefficients (ICCs), Dice scores [6] [53] [54] | Reliability and agreement quantification [6] [53] | Method validation, tool performance assessment [6] [54] |
| Multi-Scanner Datasets | Korean, IXI, ADNI datasets [53] | Normative reference establishment [53] | Aging studies, neurodegenerative disease research [53] |
| Abbreviated Protocols | NC-AMRI (DWI, T2w, T1w in/opposed-phase) [52] | High-throughput screening [52] | Surveillance imaging, resource-limited settings [52] |
The evolving landscape of brain MRI volumetry demonstrates that non-contrast protocols, when enhanced with advanced AI segmentation tools like SynthSeg+, can achieve reliability comparable to contrast-enhanced methods for most brain structures. This enables greater flexibility in protocol selection based on specific clinical scenarios, patient safety considerations, and accessibility requirements. For high-acuity settings, CE-MRI remains valuable for specific clinical questions involving blood-brain barrier assessment, while NC-MRI protocols offer practical advantages for longitudinal tracking, screening, and resource-limited scenarios. Ultra-low-field MRI with AI enhancement further expands access to quantitative brain volumetry, potentially democratizing advanced neuroimaging capabilities across diverse healthcare settings. The integration of standardized normative references with these advanced volumetric techniques supports more precise differentiation of pathological processes from normal aging, offering powerful tools for clinical trials and therapeutic development in neurodegenerative diseases.
Reproducibility forms the fundamental distinction between science and pseudoscience, a principle recognized for centuries yet facing significant challenges in modern neuroimaging research [55]. The field of MRI brain volumetry, particularly when comparing contrast-enhanced (CE-MR) and non-contrast (NC-MR) approaches, encounters substantial reproducibility hurdles due to technical heterogeneity across scanners, protocols, and analytical methods [6] [55]. Over the past two decades, concerns have grown regarding the reproducibility of scientific studies, driven by variability in data collection and analysis, small sample sizes, incomplete method reporting, and insufficient standardization [55]. In brain volumetry, these challenges are exacerbated when attempting to utilize clinically acquired CE-MR images for research purposes, as traditional segmentation tools like CAT12 demonstrate inconsistent performance across different image types [6]. This guide objectively compares methodological approaches for ensuring reproducible results in contrast-enhanced versus non-contrast MRI brain volumetry, providing researchers with standardized frameworks for generating reliable, comparable volumetric data essential for both neuroscience research and drug development pipelines.
Comparative Performance of Volumetric Measurement Approaches
Segmentation Tool Performance Across MRI Types
Table 1: Performance comparison of segmentation tools for CE-MR and NC-MR brain volumetry
| Segmentation Tool | Technical Approach | Performance on CE-MR (vs NC-MR) | Key Strengths | Key Limitations |
|---|---|---|---|---|
| SynthSeg+ | Deep learning-based segmentation | High reliability (ICCs > 0.90 for most structures) [6] | Effectively handles technical heterogeneity in clinical scans; enables age prediction models comparable between CE-MR and NC-MR [6] | Discrepancies in CSF and ventricular volumes [6] |
| CAT12 | Conventional segmentation | Inconsistent performance between CE-MR and NC-MR [6] | Established method for research-quality images | Not optimized for contrast-enhanced clinical scans [6] |
| 3D U-Net Models | Deep learning image translation | Converts T1ce to synthetic T1nce with high similarity scores [8] | Enables harmonization of heterogeneous clinical datasets; allows feature extraction from standardized images [8] | Dependent on training data quality and variety |
Quantitative Performance Metrics in Brain Volumetry
Table 2: Quantitative comparison of volumetric measurement reliability
| Performance Metric | SynthSeg+ on CE-MR | SynthSeg+ on NC-MR | CAT12 on CE-MR | CAT12 on NC-MR | 3D U-NET T1ce to T1nce |
|---|---|---|---|---|---|
| ICC for Most Brain Structures | >0.90 [6] | >0.90 [6] | Inconsistent [6] | Inconsistent [6] | N/A |
| CSF/Ventricular Volume Accuracy | Discrepancies observed [6] | Reference standard [6] | Not reported | Not reported | Improved tissue volume agreement [8] |
| Age Prediction Efficacy | Comparable to NC-MR [6] | Reference standard [6] | Not reported | Not reported | N/A |
| Structural Similarity Index (SSIM) | N/A | N/A | N/A | N/A | Higher than between real T1nce and T1ce [8] |
Experimental Protocols for Reproducible Volumetry
Direct Comparative Analysis Protocol
The 2025 comparative study by Aman et al. established a robust protocol for evaluating the reliability of morphometric measurements from CE-MR scans compared to NC-MR scans [6]. This methodology provides a framework for validating segmentation tools across different image types:
Participant Cohort: 59 normal participants aged 21-73 years, providing age diversity representative of clinical populations [6].
Image Acquisition: Both T1-weighted CE-MR and NC-MR scans acquired for each participant, ensuring paired data for direct comparison [6].
Segmentation Implementation: Parallel processing of both scan types using CAT12 and SynthSeg+ tools with identical parameter configurations [6].
Analysis Framework:
- Volumetric measurements across multiple brain structures
- Intraclass correlation coefficients (ICCs) to assess reliability between CE-MR and NC-MR measurements
- Age prediction models developed separately for each scan type to evaluate clinical application consistency [6]
This experimental design enables direct quantification of measurement agreement between contrast-enhanced and non-contrast scans, providing evidence-based recommendations for tool selection.
Image Translation Protocol for Data Harmonization
Bottani et al. (2024) developed an alternative approach for handling heterogeneous clinical datasets containing both CE-MR and NC-MR images through image translation [8]:
Dataset Characteristics: 307 pairs of 3D T1ce and T1nce images from 39 hospitals in the Greater Paris area, representing real-world clinical heterogeneity [8].
Model Architecture: 3D U-Net and conditional GAN models trained to convert T1ce into synthetic T1nce images [8].
Quality Control Framework: Implementation of a three-level quality grading system (contrast, motion, noise) with grades 0 (good), 1 (medium), and 2 (bad) to ensure model robustness across image qualities [8].
Validation Approach:
- Standard image similarity metrics (SSIM, PSNR, NRMSE) between real and synthetic T1nce images
- Segmentation consistency evaluation using SPM tissue volume extraction on real T1nce, real T1ce, and synthetic T1nce images [8]
This protocol enables the harmonization of heterogeneous clinical datasets, allowing reliable feature extraction from contrast-enhanced images by converting them to a standardized non-contrast format.
Visualization of Experimental Workflows
Comparative Volumetry Analysis Workflow
Diagram 1: Comparative volumetry analysis workflow for CE-MR vs. NC-MR reliability assessment
Image Translation Harmonization Workflow
Diagram 2: Image translation workflow for harmonizing heterogeneous clinical datasets
The Researcher's Toolkit: Essential Solutions for Reproducible Volumetry
Table 3: Essential research reagents and computational tools for reproducible MRI volumetry
| Tool/Solution | Type | Primary Function | Application Context |
|---|---|---|---|
| SynthSeg+ | Deep Learning Segmentation | Robust brain structure segmentation across heterogeneous image types | Primary volumetry for both CE-MR and NC-MR images; particularly effective for clinical scans [6] |
| 3D U-Net/cGAN Models | Image Translation Network | Converts T1ce to synthetic T1nce images | Data harmonization for heterogeneous clinical datasets; enables use of CE-MR images with tools validated on NC-MR [8] |
| Neurodesk | Reproducible Research Platform | Containerized environments with versioned, DOI-assigned components | Ensces computational reproducibility across systems and time; facilitates peer review of analytical code [56] |
| CAT12 | Conventional Segmentation Tool | Brain volumetry and morphometry | Research-quality NC-MR images; limited reliability for CE-MR scans [6] |
| Quality Control Framework | Assessment Protocol | Three-level grading of image quality (contrast, motion, noise) | Standardized quality assessment for clinical data warehouses; enables filtering and quality-aware analysis [8] |
| Pulseq-CEST Library | Standardization Toolbox | Vendor-neutral acquisition, simulation, and evaluation | Protocol harmonization across scanners and sites; reduces technical variability in multi-center studies [57] |
Ensuring reproducibility in contrast-enhanced versus non-contrast MRI brain volumetry requires strategic methodological selection based on specific research contexts. Deep learning-based approaches like SynthSeg+ demonstrate superior reliability for direct analysis of both CE-MR and NC-MR images, while image translation methods provide an effective strategy for harmonizing heterogeneous clinical datasets [6] [8]. The evolving landscape of reproducible neuroimaging research emphasizes containerized computational environments, standardized protocols across vendors, and robust quality control frameworks that collectively address the multifaceted challenges of reproducibility [55] [57] [56]. By implementing these best practices and selecting appropriate analytical frameworks, researchers can generate reliable, comparable volumetric data that advances both neuroscience understanding and drug development pipelines while maintaining the scientific rigor essential for meaningful research outcomes.
Validating AI Tools and Comparative Performance Metrics
In the field of neuroimaging research, the accurate measurement of brain volume is paramount for studying neurological and neurodegenerative diseases. The central challenge lies in validating these in vivo measurements against a ground truth, a process complicated by the widespread use of heterogeneous magnetic resonance imaging (MRI) protocols. A significant source of this heterogeneity is the use of gadolinium-based contrast agents (GBCAs). While contrast-enhanced (CE) T1-weighted MRI is a clinical staple for visualizing lesions in conditions like brain tumors, the neuroimaging software tools for volumetric analysis have primarily been validated on non-contrast (NC) T1-weighted images [58] [8]. This creates a critical need for rigorous benchmarking to determine whether CE-MRI can be reliably used for volumetry, or if it requires conversion to a synthetic NC equivalent. This guide objectively compares the performance of various MRI types and segmentation tools against ex vivo and clinical ground truths, providing researchers and drug development professionals with validated protocols and data-driven recommendations.
Validation Methodologies: From Ex Vivo to Clinical Data
Benchmarking brain volumetry requires multiple validation approaches, each with its own strengths and serving as a gold standard for different aspects of the measurement process.
The Ultimate Ground Truth: Ex Vivo Water Displacement
The most direct validation involves comparing MRI-based volumes to a physical ground truth. A seminal ex vivo study achieved this by scanning fixed anatomical heads with various MRI sequences, then extracting the brains to measure their volume using the water displacement method (WDM) [59]. This approach serves as an absolute benchmark for total brain volume.
Clinical Ground Truth: Non-Contrast MRI as a Reference
In clinical research, where ex vivo validation is impossible, non-contrast T1-weighted MRI is often treated as the reference standard because major neuroimaging software packages (e.g., SPM, FSL, ANTs) have been optimized and validated for this modality [8]. Studies then evaluate the reliability of CE-MRI volumetry by comparing it directly to NC-MRI measurements [6].
Synthetic Ground Truth: Image Translation with Deep Learning
To overcome dataset heterogeneity in clinical data warehouses, deep learning models can harmonize data by converting CE-MRI into synthetic NC-MRI. The synthetic images are then benchmarked against real NC-MRI to validate their suitability for feature extraction [58] [8]. This approach allows for the use of large, clinically heterogeneous datasets.
Quantitative Performance Comparison
The following tables consolidate quantitative data from key validation studies, providing a clear comparison of different volumetry methods and segmentation tools.
Table 1: Comparison of Brain Volumetry Methods Against Ex Vivo Water Displacement (WDM)
| Volumetry Method | Mean Volume (cm³) ± SD | Statistical Difference from WDM (p < 0.001) | Key Finding |
|---|---|---|---|
| Gold Standard: WDM [59] | 1111.14 ± 121.78 | (Baseline) | (Baseline) |
| Manual T2-weighted [59] | 1020.29 ± 70.01 | Significant | Underestimation |
| Automatic T2-weighted [59] | 1056.29 ± 90.54 | Significant | Underestimation |
| Automatic T1-weighted [59] | 1094.69 ± 100.51 | Not Significant | Most Accurate MRI Method |
| Automatic MP2RAGE (TI1) [59] | 1066.56 ± 96.52 | Significant | Underestimation |
Table 2: Reliability of Contrast-Enhanced (CE) MRI Volumetry vs. Non-Contrast (NC) MRI
| Segmentation Tool / Condition | Intraclass Correlation Coefficient (ICC) | Key Structures with Discrepancies | Conclusion |
|---|---|---|---|
| SynthSeg+ (CE vs. NC) [6] | > 0.90 for most structures | Cerebrospinal Fluid (CSF), Ventricular Volumes | High Reliability for CE-MRI |
| CAT12 (CE vs. NC) [6] | Inconsistent Performance | N/A | Not Recommended for CE-MRI |
| 3D U-Net/cGAN (Synthetic NC vs. Real NC) [58] [8] | High similarity; tissue volumes closer to real NC than CE | N/A | Synthetic NC enables reliable feature extraction from CE-MRI |
Table 3: Performance of Deep Learning Models for Tumor Classification
| Model / Framework | Reported Test Accuracy | Key Features | Application Context |
|---|---|---|---|
| BrainFusion (VGG16) [60] | 99.86% | Integration with YOLOv8 for bounding box localization | Brain Tumor MRI Dataset |
| Hybrid TM-SAU-CNN [60] | 99.30% | Cross-fusion of local/global features | Brain Tumor MRI Dataset |
| Federated Learning (VGG16) [60] | 98% | Privacy-preserving multi-institutional training | Brain Tumor MRI Dataset |
Experimental Protocols for Key Validation Studies
Protocol 1: Ex Vivo Volumetry Validation
- Objective: To validate in vivo MRI brain volume measurements against the gold-standard water displacement method [59].
- Specimens: Seven anatomical heads fixed with an alcohol-formaldehyde solution.
- MRI Acquisition: 3T MRI scans using T2-weighted, T1-weighted, and MP2RAGE sequences.
- Segmentation Methods:
- Manual intensity-based threshold segmentation using Display (MINC-ToolKit).
- Automatic segmentation using the deep learning tool SynthSeg.
- Ground Truth Measurement: After scanning, brains were extracted, and their volume was measured with the water displacement method following the removal of meninges and a midsagittal cut.
- Statistical Analysis: Volumes from all MRI methods were compared to WDM volumes using a repeated-measures analysis of variance (ANOVA).
Protocol 2: Clinical CE-MRI to NC-MRI Translation
- Objective: To convert contrast-enhanced T1-weighted (T1ce) MRI into synthetic non-contrast-enhanced (T1nce) MRI to exploit heterogeneous clinical data warehouses [58] [8].
- Data: 307 pairs of T1ce and T1nce images from a clinical data warehouse (39 hospitals in Greater Paris).
- Models: 3D U-Net and conditional Generative Adversarial Network (cGAN) models were trained on 230 image pairs and tested on 77 pairs.
- Validation Metrics:
- Image Similarity: Standard metrics (e.g., SSIM, PSNR) between synthetic and real T1nce.
- Segmentation Task: Volumes of gray matter, white matter, and cerebrospinal fluid extracted from real T1nce, real T1ce, and synthetic T1nce images using SPM software were compared.
Protocol 3: Benchmarking Segmentation Tools on CE-MRI
- Objective: To evaluate the reliability of morphometric measurements from CE-MR scans compared to NC-MR scans in normal individuals [6].
- Participants: 59 normal participants (aged 21-73 years).
- MRI Acquisition: Paired T1-weighted CE-MR and NC-MR scans.
- Segmentation Tools: CAT12 and SynthSeg+.
- Analysis: Comparison of volumetric measurements and age prediction efficacy between CE-MR and NC-MR scans.
Workflow and Pathway Visualizations
The Scientist's Toolkit: Key Research Reagents and Solutions
Table 4: Essential Tools for MRI Volumetry Validation Research
| Tool / Solution | Type | Primary Function in Validation | Key Reference / Note |
|---|---|---|---|
| SynthSeg | Deep Learning Software | Automatic brain segmentation; validated for ex vivo T1-weighted and clinical CE-MRI. | [6] [59] |
| 3D U-Net / cGAN | Deep Learning Architecture | Translates contrast-enhanced (T1ce) MRI to synthetic non-contrast (T1nce) MRI. | [58] [8] |
| SPM, FSL, ANTs | Neuroimaging Software Suite | Standard tools for feature extraction (e.g., tissue segmentation); typically validated on NC-MRI. | [8] |
| Water Displacement Method | Physical Measurement | Provides the gold-standard ex vivo brain volume for validating MRI measurements. | [59] |
| Brain Tumor MRI Dataset | Public Dataset | Used for benchmarking deep learning models for tumor classification and localization. | Combined Figshare, SARTAJ, Br35H [60] |
Within the domain of neuroimaging, quantitative brain volumetry has become an indispensable tool for diagnosing and monitoring neurological disorders. The broader research context comparing contrast-enhanced and non-contrast magnetic resonance imaging (MRI) protocols provides a critical foundation for evaluating computational volumetry techniques. This guide objectively compares the diagnostic performance of emerging artificial intelligence (AI) methods against established non-AI volumetry techniques, providing researchers and drug development professionals with experimental data and methodologies relevant to this evolving field.
Performance Comparison: Quantitative Data
The following tables summarize key performance metrics from recent comparative studies, highlighting the trade-offs between speed, segmentation accuracy, and diagnostic utility.
Table 1: Comparative Segmentation Performance and Speed
| Method | Type | Reported Dice Score | Processing Time per Patient | Reference / Pathology |
|---|---|---|---|---|
| FreeSurfer | Non-AI (Atlas-based) | Ground Truth | ~4.5 hours (15,735 ± 1.07 s) [61] [62] | Parkinsonian Syndromes [61] |
| V-Net (CNN) | AI (Deep Learning) | >0.85 [61] [62] | 51.26 ± 2.50 s (CPU) [61] | Parkinsonian Syndromes [61] |
| UNETR (ViT) | AI (Deep Learning) | >0.85 [61] [62] | 1101.82 ± 22.31 s (CPU) [61] | Parkinsonian Syndromes [61] |
| NeuroQuant | AI (Commercial) | Good-to-excellent agreement with FreeSurfer [63] | ~10 minutes [63] | Alzheimer's, TBI, Epilepsy [63] |
| nnU-Net | AI (Deep Learning) | 0.758 (Average DSC for BM) [64] | Not Specified | Brain Metastases [64] |
| AI-enhanced ULF MRI | AI (SynthSR/LoHiResGAN) | Brought volumes closer to 3T reference [51] | Not Specified | Healthy Adults [51] |
Table 2: Diagnostic Accuracy in Disease Classification
| Method | Pathology Classification Task | Reported AUC | Key Findings |
|---|---|---|---|
| FreeSurfer | Normal vs. P-plus [61] | >0.8 [61] | Gold standard for volumetry but time-consuming. |
| V-Net (CNN) | Normal vs. P-plus [61] | >0.8 [61] | Performance non-inferior to FreeSurfer, 300x faster. |
| UNETR (ViT) | Normal vs. P-plus [61] | >0.8 [61] | Performance non-inferior to FreeSurfer, 14x faster. |
| NeuroQuant | Mesial Temporal Sclerosis [63] | ~80% Accuracy [63] | Matched subspecialist accuracy in a fraction of the time. |
| NeuroQuant | Chronic Traumatic Brain Injury [63] | >90% Sensitivity [63] | Identified atrophy in >90% cases vs. 12% for visual assessment. |
Experimental Protocols and Methodologies
Protocol 1: AI vs. Non-AI in Parkinsonian Syndromes
A landmark study directly compared AI and non-AI methods for segmenting brain structures crucial for diagnosing Parkinson's disease (PD) and Parkinson-plus syndromes (P-plus) [61] [62].
- Dataset: The study utilized brain MRI scans from 411 subjects, including healthy controls (n=105), PD patients (n=105), multiple system atrophy (n=132), and progressive supranuclear palsy (n=69) [61].
- Methods: The gold-standard non-AI method, FreeSurfer, was used to segment six brain structures: midbrain, pons, caudate, putamen, pallidum, and third ventricle. These segmentations served as the annotated ground truth for training and validating two deep learning models: a CNN-based V-Net and a Vision Transformer-based UNETR [61].
- Validation: Performance was evaluated using Dice scores for segmentation overlap and the area under the curve (AUC) for differentiating between normal, PD, and P-plus cases based on the extracted volumes [61] [62].
Protocol 2: Clinical Validation of Automated Volumetry
Studies have validated the clinical performance of AI-based tools like NeuroQuant against expert radiologists and clinical outcomes [63].
- Application in Epilepsy: NeuroQuant was evaluated for its accuracy in lateralizing mesial temporal sclerosis in epilepsy patients, comparing its performance to that of subspecialist neuroradiologists [63].
- Application in Traumatic Brain Injury (TBI): In chronic TBI patients, the sensitivity of NeuroQuant in detecting atrophy or asymmetry was compared against the interpretation of radiologists using standard visual assessment methods [63].
- Correlation with Cognitive Decline: Studies correlated NeuroQuant's volumetric measurements of structures like the hippocampus with neuropsychological test performance in patients with mild cognitive impairment and Alzheimer's disease [63].
Protocol 3: Enhancing Ultra-Low-Field MRI with AI
Research has explored using AI to bridge the quality gap between low-field and high-field MRI, making volumetry more accessible [51].
- Data Acquisition: A study of 92 healthy adults scanned on both 64mT ultra-low-field (ULF) and 3T MRI systems [51].
- AI Processing: The ULF MRI data (T1-weighted and T2-weighted) were processed through two deep learning models, SynthSR (a convolutional neural network) and LoHiResGAN (a generative adversarial network), to generate higher-quality, synthetic images [51].
- Outcome Analysis: Volumetric measurements of 19 brain regions from the AI-enhanced ULF images were statistically compared to those from the 3T reference standard to assess the reduction in systematic bias [51].
Workflow and Logical Diagrams
The following diagrams illustrate the logical relationships and experimental workflows described in the cited research.
Comparative Analysis Workflow
AI Enhancement for Low-Field MRI
The Scientist's Toolkit: Key Research Reagents and Solutions
Table 3: Essential Materials and Software for MRI Volumetry Research
| Item | Type | Primary Function in Research |
|---|---|---|
| FreeSurfer | Software Package | Open-source, atlas-based tool for automated cortical and subcortical segmentation; considered a gold-standard non-AI method against which new techniques are validated [61]. |
| NeuroQuant | FDA-cleared Software | Commercial, AI-based solution for automated brain volumetry; provides clinically practical reports and age-/sex-matched normative comparisons for clinical correlation [63]. |
| CNN-based Models (e.g., V-Net, U-Net) | Deep Learning Architecture | Uses convolutional layers to extract spatial features from MRI data; excels in segmentation tasks and is significantly faster than non-AI methods [61] [64] [65]. |
| Vision Transformer (ViT) Models (e.g., UNETR) | Deep Learning Architecture | Applies self-attention mechanisms to capture global contextual information in images; often shows high Dice scores but can be computationally heavier than CNNs [61]. |
| nnU-Net | Deep Learning Framework | Self-configuring framework for medical image segmentation; known for robustness and high performance in challenges like brain metastasis segmentation [64]. |
| Generative Adversarial Networks (e.g., LoHiResGAN) | Deep Learning Architecture | Enhances image quality by translating low-field MRI to appear as if acquired from a high-field scanner, improving volumetric consistency [51]. |
| Dice Score / Dice Coefficient | Validation Metric | Quantifies the spatial overlap between an AI-generated segmentation and a ground truth mask (e.g., from FreeSurfer or manual tracing) [61] [65]. |
In the field of neuroimaging, particularly for brain volumetry, the segmentation of anatomical structures from magnetic resonance imaging (MRI) scans is a foundational task. The central challenge lies in balancing the competing demands of segmentation speed—how quickly results can be generated—and segmentation accuracy—how well the results reflect the underlying biological reality. This trade-off is critically examined within the specific research context of contrast-enhanced (CE-MR) versus non-contrast (NC-MR) MRI for brain morphometry. While CE-MR scans are abundant in clinical settings, their use in research has been limited due to concerns that contrast agents might alter the appearance of tissues and thus compromise the reliability of automated measurements [6] [7]. Recent advances in deep learning (DL) are transforming this landscape. Newer DL-based segmentation tools demonstrate a superior ability to generalize across different image contrasts, potentially enabling the large-scale use of clinical CE-MR scans for research without sacrificing accuracy [6]. This guide objectively compares the performance of popular segmentation algorithms, quantifying their speed-accuracy trade-offs to help researchers and drug development professionals select the optimal tool for brain volumetry studies.
Performance Comparison of Segmentation Tools
Key Performance Metrics for Segmentation
To objectively compare segmentation tools, researchers rely on several quantitative metrics:
- Dice Similarity Coefficient (Dice): A statistical measure of spatial overlap between the automated segmentation and a ground truth mask. Values range from 0 (no overlap) to 1 (perfect overlap).
- Intraclass Correlation Coefficient (ICC): A measure of reliability or agreement between measurements, often used to assess consistency between segmentations from different scan types (e.g., CE-MR vs. NC-MR). ICC values above 0.90 are generally considered indicative of high reliability [6] [7].
- Inference Time: The time required for a model to process a single image or dataset, directly impacting workflow efficiency.
- Architecture Type: The underlying neural network design (e.g., UNet, Region-Based CNN) which influences both performance and computational demands.
Comparative Performance Data
Table 1: Performance of Segmentation Tools on Brain Volumetry
| Segmentation Tool | Architecture Type | Key Performance on Brain MRI | Notable Strengths | Noted Limitations |
|---|---|---|---|---|
| SynthSeg+ [6] [7] | Deep Learning (UNet-based) | High reliability (ICCs > 0.90) for most structures between CE-MR and NC-MR scans. | Robust to contrast differences; suitable for heterogeneous clinical datasets; enables reliable age prediction from CE-MR. | Discrepancies in CSF and ventricular volumes. |
| CAT12 [6] [7] | Not Specified | High reliability but with relatively higher discrepancies between CE-MR and NC-MR vs. SynthSeg+. | Effective for standard NC-MR volumetry. | Inconsistent performance; segmentation failures on some CE-MR images. |
| Mask R-CNN [66] | Region-Based CNN (RCNN) | High accuracy in instance segmentation benchmarks. | Excellent for object detection and classification within images. | Complex pipeline; can be computationally intensive. |
Table 2: Performance of Deep Learning Models in Medical Image Analysis Tasks
| Model / Pipeline | Task Context | Reported Accuracy/Dice | Reported Speed/Inference Time |
|---|---|---|---|
| InceptionV3 (Block 7) [67] | Rib Fracture Classification from CT | Accuracy: 96.00%, Recall: 94.0% (3-class) | 13.6 ms (CPU), 12.2 ms (GPU) per crop |
| DL Model for CSVD [68] | Segmentation of White Matter Hyperintensities | Dice: 0.85 | Not Specified |
| ResNet50 (Block 12) [67] | Rib Fracture Classification from CT | High accuracy, slightly lower AUC than InceptionV3 Block 7 | ~3.1 ms faster per crop than InceptionV3 Block 7 |
| UNet-based Pipelines [66] | 3D Cellular Instance Segmentation | High performance, especially end-to-end 3D models for boundary detection. | Varies; some models show significant computational demands. |
The data reveals that architecture choices directly impact the speed-accuracy profile. For instance, a modified InceptionV3 model achieved an excellent trade-off, providing high accuracy for rib fracture classification while being 1.7x faster than a baseline model [67]. In brain volumetry, SynthSeg+ clearly outperforms CAT12 in handling CE-MR images, showing high reliability (ICCs > 0.90) for most brain structures and making it a robust tool for leveraging clinical datasets [6] [7]. Benchmarking studies of DL pipelines for 3D segmentation further confirm that performance varies significantly with model architecture and pipeline components [66].
Detailed Experimental Protocols
Protocol 1: Comparative Brain Volumetry on CE-MR vs. NC-MR
Objective: To evaluate the reliability of morphometric measurements from contrast-enhanced (CE-MR) T1-weighted scans compared to non-contrast (NC-MR) scans in healthy individuals [6] [7].
Methodology:
- Dataset: 59 paired MRI scans from clinically normal participants (age 21-73). All subjects underwent both NC-MR and CE-MR T1-weighted imaging on the same scanner [7].
- Segmentation Tools: The paired scans were processed using two segmentation tools: the deep learning-based SynthSeg+ and the conventional CAT12.
- Analysis: Volumetric measurements for multiple brain structures were extracted from both scan types using both tools. The agreement between measurements from CE-MR and NC-MR was quantified using the Intraclass Correlation Coefficient (ICC). Additionally, the efficacy of both scan types for building brain age prediction models was evaluated [6] [7].
Protocol 2: Benchmarking DL Pipelines for 3D Instance Segmentation
Objective: To perform a detailed, quantitative comparison of representative deep learning pipelines for instance segmentation from 3D confocal microscopy image datasets [66]. The principles are directly applicable to 3D medical image segmentation.
Methodology:
- Selected Pipelines: Four DL pipelines based on UNet or RCNN architectures were implemented based on criteria including open-source availability and trainability. A highly efficient non-DL method, MARS, was included for comparison [66].
- Training & Evaluation: All DL methods were trained on a common dataset of 3D cellular confocal microscopy images. Their segmentation accuracy was tested on data containing different image artifacts.
- Quality Evaluation: A specific evaluation method isolated segmentation errors due to under- or oversegmentation. This was complemented by 3D visualization for interactive quality exploration [66].
Workflow and Logical Diagrams
Diagram 1: Segmentation Workflow & Model Choice.
Diagram 2: Comparative Analysis Logic Flow.
The Scientist's Toolkit: Essential Research Reagents & Materials
Table 3: Key Reagents and Solutions for Segmentation Research
| Item Name | Function / Application | Specific Example / Note |
|---|---|---|
| Gadolinium-Based Contrast Agent (GBCA) | Injected to improve visualization of blood vessels and tissues in MRI. Essential for creating ground truth CE-MR scans. | Safety and invasiveness concerns are a motivation for developing DL alternatives [39]. |
| T1-weighted MRI Scan | Standard high-resolution structural MRI sequence. The primary input for most brain morphometry tools. | Can be acquired with (CE-MR) or without (NC-MR) contrast [6] [7]. |
| Segmentation Ground Truth | Manually annotated images used to train and validate DL models. | Requires expert input; time-consuming to produce [66] [69]. |
| Deep Learning Framework | Software library for building and training neural networks (e.g., TensorFlow, PyTorch). | Enables development of tools like SynthSeg+ [6]. |
| Benchmark Dataset | A common, often public, dataset used to compare the performance of different algorithms. | Crucial for fair and objective comparison of segmentation pipelines [66]. |
The comparative utility of contrast-enhanced versus non-contrast magnetic resonance imaging (MRI) represents a critical frontier in brain volumetry research, particularly for classifying parkinsonian syndromes and monitoring disease progression. While contrast agents are unequivocally essential for detecting blood-brain barrier (BBB) disruption in conditions like brain tumors or active inflammation, their necessity in quantifying neurodegenerative atrophy patterns remains a subject of intensive investigation. Non-contrast T1-weighted images have long served as the reference standard for computational morphometry in disorders like Parkinson's disease (PD) and Alzheimer's disease, as conventional neuroimaging software tools were predominantly validated on non-enhanced sequences [70]. However, emerging research challenges this paradigm by demonstrating that deep learning approaches can successfully harmonize contrast-enhanced datasets into synthetic non-contrast images, thereby expanding the utility of heterogeneous clinical data warehouses [70]. This comparison guide objectively evaluates the performance characteristics of both approaches within the specific context of parkinsonian syndrome differentiation and atrophy monitoring, providing researchers and drug development professionals with evidence-based recommendations for protocol selection.
Table 1: Performance Metrics for Parkinsonian Syndrome Classification Using Non-Contrast MRI
| Study & Methodology | Classification Task | Performance Metrics | Key Regional Biomarkers |
|---|---|---|---|
| Swin UNETR (Self-supervised) [71] | PD vs. Parkinson-plus syndrome (PPS) | F1 score: 0.83, AUC: 0.89 | Sensorimotor areas, cerebellum, brain stem, basal ganglia |
| 3D CNN (Gray Matter Density) [72] | PD vs. MSA (all variants) | Accuracy: 0.88 ± 0.03 | Putamen, cerebellum |
| 3D CNN (Mean Diffusivity) [72] | PD vs. MSA-C&PC (cerebellar/mixed) | Accuracy: 0.84 ± 0.08 | Cerebellar regions, brainstem |
| 3D CNN (Gray Matter Density) [72] | PD vs. MSA-P (parkinsonian variant) | Accuracy: 0.78 ± 0.09 | Putamen, basal ganglia |
Table 2: Atrophy Monitoring Method Performance in Neurodegenerative Research
| Methodology | Application Context | Advantages | Limitations |
|---|---|---|---|
| Automated Volumetry (FreeSurfer) [73] | RRMS atrophy tracking | Quantitative, sensitive to annual change | Requires high-resolution T1 (typically non-contrast) |
| Visual Rating Scales (VRS) [74] | Dementia assessment | Fast, clinically adopted | Subjective, underestimates atrophy vs. software |
| Low-Field MRI with ML [75] | AD hippocampal volumetry | Accessible, hippocampal correlation r=0.89 with HF-MRI | Lower SNR, requires specialized pipelines |
| DCE-MRI for BBB Permeability [76] | MCI / early neurodegeneration | Detects subtle BBB leakage pre-atrophy | Requires contrast, specialized sequences |
Experimental Protocols and Methodologies
Self-Supervised Learning for Parkinsonism Classification
The Swin UNETR (Shift Window UNET TRansformer) framework represents a breakthrough in self-supervised learning for parkinsonism classification [71]. The methodology involved pretraining on 75,861 clinical head MRI scans (T1-weighted, T2-weighted, FLAIR) using a cross-contrast context recovery task without labeled data. This foundation model was subsequently fine-tuned for supervised classification using a dataset of 1,992 PD and 1,989 PPS participants. The model's performance was evaluated against comparative architectures including a self-supervised vanilla Vision Transformer (ViT) autoencoder and convolutional neural networks (DenseNet121, ResNet50) trained from scratch. Model interpretation employed occlusion sensitivity mapping, which identified critical discriminatory regions including sensorimotor pathways, cerebellum, brainstem, ventricular system, and basal ganglia structures in correctly-classified cases (n=160 PD, n=114 PPS) [71].
Contrast-Enhanced to Non-Contrast Image Translation
Harmonizing heterogeneous clinical datasets containing both contrast-enhanced (T1ce) and non-contrast (T1nce) images requires sophisticated translation methodologies. The experimental protocol for this conversion utilized 307 paired T1ce and T1nce images from 39 hospitals [70]. Researchers implemented and compared multiple 3D U-Net architectures, including variants with residual connections, attention modules, and transformer layers, alongside conditional generative adversarial networks (GANs) using these 3D U-Net variants as generators with patch-based discriminators. The models were trained on 230 image pairs and validated on 77 pairs. Performance validation incorporated both standard image similarity metrics and a downstream segmentation task comparing tissue class volumes (gray matter, white matter, CSF) derived from real T1nce, real T1ce, and synthetic T1nce images using Statistical Parametric Mapping (SPM) software [70].
Multimodal CNN for Parkinsonian Syndrome Differentiation
For discriminating between PD and multiple system atrophy (MSA) variants, a specialized experimental protocol was developed using multimodal 3D convolutional neural networks (CNNs) [72]. The study population included 92 MSA patients (50 MSA-P, 33 MSA-C, 9 mixed) and 64 PD patients. Input features consisted of quantitative maps derived from two distinct MRI sequences: gray matter density (GD) maps from T1-weighted sequences and mean diffusivity (MD) maps from diffusion tensor imaging. These maps were fed to the 3D CNN either individually ("monomodal" - GD or MD only) or in combination ("bimodal" - GD-MD). The CNN architecture was designed to extract spatially hierarchical features from the 3D input volumes, with model interpretability enhanced through analysis of misclassified cases and visualization of highly activated regions in the network's predictions using occlusion techniques [72].
Figure 1: Experimental Workflows for MRI-Based Parkinsonian Syndrome Classification
The Scientist's Toolkit: Essential Research Reagents and Materials
Table 3: Key Research Reagent Solutions for MRI-Based Disease Classification Studies
| Reagent/Software Solution | Function | Application Context |
|---|---|---|
| Swin UNETR Architecture [71] | Self-supervised vision foundation model | Parkinsonism classification from multi-contrast MRI |
| 3D U-Net / Conditional GANs [70] | Cross-contrast image translation | Harmonizing T1ce to synthetic T1nce datasets |
| Pixyl.Neuro.BV [74] | Automated brain volumetry software | Quantitative tissue segmentation and volume measurement |
| FreeSurfer Suite [73] [75] | Automated cortical reconstruction | Cross-sectional and longitudinal morphometry |
| Visual Rating Scales (MTA, GCA) [74] | Semi-quantitative atrophy assessment | Clinical dementia workflow with standardized scoring |
| LF-SynthSR v2 Pipeline [75] | Super-resolution for low-field MRI | Enhancing LF-MRI resolution for volumetric analysis |
| Dynamic Contrast-Enhanced MRI [76] | Blood-brain barrier permeability quantification | Detecting microvascular dysfunction in MCI/AD |
| Gray Matter Density Maps [72] | Voxel-based morphometry input | 3D CNN classification of parkinsonian syndromes |
Discussion and Research Implications
The experimental evidence demonstrates that non-contrast MRI protocols, when enhanced with advanced computational approaches, achieve high diagnostic performance for differentiating parkinsonian syndromes—a crucial capability for clinical trial enrollment and therapeutic development. The emerging capability to translate contrast-enhanced images to synthetic non-contrast equivalents using deep learning models addresses a fundamental challenge in real-world data heterogeneity, potentially unlocking vast clinical data warehouses for research purposes [70]. For drug development professionals, this translates to expanded retrospective analysis capabilities and potentially reduced screening failures in clinical trials.
For longitudinal atrophy monitoring—a key endpoint in neuroprotective therapeutic trials—non-contrast T1-weighted imaging remains the established standard due to its well-validated quantitative pipelines and absence of confounding contrast effects. However, dynamic contrast-enhanced (DCE)-MRI offers unique value in early therapeutic development by detecting subtle blood-brain barrier dysfunction that may precede macroscopic atrophy [76], providing a potentially sensitive biomarker for target engagement and early treatment response. The choice between these approaches should be guided by specific research objectives: non-contrast protocols for established atrophy quantification versus contrast-enhanced techniques for investigating microvascular contributions to neurodegeneration or assessing inflammatory components.
Figure 2: Protocol Selection Framework for Parkinsonian Syndrome Research
The comparative analysis of contrast-enhanced versus non-contrast MRI in parkinsonian syndrome classification and atrophy monitoring reveals a nuanced landscape where methodological selection must align with specific research objectives. Non-contrast protocols, particularly when augmented with self-supervised learning and multimodal analysis, demonstrate robust performance in differential diagnosis tasks essential for patient stratification in clinical trials. Contrast-enhanced techniques maintain their indispensable role in evaluating microvascular integrity and blood-brain barrier dysfunction, with emerging translation algorithms enabling retrospective harmonization of heterogeneous datasets. For drug development professionals, these advances translate to improved trial design flexibility and more sophisticated biomarker development capabilities, ultimately accelerating therapeutic innovation for neurodegenerative disorders.
Conclusion
The integration of contrast-enhanced and non-contrast MRI for brain volumetry is increasingly viable, powered by robust deep learning segmentation tools that demonstrate high reliability across scan types. This opens avenues for leveraging vast, clinically acquired CE-MR datasets in retrospective research, thereby expanding cohort sizes and diversity. However, methodological rigor remains paramount; researchers must account for significant variability introduced by scanner hardware and carefully select segmentation software validated for their specific image protocols. The dramatic reduction in analysis time achieved by AI models, without compromising diagnostic performance, promises to accelerate biomarker discovery and therapeutic monitoring in clinical trials. Future efforts should focus on standardizing acquisition and analysis pipelines across multicenter studies and further qualifying these volumetric biomarkers for specific regulatory and drug development contexts to fully realize their translational potential.
References
- 1. MRI With vs Without Contrast: What's the Difference? [https://www.myssmi.com/blog/with-contrast-vs-without-what-s-the-difference]
- 2. MRI With Contrast Vs. MRI Without Contrast: Key Differences [https://sisimaging.com/mri-with-contrast-vs-mri-without-contrast/]
- 3. Should You Get an MRI With or Without Contrast? [https://ezra.com/blog/mri-with-or-without-contrast]
- 4. Comparison of the diagnostic performance of non-contrast ... [https://pubmed.ncbi.nlm.nih.gov/39863727/]
- 5. Comparative evaluation of non-contrast MRI versus gadoxetic ... [https://insightsimaging.springeropen.com/articles/10.1186/s13244-024-01886-3]
- 6. Comparative analysis of brain volumetric measurements ... [https://pubmed.ncbi.nlm.nih.gov/39788481]
- 7. Comparative analysis of brain volumetric measurements ... [https://www.sciencedirect.com/science/article/abs/pii/S0304394025000060]
- 8. Contrast-enhanced to non-contrast ... - BMC Medical Imaging [https://bmcmedimaging.biomedcentral.com/articles/10.1186/s12880-024-01242-3]
- 9. Enabling new insights from old scans by repurposing ... [https://www.nature.com/articles/s41467-025-58274-8]
- 10. MRI Contrast Agents for Pharmacological Research - PMC [https://pmc.ncbi.nlm.nih.gov/articles/PMC4673339/]
- 11. Editorial: Magnetic resonance imaging contrast agents [https://www.frontiersin.org/journals/toxicology/articles/10.3389/ftox.2025.1664840/full]
- 12. The safety of magnetic resonance imaging contrast agents [https://pmc.ncbi.nlm.nih.gov/articles/PMC11345262/]
- 13. Pharmacokinetics, safety, and tolerability of the novel ... [https://www.sciencedirect.com/science/article/pii/S0928098724000605]
- 14. a review of contrast media pharmacokinetics and updated ... [https://link.springer.com/article/10.1007/s00330-023-10085-5]
- 15. MRI Contrast Agents Market Size & Share Analysis [https://www.mordorintelligence.com/industry-reports/mri-contrast-agents-market]
- 16. Comparative analysis of brain volumetric measurements ... [https://www.sciencedirect.com/science/article/pii/S0304394025000060]
- 17. A Comparison of Global Brain Volumetrics Obtained from ... [https://pmc.ncbi.nlm.nih.gov/articles/PMC8985680/]
- 18. Top 12 3D Visualization Programs for Medical Imaging in ... [https://pycad.co/3-d-visualization-programs/]
- 19. Top Medical Imaging Datasets & Healthcare Data Sources for ... [https://collectiveminds.health/articles/medical-imaging-datasets-complete-guide-to-healthcare-data-resources]
- 20. MRI contrast agents and retention in the brain: review of ... [https://insightsimaging.springeropen.com/articles/10.1186/s13244-024-01763-z]
- 21. Volumetry of Selected Brain Regions—Can We Compare ... [https://link.springer.com/article/10.1007/s00062-024-01489-x]
- 22. BOUNTI: Brain and aUtomated parcellatioN for 3D feTal vOlumetry MRI [https://elifesciences.org/reviewed-preprints/88818]
- 23. Review of synthetic MRI in pediatric brains : Basic principle of MR... [https://pubmed.ncbi.nlm.nih.gov/30853545/]
- 24. Impact of non-contrast-enhanced imaging input sequences ... [https://link.springer.com/article/10.1007/s00330-024-11142-3]
- 25. Frontiers | Deep learning-driven MRI for accurate brain volumetry in... [https://www.frontiersin.org/journals/neuroscience/articles/10.3389/fnins.2025.1632169/full]
- 26. in Biomarkers pathways neurodegenerative [https://www.worldwide.com/blog/2025/04/biomarkers-in-neurodegenerative-pathways/]
- 27. Non-contrast enhanced functional lung MRI in children [https://www.frontiersin.org/journals/pediatrics/articles/10.3389/fped.2025.1519148/full]
- 28. Next-gen MRI agents improve stability and effectiveness [https://www.drugtargetreview.com/news/190494/next-gen-mri-agents-improve-stability-and-effectiveness/]
- 29. A scoping review of automatic and semi-automatic MRI ... [https://www.sciencedirect.com/science/article/pii/S1078817425000197]
- 30. Comparison of automated segmentation techniques for ... [https://bmcmedimaging.biomedcentral.com/articles/10.1186/s12880-023-00974-y]
- 31. Benchmarking Multi-Organ Segmentation Tools for ... [https://arxiv.org/html/2504.07729]
- 32. SynthSeg: Segmentation of brain MRI scans of any contrast ... [https://pmc.ncbi.nlm.nih.gov/articles/PMC10154424/]
- 33. SynthSeg - Free Surfer Wiki [https://surfer.nmr.mgh.harvard.edu/fswiki/SynthSeg]
- 34. A novel deep learning-based brain age prediction ... [https://www.nature.com/articles/s41514-025-00260-x]
- 35. Development and Validation of a Brain Aging Biomarker in ... [https://aging.jmir.org/2025/1/e73004]
- 36. Real‐world brain imaging in a population‐based cohort ... [https://pmc.ncbi.nlm.nih.gov/articles/PMC12284318/]
- 37. MRI Distance Measures as a Predictor of Subsequent ... [https://pmc.ncbi.nlm.nih.gov/articles/PMC12018902/]
- 38. Quantitative brain volumetry in neurological disorders [https://pmc.ncbi.nlm.nih.gov/articles/PMC12243520/]
- 39. Deep learning of MRI contrast enhancement for mapping ... [https://www.frontiersin.org/journals/aging-neuroscience/articles/10.3389/fnagi.2022.923673/full]
- 40. Recommendations to Optimize the Use of Volumetric MRI ... [https://www.frontiersin.org/journals/neurology/articles/10.3389/fneur.2021.712565/full]
- 41. The role of fMRI in drug development - PMC - PubMed Central [https://pmc.ncbi.nlm.nih.gov/articles/PMC5931333/]
- 42. Quantitative Volumetry is Revolutionizing Neuroimaging [https://appliedradiology.com/articles/quantitative-volumetry-is-revolutionizing-neuroimaging]
- 43. With Contrast vs Without - What’s the Difference? [https://www.manhattanmri.com/with-contrast-vs-without-whats-the-difference/]
- 44. Morphological Brain Analysis Using Ultra Low‐Field MRI [https://pmc.ncbi.nlm.nih.gov/articles/PMC12207323/]
- 45. Choice of Processing Pipelines for T1‐Weighted Brain MRI ... [https://pmc.ncbi.nlm.nih.gov/articles/PMC12572822/]
- 46. 2025 Margulis Award | RSNA [https://www.rsna.org/news/2025/november/2025-margulis-award]
- 47. New AI Model Enhances MRI Segmentation for Medical ... [https://www.emjreviews.com/radiology/news/new-ai-model-enhances-mri-segmentation-for-medical-applications/]
- 48. Performance comparison of different medical image fusion ... [https://www.nature.com/articles/s41598-023-43874-5]
- 49. Optimizing MRI sequence classification performance [https://link.springer.com/article/10.1007/s00330-025-11671-5]
- 50. A Study on the Performance Comparison of Brain MRI ... [https://pmc.ncbi.nlm.nih.gov/articles/PMC12565000/]
- 51. AI improves consistency in regional brain volumes ... [https://www.frontiersin.org/journals/neuroimaging/articles/10.3389/fnimg.2025.1588487/full]
- 52. Potential of a Non-Contrast-Enhanced Abbreviated MRI ... [https://pmc.ncbi.nlm.nih.gov/articles/PMC9405909/]
- 53. Regional Brain Volume Changes Across Adulthood [https://pmc.ncbi.nlm.nih.gov/articles/PMC12564870/]
- 54. Deep learning-driven brain tumor classification and ... [https://www.nature.com/articles/s41598-025-13591-2]
- 55. Reproducibility and quality assurance in MRI - PMC [https://pmc.ncbi.nlm.nih.gov/articles/PMC12255543/]
- 56. Toward the future of scientific publishing through ... [https://apertureneuro.org/article/143700-toward-the-future-of-scientific-publishing-through-reproducible-research-artefacts-enabled-by-neurodesk]
- 57. cycle of quality—from concept to clinical and scientific impact [https://link.springer.com/article/10.1007/s10334-025-01272-0]
- 58. Contrast-enhanced to non-contrast-enhanced image ... [https://pubmed.ncbi.nlm.nih.gov/38504179/]
- 59. Ex vivo human brain volumetry: Validation of MRI measurements [https://www.ovid.com/journals/mrim/fulltext/10.1002/mrm.70083~ex-vivo-human-brain-volumetry-validation-of-mri-measurements]
- 60. A Comprehensive MRI Tumor Framework [https://arxiv.org/html/2509.24149v1]
- 61. Comparative validation of AI and non-AI methods in MRI ... [https://www.nature.com/articles/s41598-023-30381-w]
- 62. [2207.11534v1] Comparative Validation of AI and non - AI Methods in... [https://arxiv.org/abs/2207.11534v1]
- 63. Clinical Performance of NeuroQuant: Transforming... - Cortechs. ai [https://www.cortechs.ai/clinical-performance-of-neuroquant-transforming-brain-mri-analysis/]
- 64. Research progress in artificial intelligence for brain metastases [https://pmc.ncbi.nlm.nih.gov/articles/PMC12518232/]
- 65. Machine Learning in MRI Brain Imaging: A Review of ... [https://www.mdpi.com/2075-4418/15/21/2692]
- 66. Benchmarking of deep learning algorithms for 3D instance ... [https://pmc.ncbi.nlm.nih.gov/articles/PMC9009699/]
- 67. Assessing the speed-accuracy trade-offs of popular ... [https://www.sciencedirect.com/science/article/abs/pii/S0895611121000860]
- 68. Deep learning-based automated segmentation for the ... [https://pmc.ncbi.nlm.nih.gov/articles/PMC12150800/]
- 69. AI-Driven High-Resolution Cell Segmentation and ... [https://arxiv.org/html/2505.00578v1]
- 70. - Contrast to enhanced - non - contrast translation to... enhanced image [https://pmc.ncbi.nlm.nih.gov/articles/PMC10953143/]
- 71. Automatic identification of Parkinsonism using clinical multi ... [https://www.sciencedirect.com/science/article/pii/S2352396425002178]
- 72. Deep Learning to Differentiate Parkinsonian Syndromes ... [https://pubmed.ncbi.nlm.nih.gov/40704399/]
- 73. Assessment of brain atrophy as a promising marker of ... [https://pmc.ncbi.nlm.nih.gov/articles/PMC12537736/]
- 74. Radiological Reporting of Brain Atrophy in MRI [https://pmc.ncbi.nlm.nih.gov/articles/PMC12110413/]
- 75. Portable, low-field magnetic resonance imaging for ... [https://www.nature.com/articles/s41467-024-54972-x]
- 76. Diagnostic dynamic contrast-enhanced magnetic resonance ... [https://pmc.ncbi.nlm.nih.gov/articles/PMC12188902/]